- Главная
- Разное
- Дизайн
- Бизнес и предпринимательство
- Аналитика
- Образование
- Развлечения
- Красота и здоровье
- Финансы
- Государство
- Путешествия
- Спорт
- Недвижимость
- Армия
- Графика
- Культурология
- Еда и кулинария
- Лингвистика
- Английский язык
- Астрономия
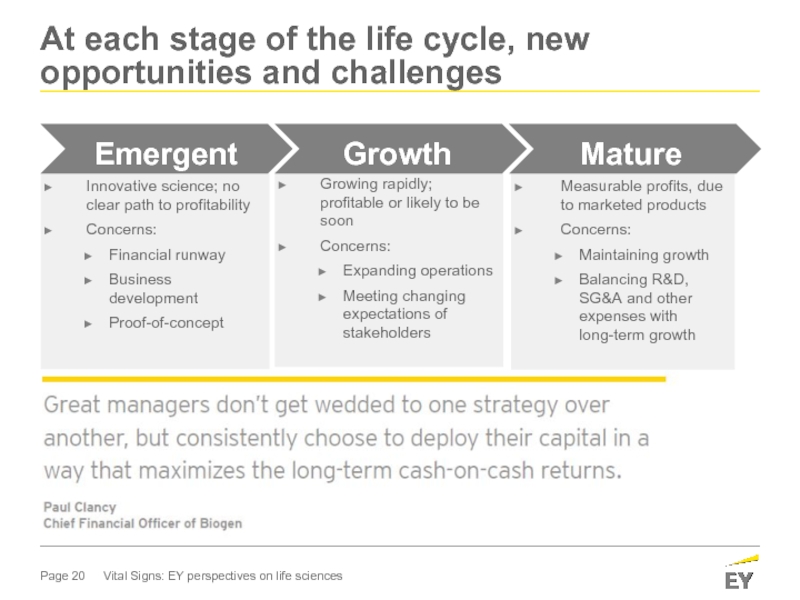
- Алгебра
- Биология
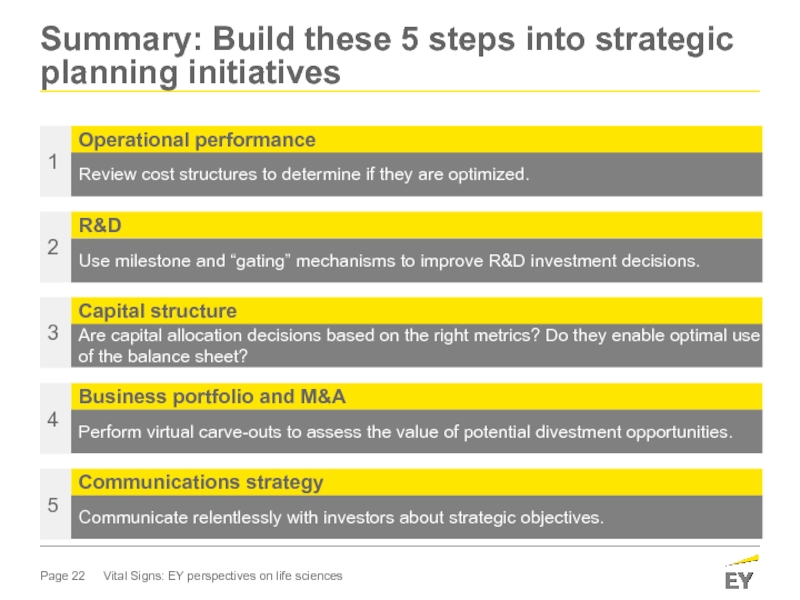
- География
- Детские презентации
- Информатика
- История
- Литература
- Маркетинг
- Математика
- Медицина
- Менеджмент
- Музыка
- МХК
- Немецкий язык
- ОБЖ
- Обществознание
- Окружающий мир
- Педагогика
- Русский язык
- Технология
- Физика
- Философия
- Химия
- Шаблоны, картинки для презентаций
- Экология
- Экономика
- Юриспруденция
How “fit” is your capital allocation strategy? презентация
Содержание
- 1. How “fit” is your capital allocation strategy?
- 2. Today’s speakers Ellen Licking Senior Analyst, Global
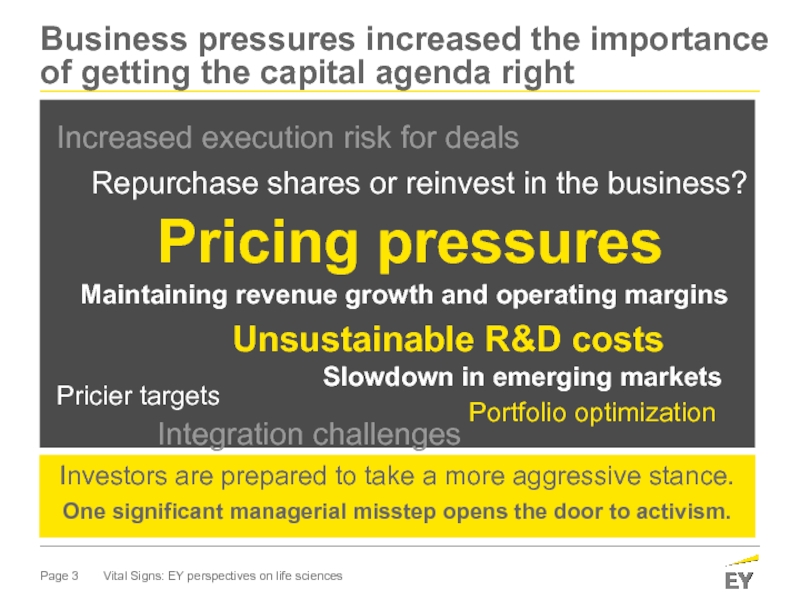
- 3. Pricier targets Increased execution risk for
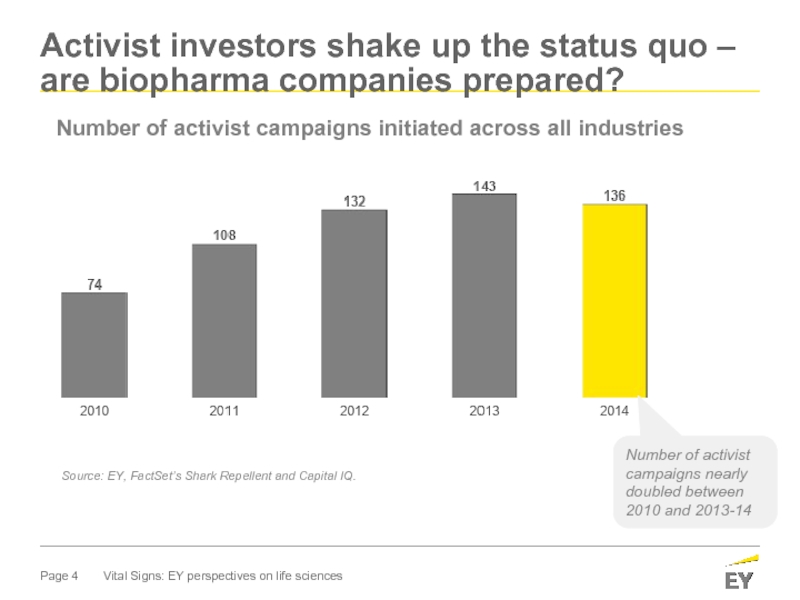
- 4. Activist investors shake up the status quo
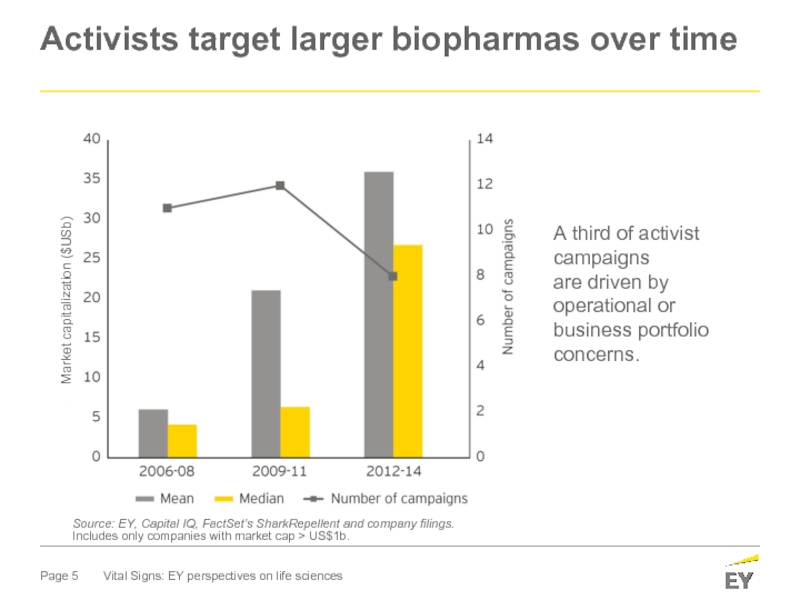
- 5. Activists target larger biopharmas over time
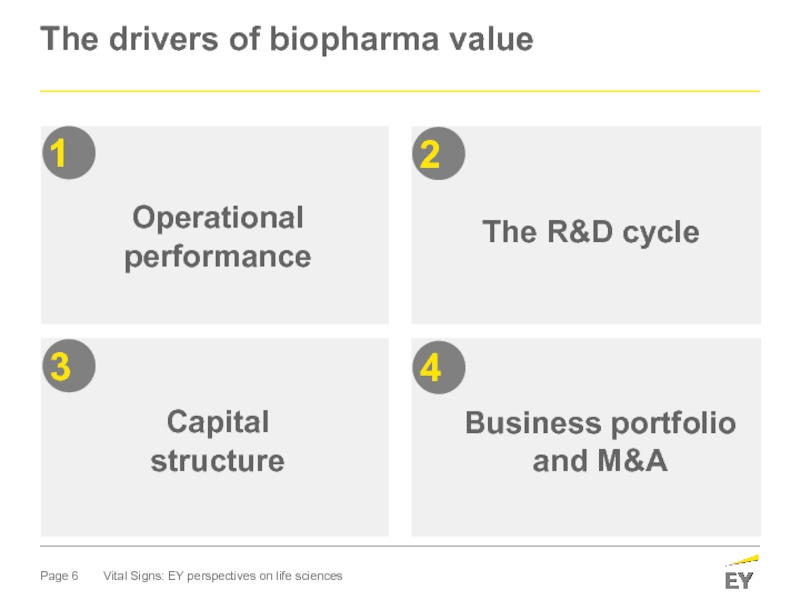
- 6. The drivers of biopharma
- 7. 1. Operational performance Vital signs: EY perspectives
- 8. -1% +18% +15% +14% +14% -0.6% +16%
- 9. Operating margins: big pharma rebounds but still
- 10. Total shareholder return as a performance measure:
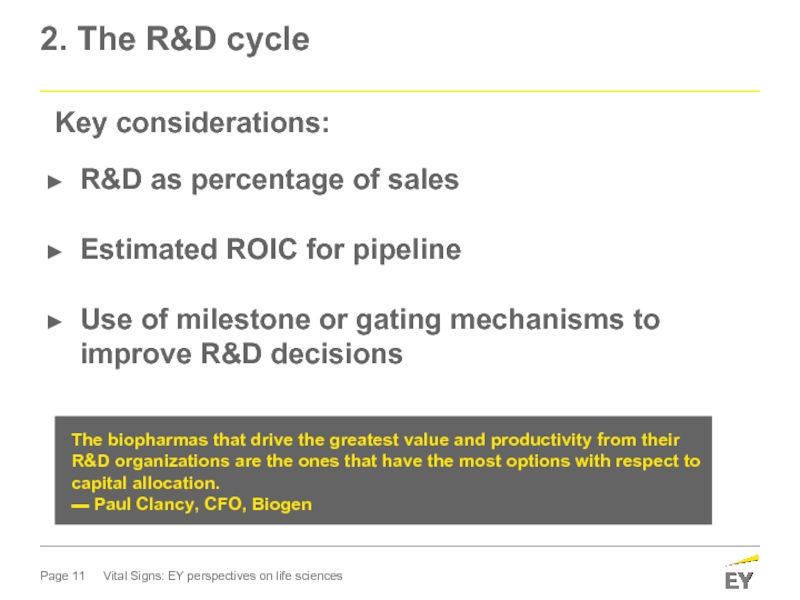
- 11. 2. The R&D cycle Key considerations:
- 12. Nearly 200 new drugs are forecasted to
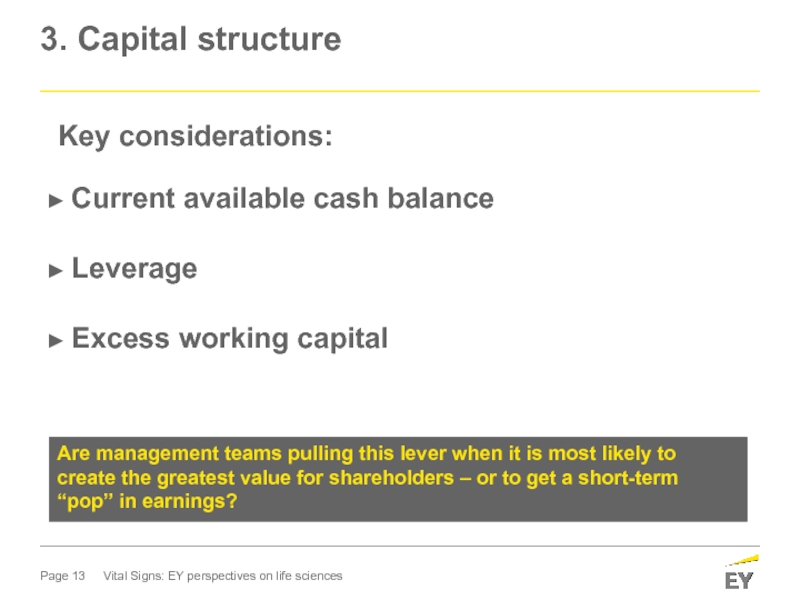
- 13. 3. Capital structure Key considerations:
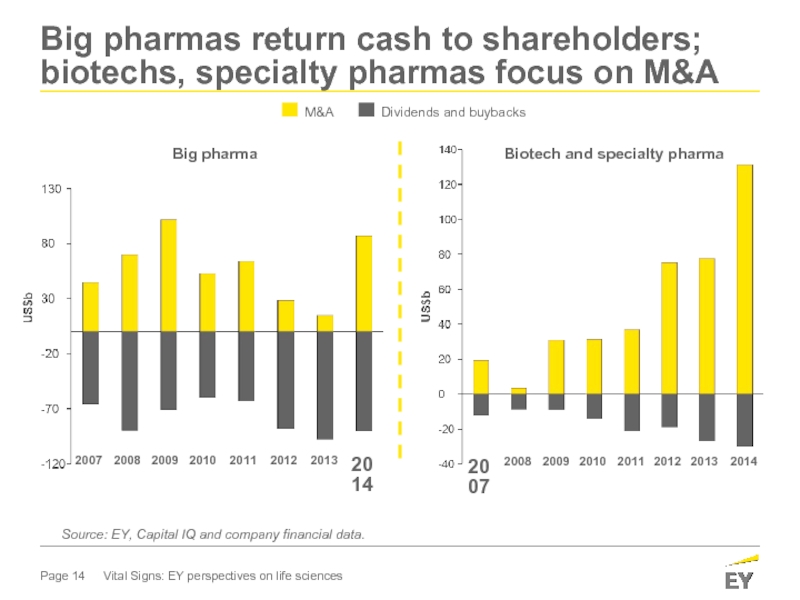
- 14. Big pharmas return cash to shareholders; biotechs,
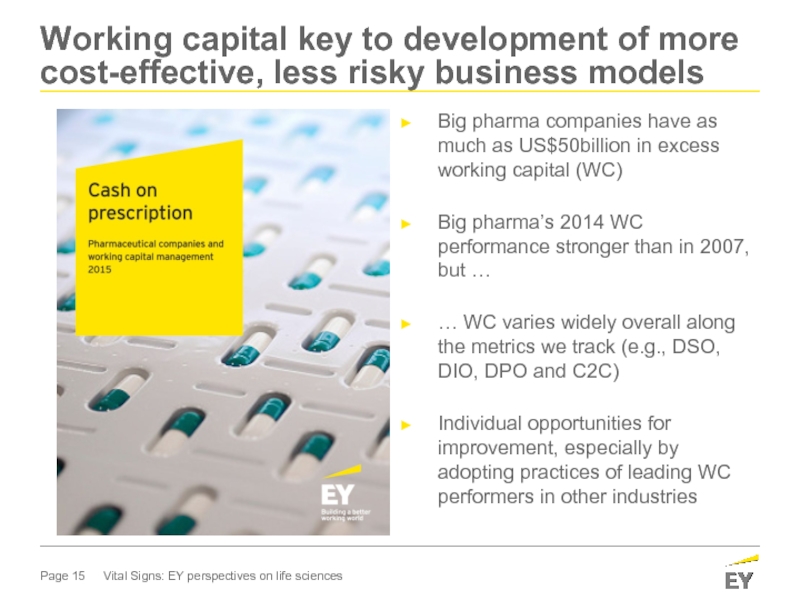
- 15. Working capital key to development of more
- 16. 4. Business portfolio and M&A Key considerations:
- 17. Robust M&A market continues in 2015 with
- 18. As companies focus on core priorities, more
- 19. Creating long-term value
- 20. At each stage of the life cycle,
- 21. Value creation comes from
- 22. Summary: Build these 5 steps into strategic
- 23. Additional information ey.com/vitalsigns http://ow.ly/NTufL
- 24. EY | Assurance | Tax | Transactions
Слайд 2Today’s speakers
Ellen Licking
Senior Analyst, Global Life Sciences Sector
Andrew Forman
Global Life Sciences
Andy Lorenzetti
TAS Divestitures and Integration
Principal, Ernst & Young LLP
David Womelsdorf
Global Client Service Partner and
Principal, Ernst & Young LLP
Слайд 3
Pricier targets
Increased execution risk for deals
Repurchase shares or reinvest in the
Slowdown in emerging markets
Pricing pressures
Portfolio optimization
Maintaining revenue growth and operating margins
Unsustainable R&D costs
Integration challenges
Investors are prepared to take a more aggressive stance.
One significant managerial misstep opens the door to activism.
Business pressures increased the importance of getting the capital agenda right
Слайд 4Activist investors shake up the status quo – are biopharma companies
Source: EY, FactSet’s Shark Repellent and Capital IQ.
Number of activist campaigns nearly doubled between 2010 and 2013-14
Number of activist campaigns initiated across all industries
Слайд 5Activists target larger biopharmas over time
Source: EY, Capital IQ, FactSet’s SharkRepellent
A third of activist campaigns
are driven by
operational or
business portfolio concerns.
Market capitalization ($USb)
Слайд 71. Operational performance
Vital signs: EY perspectives on life sciences
Key considerations:
Revenue growth
Operating
Shareholder return
Other: SG&A, effective tax rates
Simply put, “good enough” operational performance is less relevant if shareholders believe more could be done.
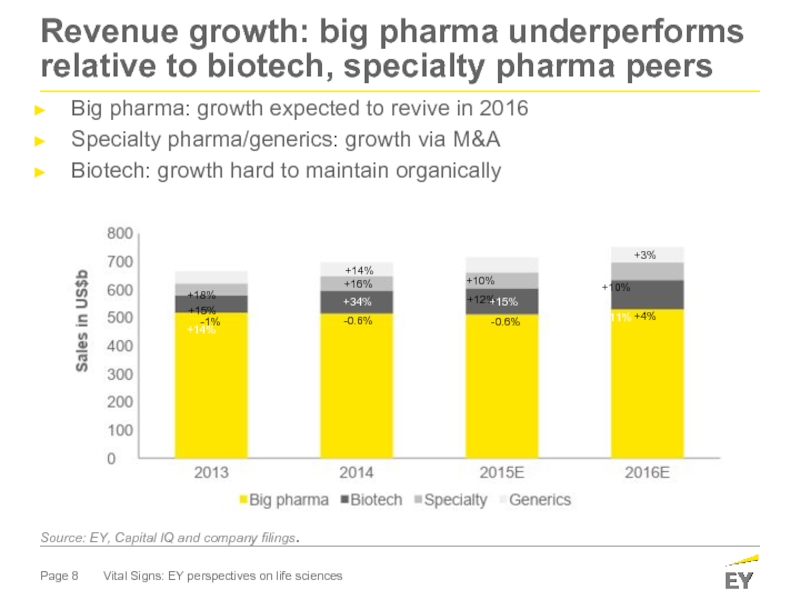
Слайд 8-1%
+18%
+15%
+14%
+14%
-0.6%
+16%
+34%
-0.6%
+10%
+12%
+15%
+3%
+10%
+11%
+4%
Revenue growth: big pharma underperforms relative to biotech, specialty pharma peers
Big pharma: growth expected to revive in 2016
Specialty pharma/generics: growth via M&A
Biotech: growth hard to maintain organically
Source: EY, Capital IQ and company filings.
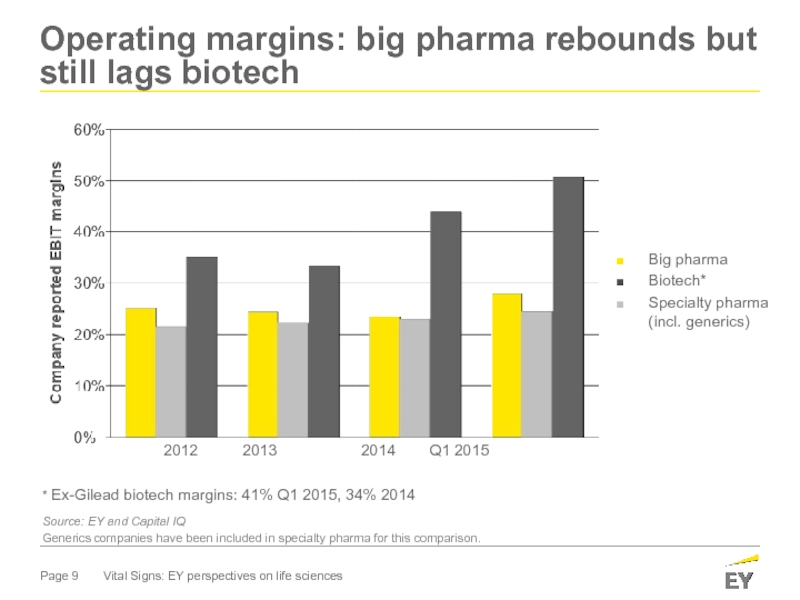
Слайд 9Operating margins: big pharma rebounds but still lags biotech
Generics companies have
Source: EY and Capital IQ
* Ex-Gilead biotech margins: 41% Q1 2015, 34% 2014
Big pharma
Biotech*
Specialty pharma
(incl. generics)
2012 2013 2014 Q1 2015
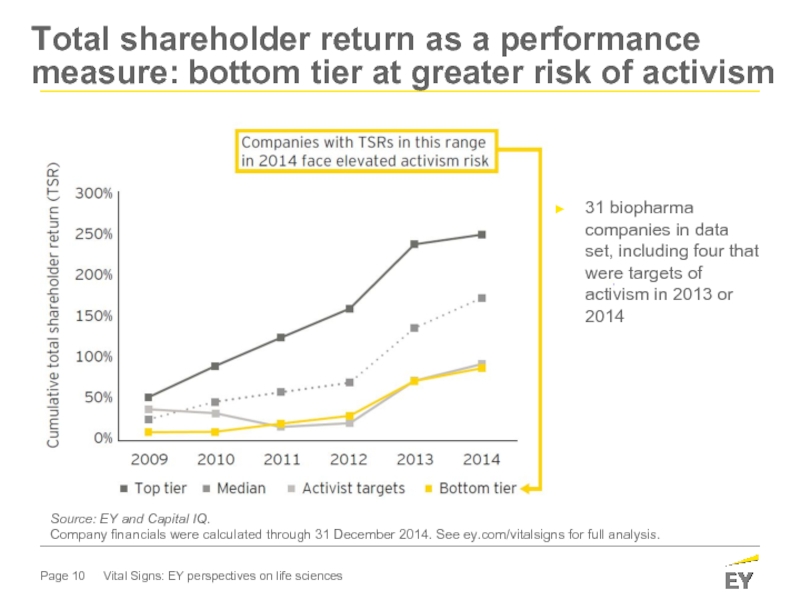
Слайд 10Total shareholder return as a performance measure: bottom tier at greater
Source: EY and Capital IQ.
Company financials were calculated through 31 December 2014. See ey.com/vitalsigns for full analysis.
31 biopharma companies in data set, including four that were targets of activism in 2013 or 2014
Слайд 112. The R&D cycle
Key considerations:
R&D as percentage of sales
Estimated ROIC
Use of milestone or gating mechanisms to improve R&D decisions
The biopharmas that drive the greatest value and productivity from their R&D organizations are the ones that have the most options with respect to capital allocation.
▬ Paul Clancy, CFO, Biogen
Слайд 12Nearly 200 new drugs are forecasted to be launched in the
… continuing a second wave of innovation similar to levels seen in the mid-2000s.
Source: “Global Outlook for Medicines Through 2018,” IMS Health and FDA’s Center for Drug Evaluation and Research.
Number of NME approvals (FDA)
Biopharma pipeline renaissance: analysts project ~ 25% increase in approvals
Слайд 133. Capital structure
Key considerations:
Current available cash balance
Leverage
Excess working capital
Are
Слайд 14Big pharmas return cash to shareholders; biotechs, specialty pharmas focus on
2014
2013
2012
2011
2010
2009
2008
2007
Source: EY, Capital IQ and company financial data.
Big pharma
Biotech and specialty pharma
Слайд 15Working capital key to development of more cost-effective, less risky business
Big pharma companies have as much as US$50billion in excess working capital (WC)
Big pharma’s 2014 WC performance stronger than in 2007, but …
… WC varies widely overall along the metrics we track (e.g., DSO, DIO, DPO and C2C)
Individual opportunities for improvement, especially by adopting practices of leading WC performers in other industries
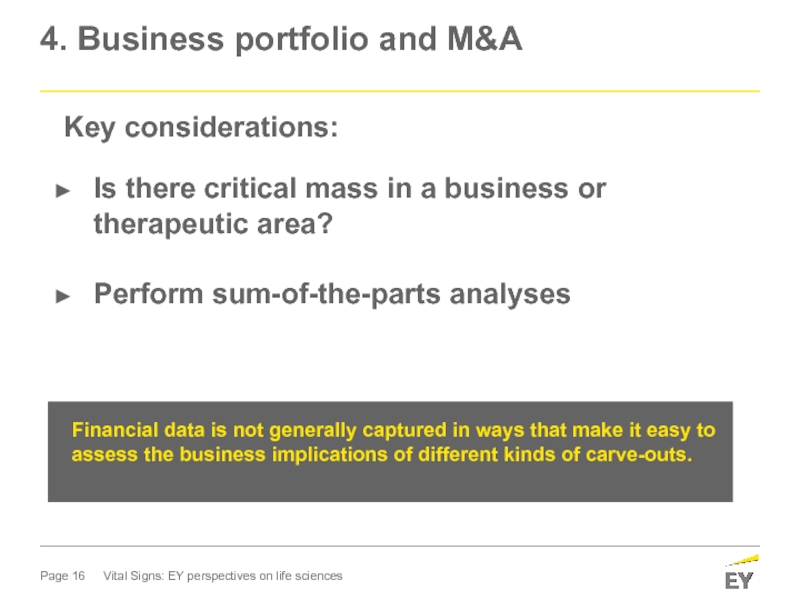
Слайд 164. Business portfolio and M&A
Key considerations:
Is there critical mass in a
Perform sum-of-the-parts analyses
Financial data is not generally captured in ways that make it easy to assess the business implications of different kinds of carve-outs.
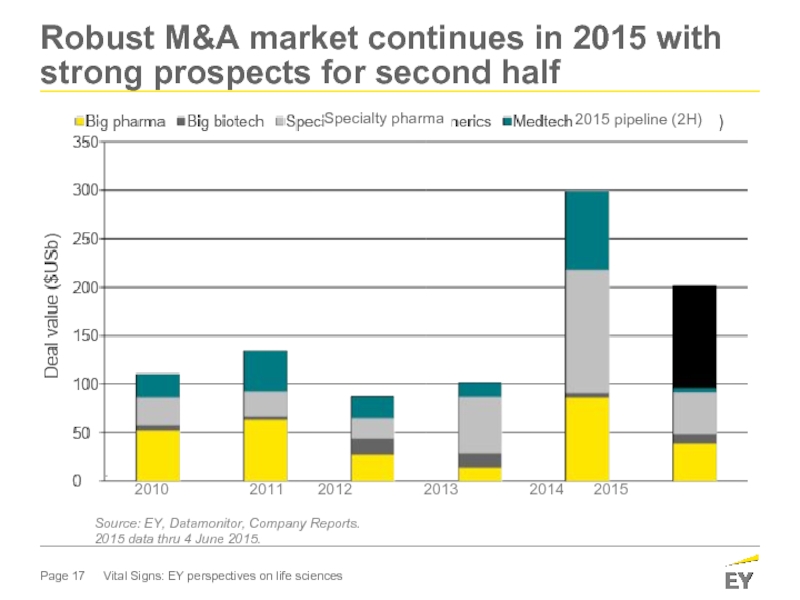
Слайд 17Robust M&A market continues in 2015 with strong prospects for second
Source: EY, Datamonitor, Company Reports.
2015 data thru 4 June 2015.
.
2010 2011 2012 2013 2014 2015
Specialty pharma
2015 pipeline (2H)
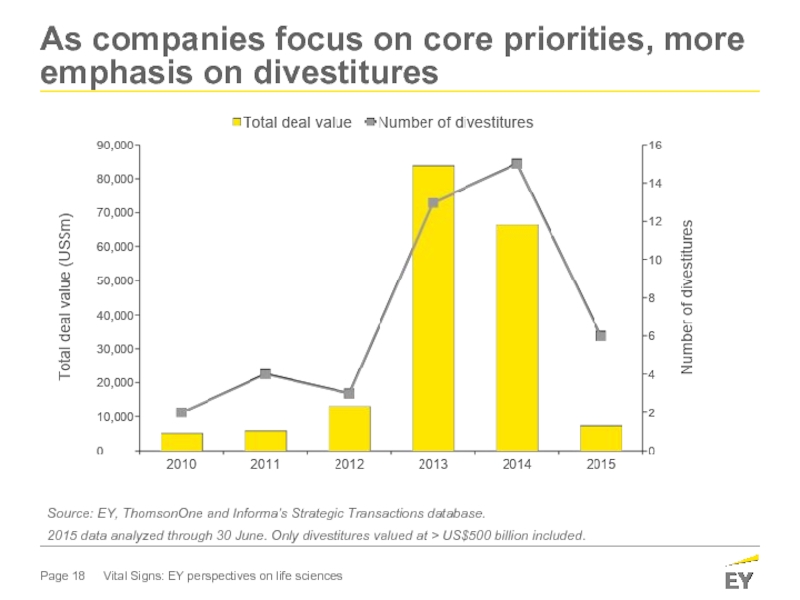
Слайд 18As companies focus on core priorities, more emphasis on divestitures
Source: EY,
2015 data analyzed through 30 June. Only divestitures valued at > US$500 billion included.
Слайд 20At each stage of the life cycle, new opportunities and challenges
Concerns:
Financial runway
Business development
Proof-of-concept
Emergent
Growing rapidly;
profitable or likely to be
soon
Concerns:
Expanding operations
Meeting changing expectations of stakeholders
Growth
Measurable profits, due
to marketed products
Concerns:
Maintaining growth
Balancing R&D, SG&A and other expenses with long-term growth
Mature
Слайд 21
Value creation comes from holistic deployment of capital agenda
The R&D cycle
Capital
Business portfolio
and M&A
2
3
4
Слайд 22Summary: Build these 5 steps into strategic planning initiatives
Review cost structures
Operational performance
1
Use milestone and “gating” mechanisms to improve R&D investment decisions.
R&D
2
Are capital allocation decisions based on the right metrics? Do they enable optimal use of the balance sheet?
Capital structure
3
Perform virtual carve-outs to assess the value of potential divestment opportunities.
Business portfolio and M&A
4
Communicate relentlessly with investors about strategic objectives.
Communications strategy
5
Слайд 24EY | Assurance | Tax | Transactions | Advisory
About EY
EY is
EY refers to the global organization, and may refer to one or more, of the member firms of Ernst & Young Global Limited, each of which is a separate legal entity. Ernst & Young Global Limited, a UK company limited by guarantee, does not provide services to clients. For more information about our organization, please visit ey.com.
Ernst & Young LLP is a client-serving member firm of Ernst & Young Global Limited operating in the US.
© 2015 Ernst & Young LLP.
All Rights Reserved.
1509-1697453
EYG No. FN0234
ED none
ey.com/vitalsigns
ey.com/lifesciences


