- Главная
- Разное
- Дизайн
- Бизнес и предпринимательство
- Аналитика
- Образование
- Развлечения
- Красота и здоровье
- Финансы
- Государство
- Путешествия
- Спорт
- Недвижимость
- Армия
- Графика
- Культурология
- Еда и кулинария
- Лингвистика
- Английский язык
- Астрономия
- Алгебра
- Биология
- География
- Детские презентации
- Информатика
- История
- Литература
- Маркетинг
- Математика
- Медицина
- Менеджмент
- Музыка
- МХК
- Немецкий язык
- ОБЖ
- Обществознание
- Окружающий мир
- Педагогика
- Русский язык
- Технология
- Физика
- Философия
- Химия
- Шаблоны, картинки для презентаций
- Экология
- Экономика
- Юриспруденция
How to Invest When You’re Retired презентация
Содержание
- 1. How to Invest When You’re Retired
- 2. Your Investing Needs Change in Retirement The
- 3. Your Objective: A Careful Balancing Act To
- 4. Reaching that Objective: A Laddered Portfolio Source:
- 5. How Much Do You Need, and Why?
- 6. Matching the Theory to Real Numbers Imagine
- 7. Other Key Assumptions for This Example The
- 8. Building the Ladder Source: pixabay.com Cash: $15,900
- 9. Reminder: Strong Investing Principles Matter As a
- 10. Using the Laddered Portfolio – an Ordinary
- 11. Topping off the Ladder – an Ordinary
- 12. What if the Stock Market Has a
- 13. What if the Stock Market Has a
- 14. What about the bonds? This laddered portfolio
- 15. Balanced Risks -- Solid Chance of Success
- 16. How one Seattle couple secured a $60K Social Security bonus -- and you can too
Слайд 2Your Investing Needs Change in Retirement
The act of retiring drives key
Money stops flowing from your income to your portfolio and starts flowing the other way.
Your investments need to cover short term costs and preserve your long term purchasing power.
“Waiting out” a rough patch in the market or recovering from losses both get tougher to do if you need to sell investments from your portfolio to cover your costs.
Слайд 3Your Objective: A Careful Balancing Act
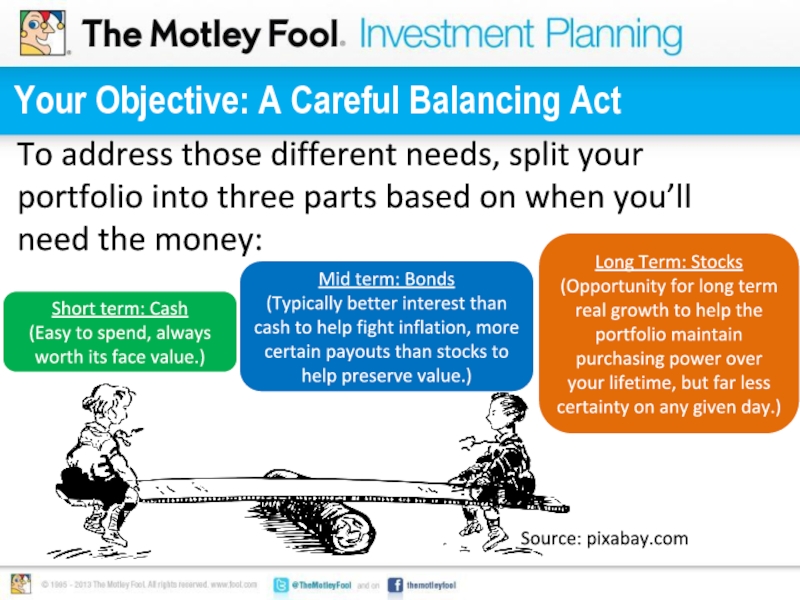
To address those different needs, split
Short term: Cash
(Easy to spend, always worth its face value.)
Mid term: Bonds
(Typically better interest than cash to help fight inflation, more certain payouts than stocks to help preserve value.)
Long Term: Stocks
(Opportunity for long term real growth to help the portfolio maintain purchasing power over your lifetime, but far less certainty on any given day.)
Source: pixabay.com
Слайд 4Reaching that Objective: A Laddered Portfolio
Source: pixabay.com
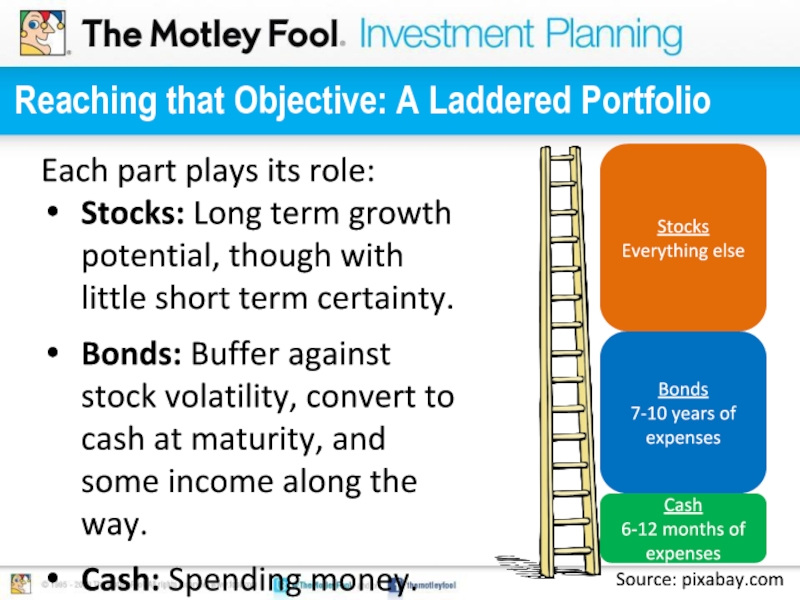
Cash
6-12 months of expenses
Bonds
7-10
Stocks
Everything else
Each part plays its role:
Stocks: Long term growth potential, though with little short term certainty.
Bonds: Buffer against stock volatility, convert to cash at maturity, and some income along the way.
Cash: Spending money.
Слайд 5How Much Do You Need, and Why?
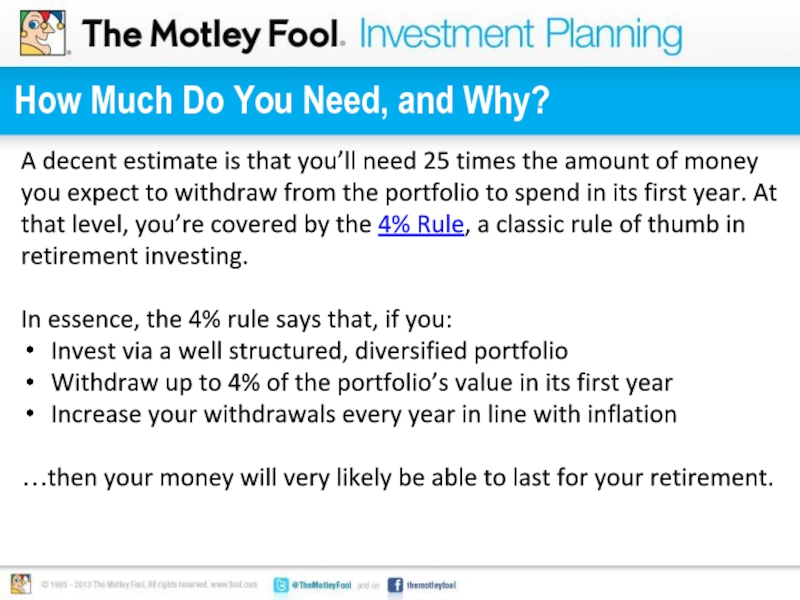
A decent estimate is that
In essence, the 4% rule says that, if you:
Invest via a well structured, diversified portfolio
Withdraw up to 4% of the portfolio’s value in its first year
Increase your withdrawals every year in line with inflation
…then your money will very likely be able to last for your retirement.
Слайд 6Matching the Theory to Real Numbers
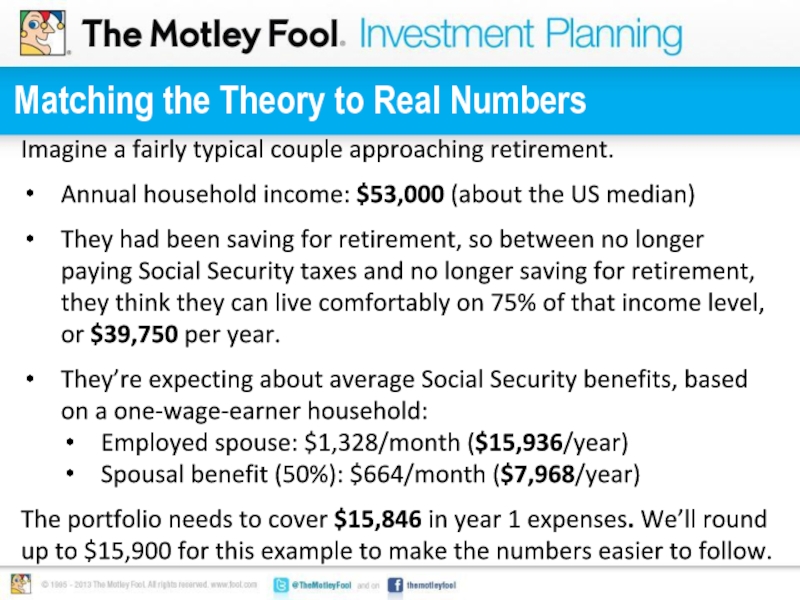
Imagine a fairly typical couple approaching
Annual household income: $53,000 (about the US median)
They had been saving for retirement, so between no longer paying Social Security taxes and no longer saving for retirement, they think they can live comfortably on 75% of that income level, or $39,750 per year.
They’re expecting about average Social Security benefits, based on a one-wage-earner household:
Employed spouse: $1,328/month ($15,936/year)
Spousal benefit (50%): $664/month ($7,968/year)
The portfolio needs to cover $15,846 in year 1 expenses. We’ll round up to $15,900 for this example to make the numbers easier to follow.
Слайд 7Other Key Assumptions for This Example
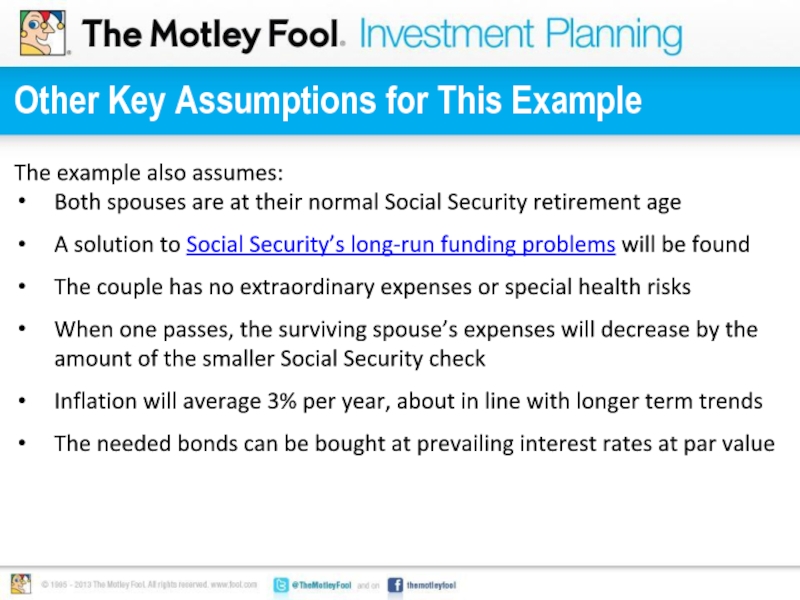
The example also assumes:
Both spouses are
A solution to Social Security’s long-run funding problems will be found
The couple has no extraordinary expenses or special health risks
When one passes, the surviving spouse’s expenses will decrease by the amount of the smaller Social Security check
Inflation will average 3% per year, about in line with longer term trends
The needed bonds can be bought at prevailing interest rates at par value
Слайд 8Building the Ladder
Source: pixabay.com
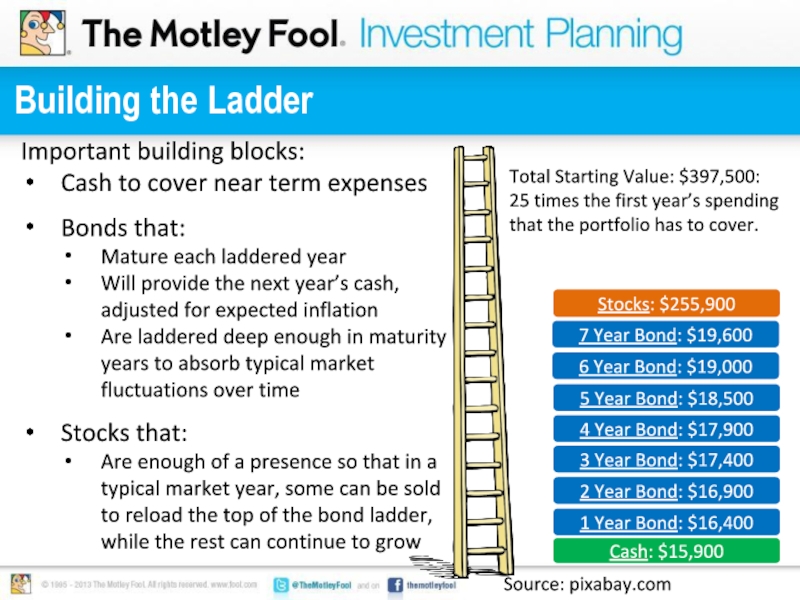
Cash: $15,900
1 Year Bond: $16,400
Stocks: $255,900
2 Year Bond:
3 Year Bond: $17,400
7 Year Bond: $19,600
6 Year Bond: $19,000
5 Year Bond: $18,500
4 Year Bond: $17,900
Total Starting Value: $397,500:
25 times the first year’s spending
that the portfolio has to cover.
Important building blocks:
Cash to cover near term expenses
Bonds that:
Mature each laddered year
Will provide the next year’s cash, adjusted for expected inflation
Are laddered deep enough in maturity years to absorb typical market fluctuations over time
Stocks that:
Are enough of a presence so that in a typical market year, some can be sold to reload the top of the bond ladder, while the rest can continue to grow
Слайд 9Reminder: Strong Investing Principles Matter
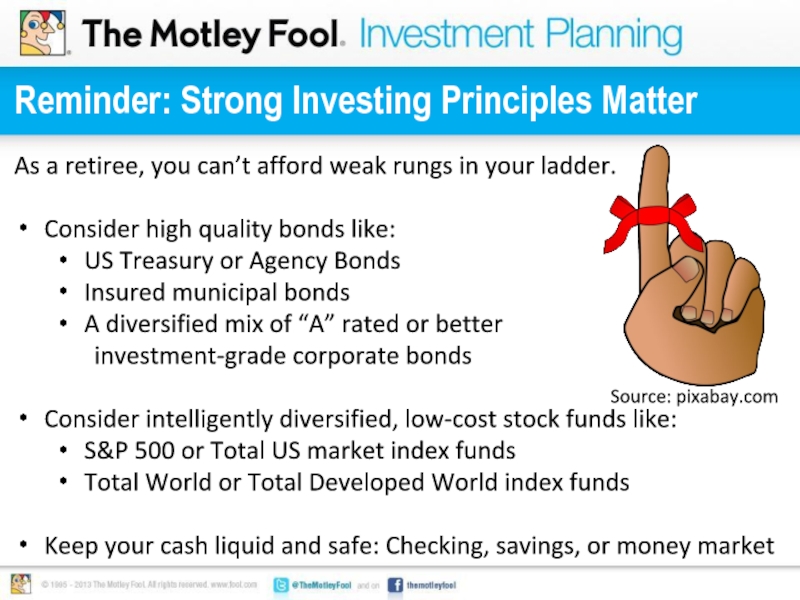
As a retiree, you can’t afford weak
Consider high quality bonds like:
US Treasury or Agency Bonds
Insured municipal bonds
A diversified mix of “A” rated or better
investment-grade corporate bonds
Consider intelligently diversified, low-cost stock funds like:
S&P 500 or Total US market index funds
Total World or Total Developed World index funds
Keep your cash liquid and safe: Checking, savings, or money market
Source: pixabay.com
Слайд 10Using the Laddered Portfolio – an Ordinary Year
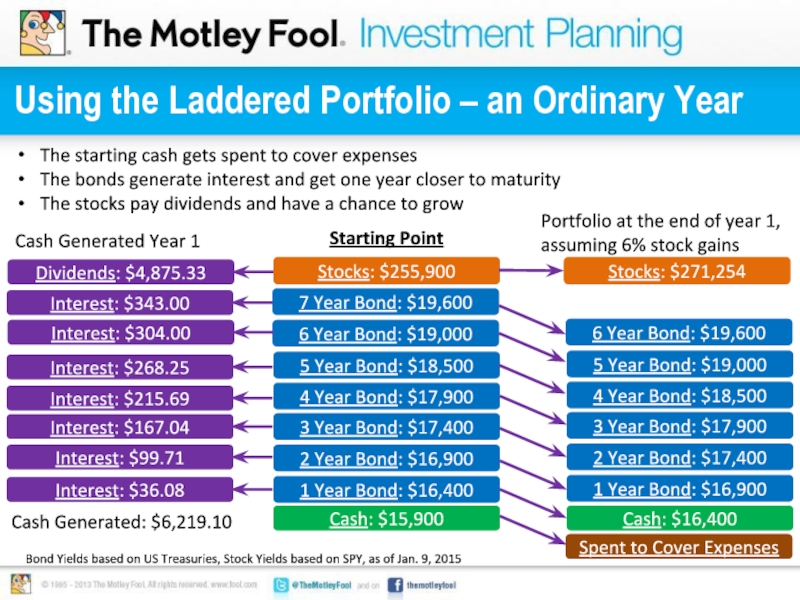
Cash: $15,900
1 Year Bond:
Stocks: $255,900
2 Year Bond: $16,900
3 Year Bond: $17,400
7 Year Bond: $19,600
6 Year Bond: $19,000
5 Year Bond: $18,500
4 Year Bond: $17,900
Cash: $16,400
1 Year Bond: $16,900
2 Year Bond: $17,400
3 Year Bond: $17,900
6 Year Bond: $19,600
5 Year Bond: $19,000
4 Year Bond: $18,500
Interest: $36.08
Interest: $99.71
Interest: $167.04
Interest: $215.69
Interest: $268.25
Interest: $304.00
Interest: $343.00
Dividends: $4,875.33
Spent to Cover Expenses
Cash Generated: $6,219.10
Bond Yields based on US Treasuries, Stock Yields based on SPY, as of Jan. 9, 2015
Stocks: $271,254
The starting cash gets spent to cover expenses
The bonds generate interest and get one year closer to maturity
The stocks pay dividends and have a chance to grow
Cash Generated Year 1
Starting Point
Portfolio at the end of year 1, assuming 6% stock gains
Слайд 11Topping off the Ladder – an Ordinary Year
Cash: $16,400
1 Year Bond:
2 Year Bond: $17,400
3 Year Bond: $17,900
6 Year Bond: $19,600
5 Year Bond: $19,000
4 Year Bond: $18,500
Stocks: $271,254
Generated Cash: $6,219.10
Cash: $16,400
1 Year Bond: $16,900
2 Year Bond: $17,400
3 Year Bond: $17,900
6 Year Bond: $19,600
5 Year Bond: $19,000
4 Year Bond: $18,500
End of Year 1 Portfolio
7 Year Bond: $20,200
Stocks: $257,273.10
Start of Year 2 Portfolio
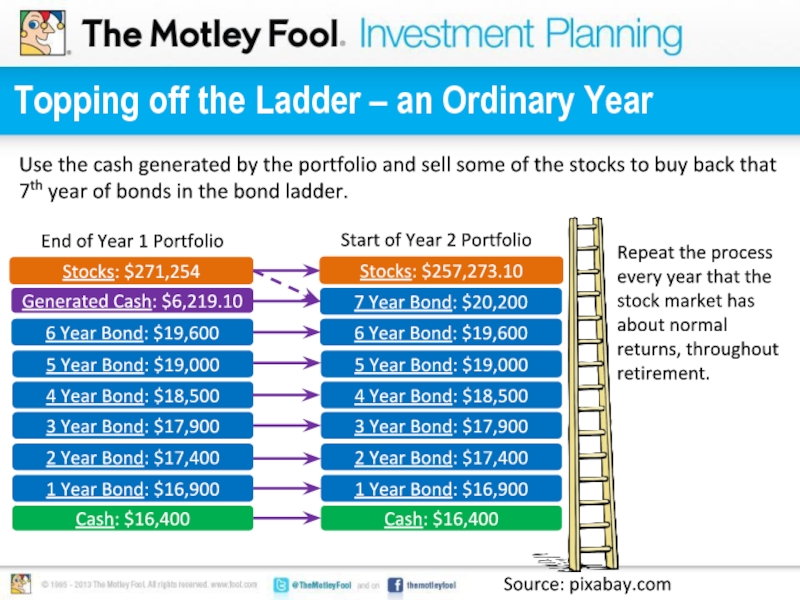
Use the cash generated by the portfolio and sell some of the stocks to buy back that 7th year of bonds in the bond ladder.
Source: pixabay.com
Repeat the process every year that the stock market has about normal returns, throughout retirement.
Слайд 12What if the Stock Market Has a GREAT Year?
Cash: $16,400
1 Year
2 Year Bond: $17,400
3 Year Bond: $17,900
6 Year Bond: $19,600
5 Year Bond: $19,000
4 Year Bond: $18,500
Stocks: $307,080
Generated Cash: $6,219.10
Cash: $16,400
1 Year Bond: $16,900
2 Year Bond: $17,400
3 Year Bond: $17,900
6 Year Bond: $19,600
5 Year Bond: $19,000
4 Year Bond: $18,500
End of Year 1 Portfolio
(assumes 20% stock gains)
7 Year Bond: $20,200
Stocks: $272,299.10
Start of Year 2 Portfolio
8 Year Bond: $20,800
Source: pixabay.com
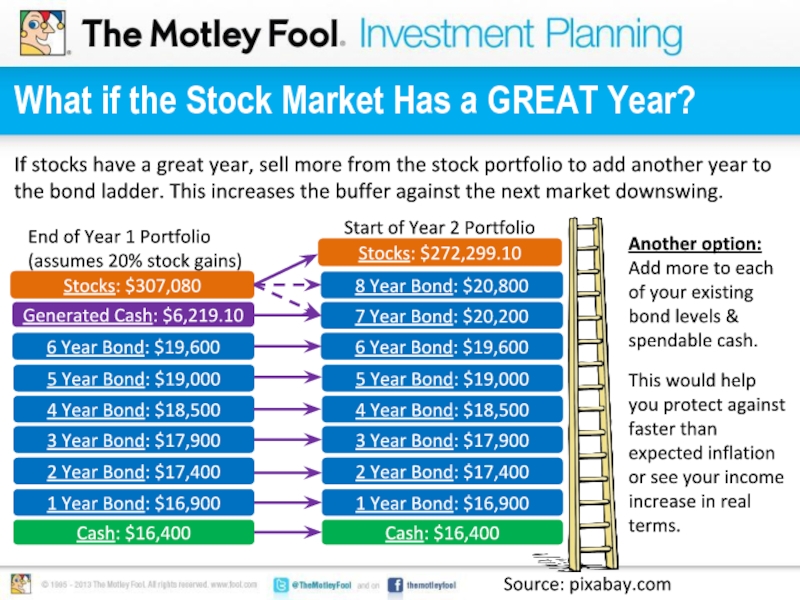
If stocks have a great year, sell more from the stock portfolio to add another year to the bond ladder. This increases the buffer against the next market downswing.
Another option:
Add more to each of your existing bond levels & spendable cash.
This would help you protect against faster than expected inflation or see your income increase in real terms.
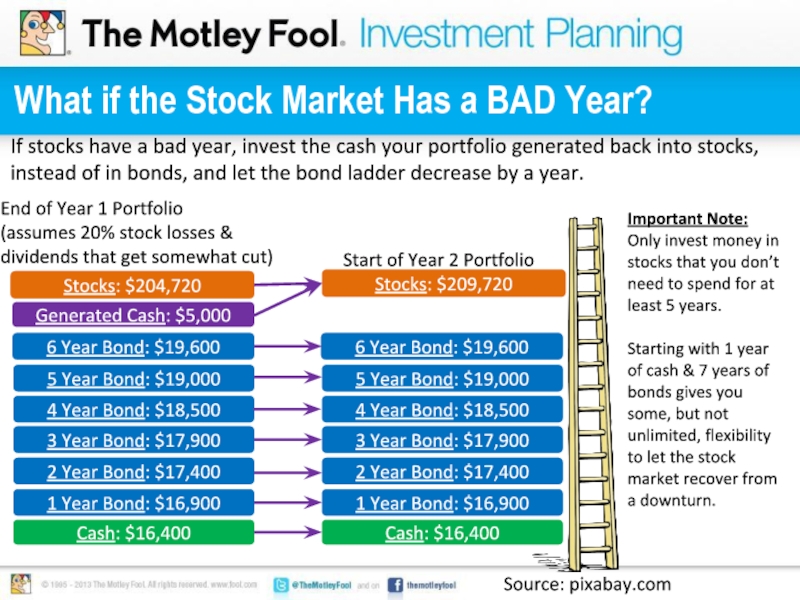
Слайд 13What if the Stock Market Has a BAD Year?
Cash: $16,400
1 Year
2 Year Bond: $17,400
3 Year Bond: $17,900
6 Year Bond: $19,600
5 Year Bond: $19,000
4 Year Bond: $18,500
Stocks: $204,720
Generated Cash: $5,000
Cash: $16,400
1 Year Bond: $16,900
2 Year Bond: $17,400
3 Year Bond: $17,900
6 Year Bond: $19,600
5 Year Bond: $19,000
4 Year Bond: $18,500
End of Year 1 Portfolio
(assumes 20% stock losses &
dividends that get somewhat cut)
Stocks: $209,720
Start of Year 2 Portfolio
Source: pixabay.com
If stocks have a bad year, invest the cash your portfolio generated back into stocks, instead of in bonds, and let the bond ladder decrease by a year.
Important Note:
Only invest money in stocks that you don’t need to spend for at least 5 years.
Starting with 1 year of cash & 7 years of bonds gives you some, but not unlimited, flexibility to let the stock market recover from a downturn.
Слайд 14What about the bonds?
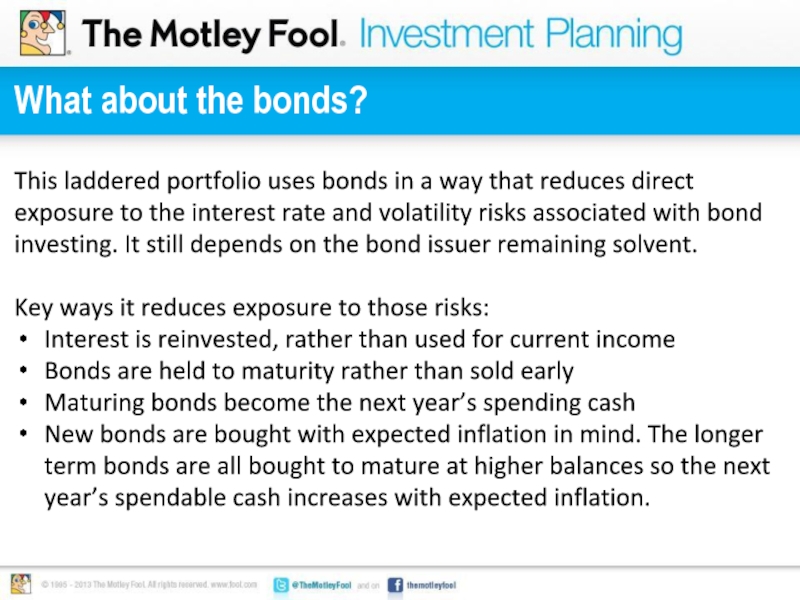
This laddered portfolio uses bonds in a way
Key ways it reduces exposure to those risks:
Interest is reinvested, rather than used for current income
Bonds are held to maturity rather than sold early
Maturing bonds become the next year’s spending cash
New bonds are bought with expected inflation in mind. The longer term bonds are all bought to mature at higher balances so the next year’s spendable cash increases with expected inflation.
Слайд 15Balanced Risks -- Solid Chance of Success
Source: pixabay.com
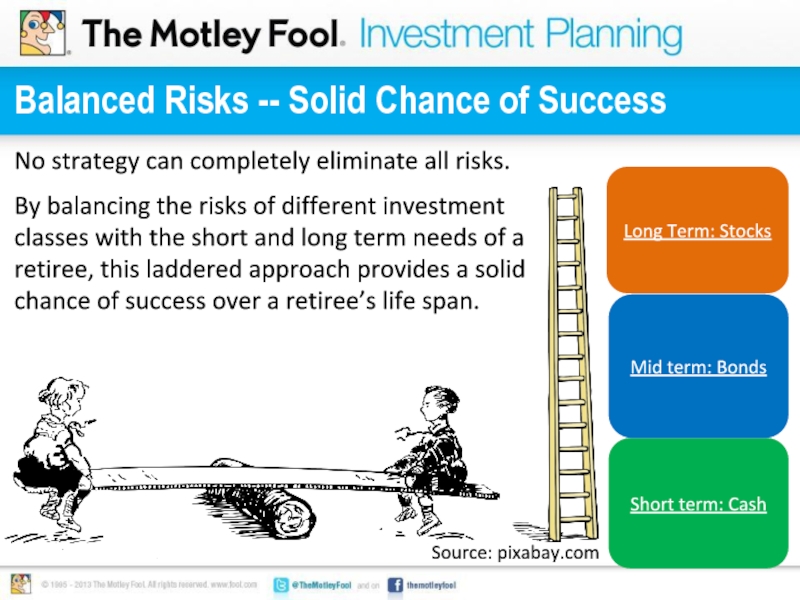
Short term: Cash
Mid
Long Term: Stocks
No strategy can completely eliminate all risks.
By balancing the risks of different investment classes with the short and long term needs of a retiree, this laddered approach provides a solid chance of success over a retiree’s life span.
