- Главная
- Разное
- Дизайн
- Бизнес и предпринимательство
- Аналитика
- Образование
- Развлечения
- Красота и здоровье
- Финансы
- Государство
- Путешествия
- Спорт
- Недвижимость
- Армия
- Графика
- Культурология
- Еда и кулинария
- Лингвистика
- Английский язык
- Астрономия
- Алгебра
- Биология
- География
- Детские презентации
- Информатика
- История
- Литература
- Маркетинг
- Математика
- Медицина
- Менеджмент
- Музыка
- МХК
- Немецкий язык
- ОБЖ
- Обществознание
- Окружающий мир
- Педагогика
- Русский язык
- Технология
- Физика
- Философия
- Химия
- Шаблоны, картинки для презентаций
- Экология
- Экономика
- Юриспруденция
Financial Statement Analysis презентация
Содержание
- 1. Financial Statement Analysis
- 2. Financial Statement Analysis Financial Statements A
- 3. Examples of External Uses of Statement Analysis
- 4. Examples of Internal Uses of Statement Analysis
- 5. Primary Types of Financial Statements Income Statement
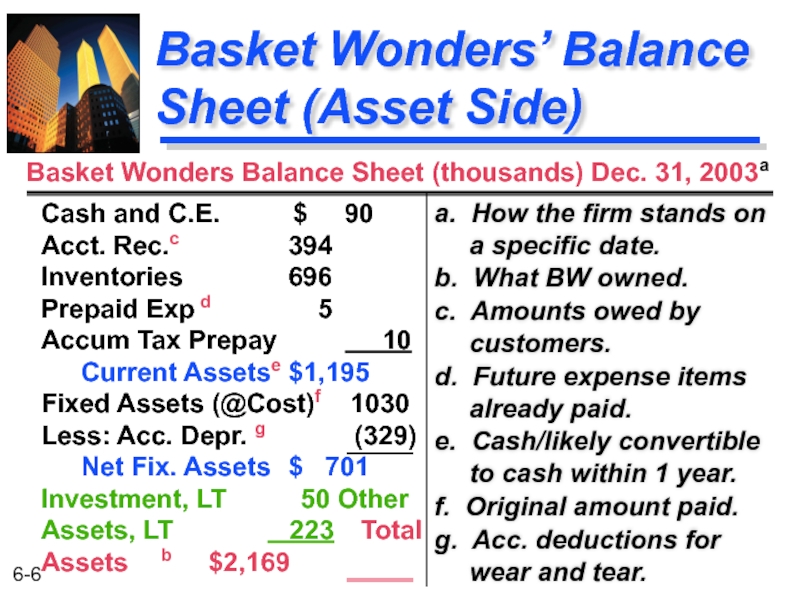
- 6. Basket Wonders’ Balance Sheet (Asset Side) a.
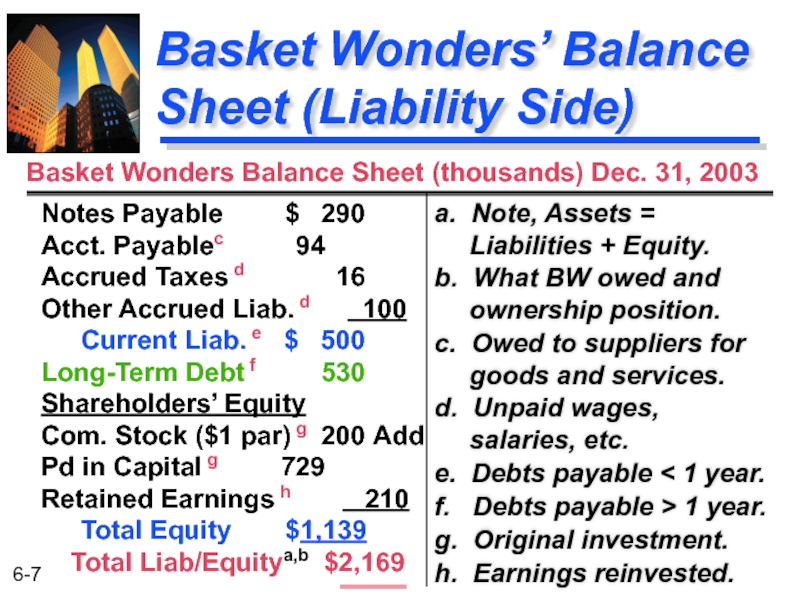
- 7. Basket Wonders’ Balance Sheet (Liability Side) a.
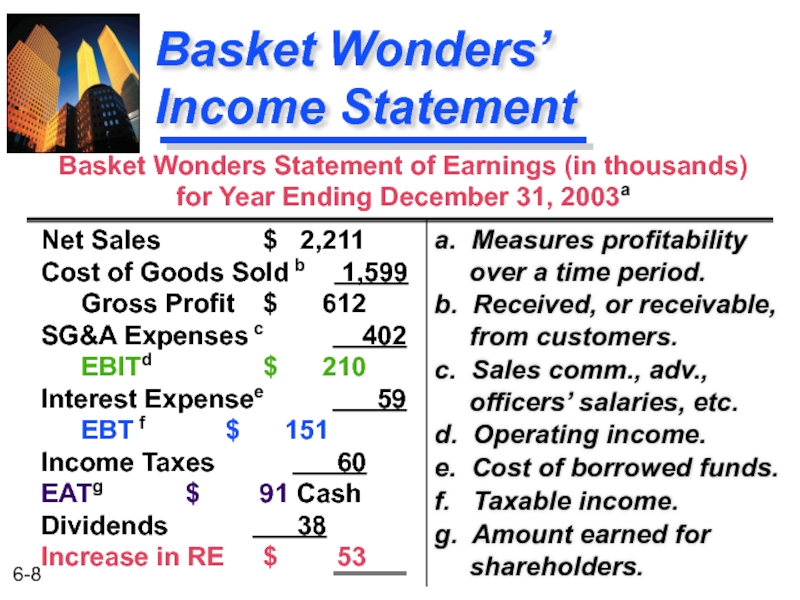
- 8. Basket Wonders’ Income Statement a. Measures profitability
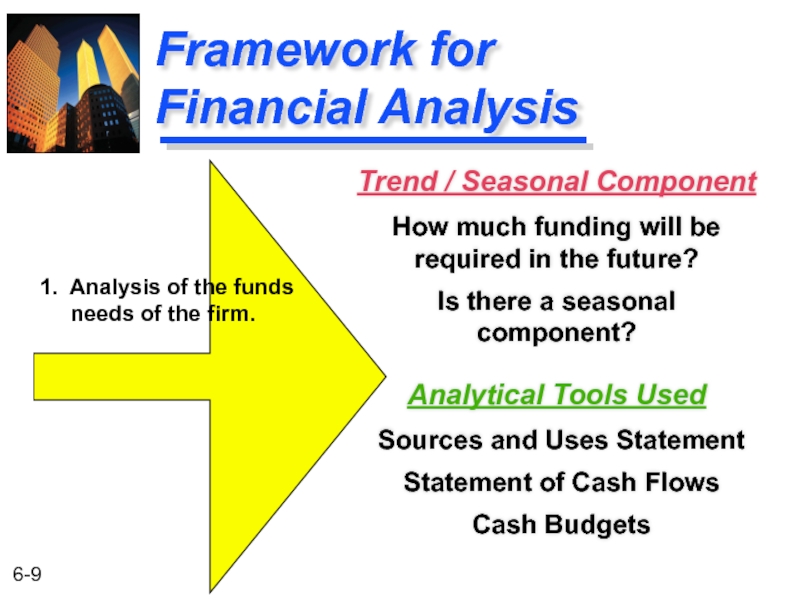
- 9. Framework for Financial Analysis Analytical Tools Used
- 10. Framework for Financial Analysis Health of a
- 11. Framework for Financial Analysis Examples: Volatility in
- 12. Framework for Financial Analysis A Financial Manager
- 13. Framework for Financial Analysis
- 14. Use of Financial Ratios Types of Comparisons
- 15. External Comparisons and Sources of Industry Ratios
- 16. Liquidity Ratios Current Current Assets Current
- 17. Liquidity Ratio Comparisons BW Industry
- 18. Liquidity Ratios Acid-Test (Quick) Current Assets
- 19. Liquidity Ratio Comparisons BW Industry
- 20. Summary of the Liquidity Ratio Comparisons Strong
- 21. Current Ratio -- Trend Analysis Comparison
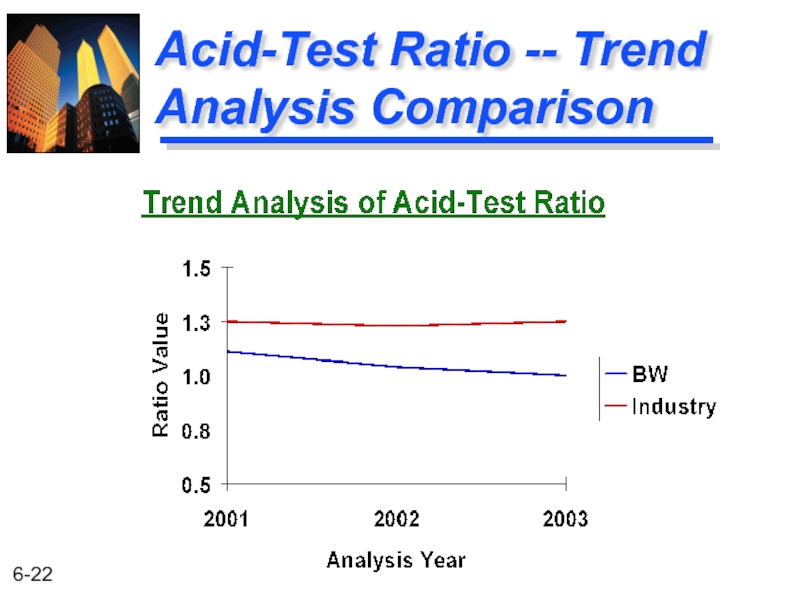
- 22. Acid-Test Ratio -- Trend Analysis Comparison
- 23. Summary of the Liquidity Trend Analyses The
- 24. Financial Leverage Ratios Debt-to-Equity Total Debt
- 25. Financial Leverage Ratio Comparisons BW
- 26. Financial Leverage Ratios Debt-to-Total-Assets Total Debt
- 27. Financial Leverage Ratio Comparisons BW
- 28. Financial Leverage Ratios Total Capitalization
- 29. Financial Leverage Ratio Comparisons BW
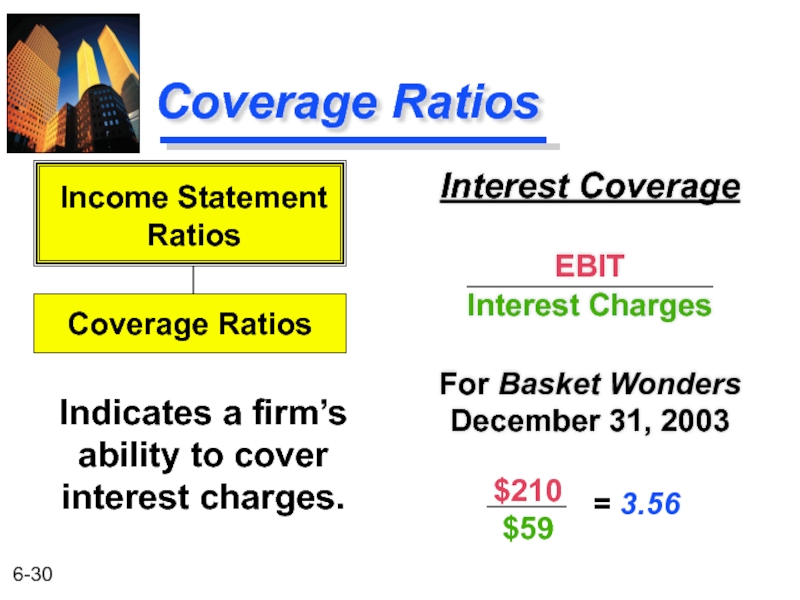
- 30. Coverage Ratios Interest Coverage EBIT Interest
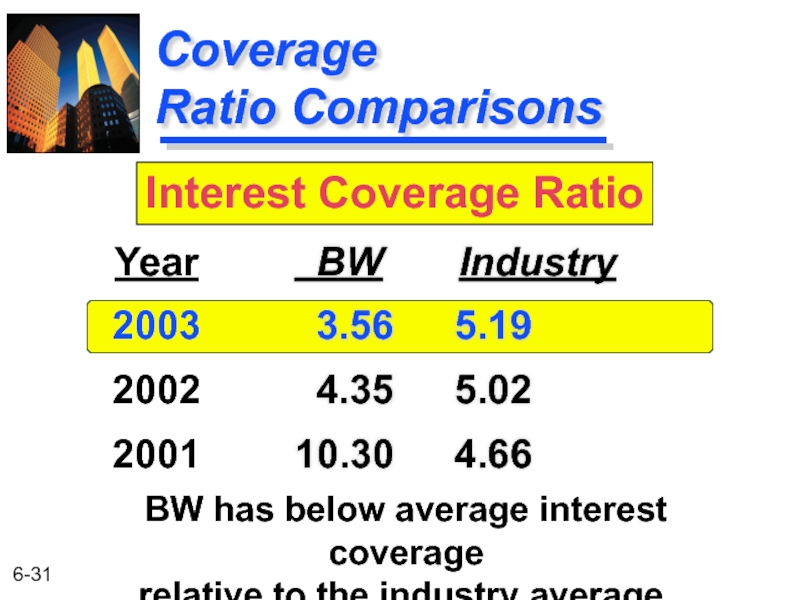
- 31. Coverage Ratio Comparisons BW
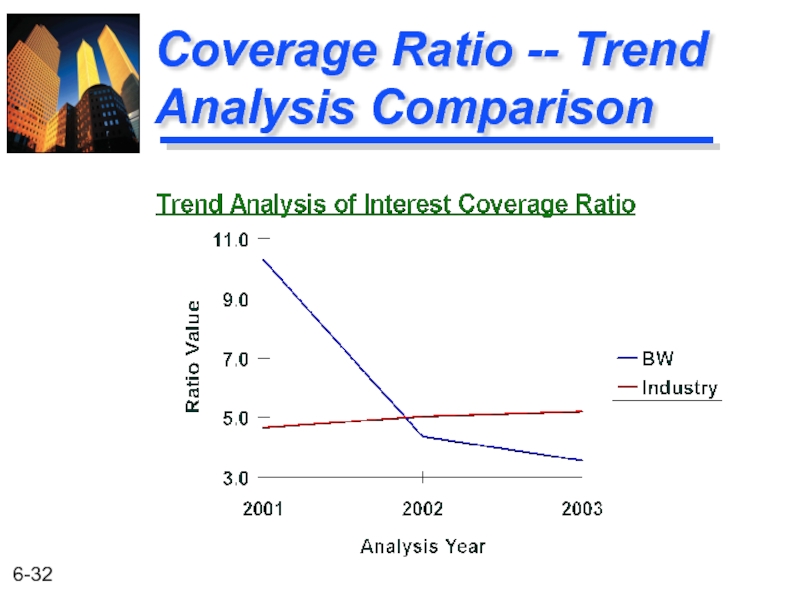
- 32. Coverage Ratio -- Trend Analysis Comparison
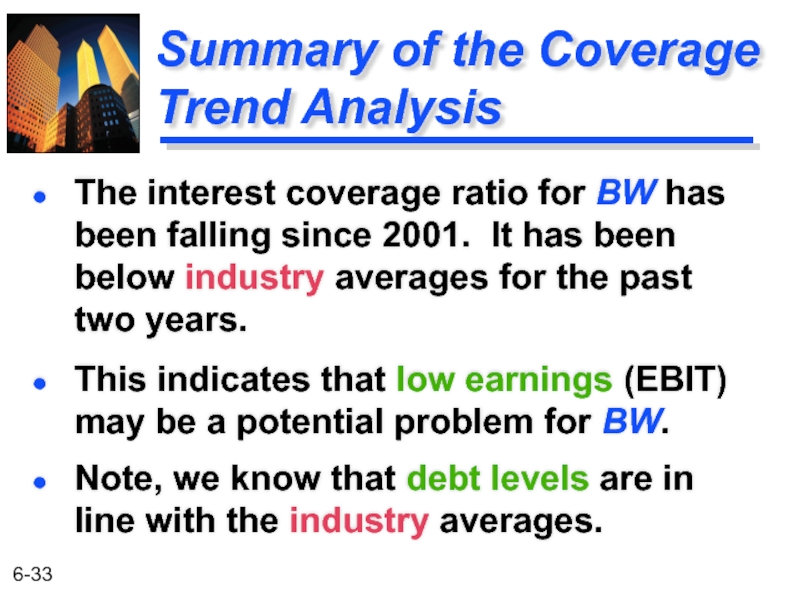
- 33. Summary of the Coverage Trend Analysis This
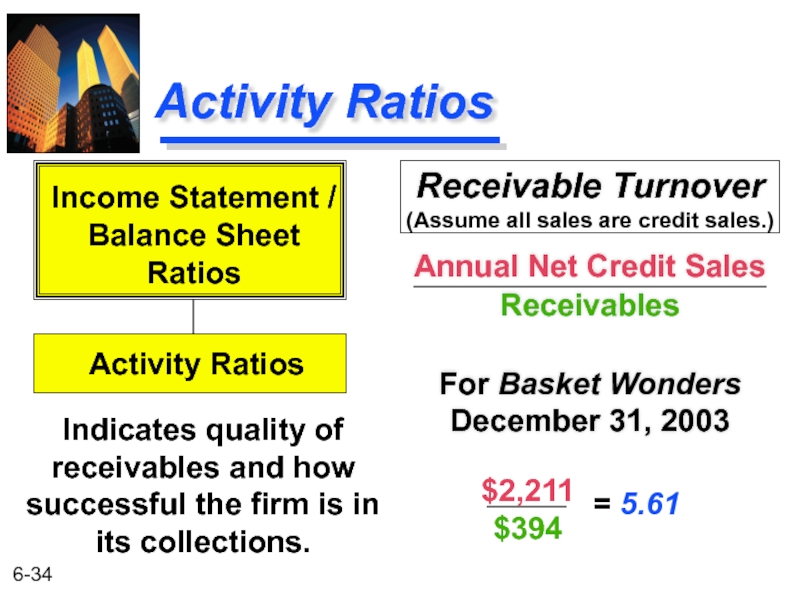
- 34. Activity Ratios Receivable Turnover Annual Net
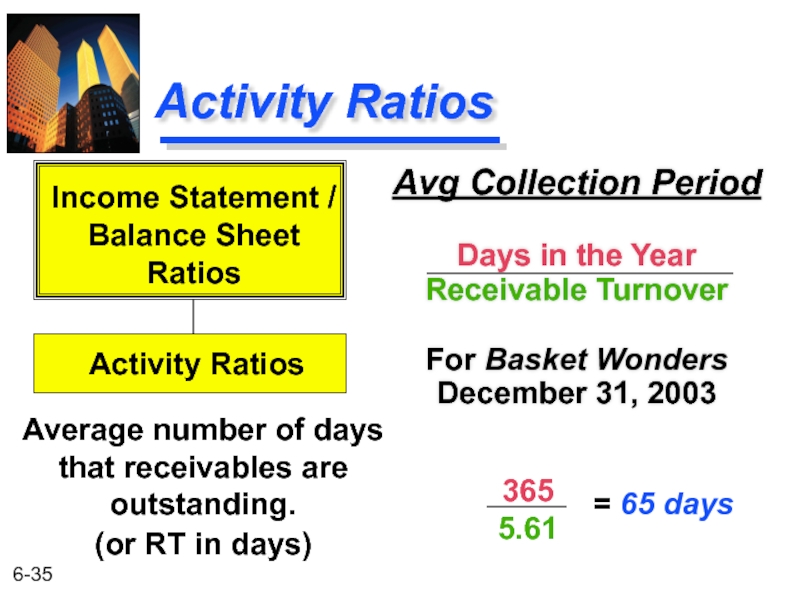
- 35. Activity Ratios Avg Collection Period Days
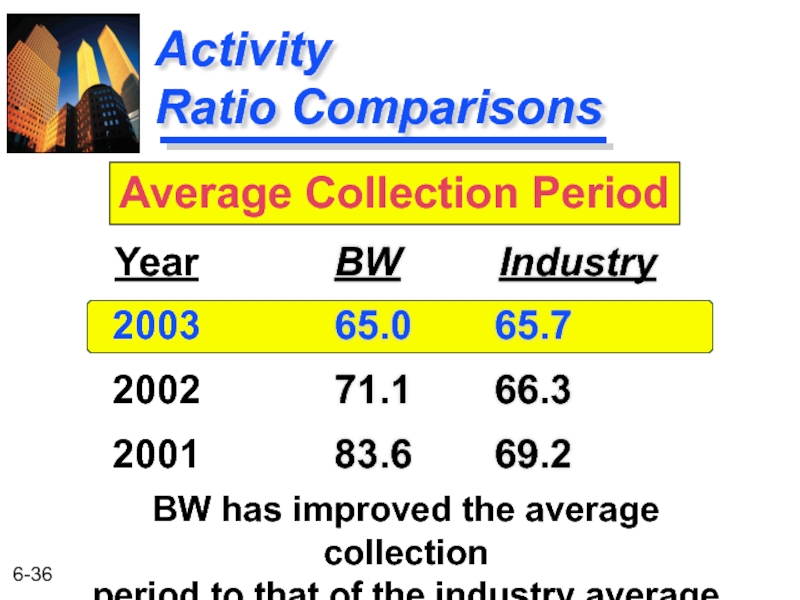
- 36. Activity Ratio Comparisons BW Industry
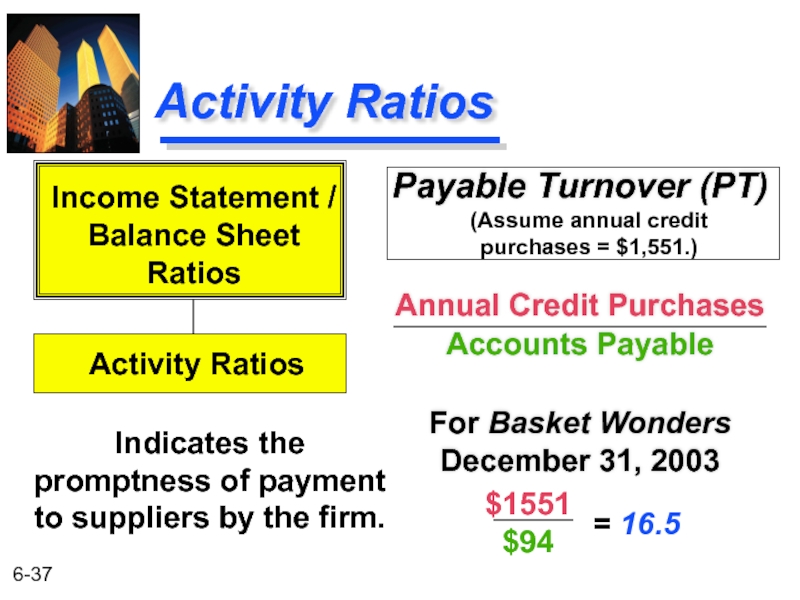
- 37. Activity Ratios Payable Turnover (PT)
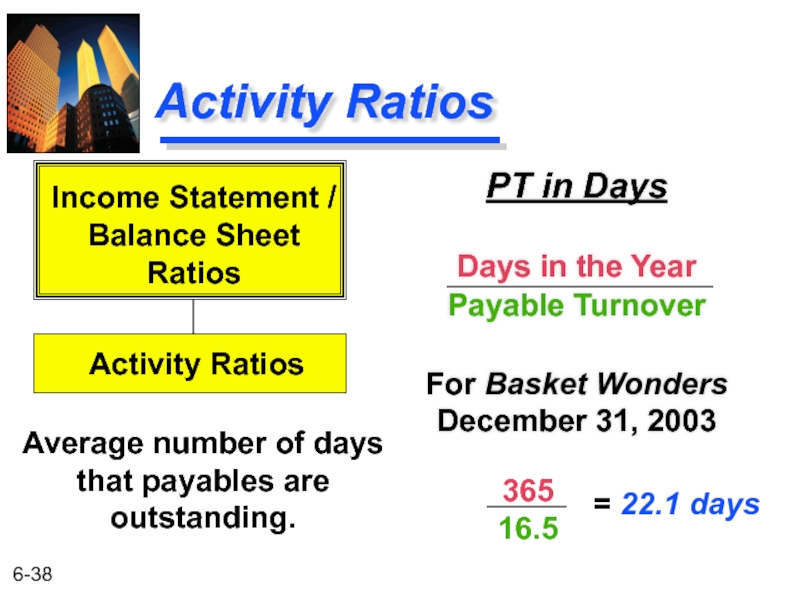
- 38. Activity Ratios PT in Days Days
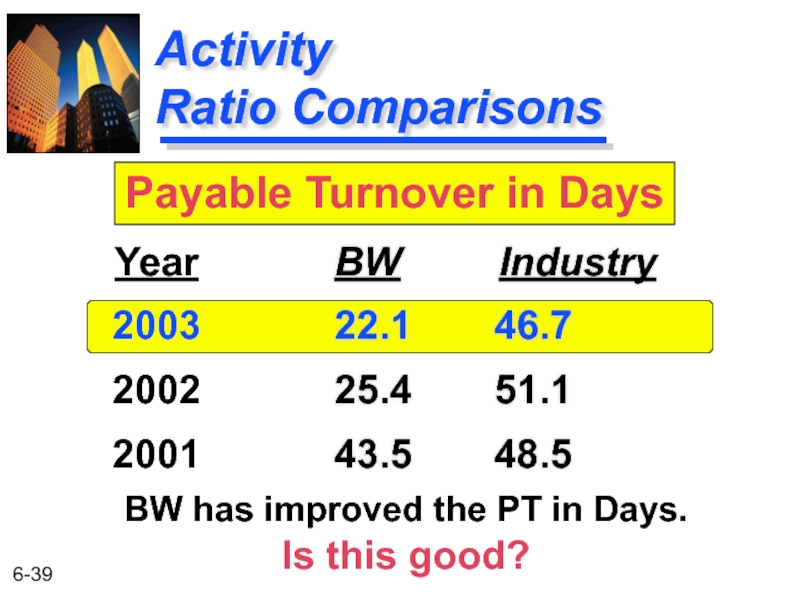
- 39. Activity Ratio Comparisons BW Industry
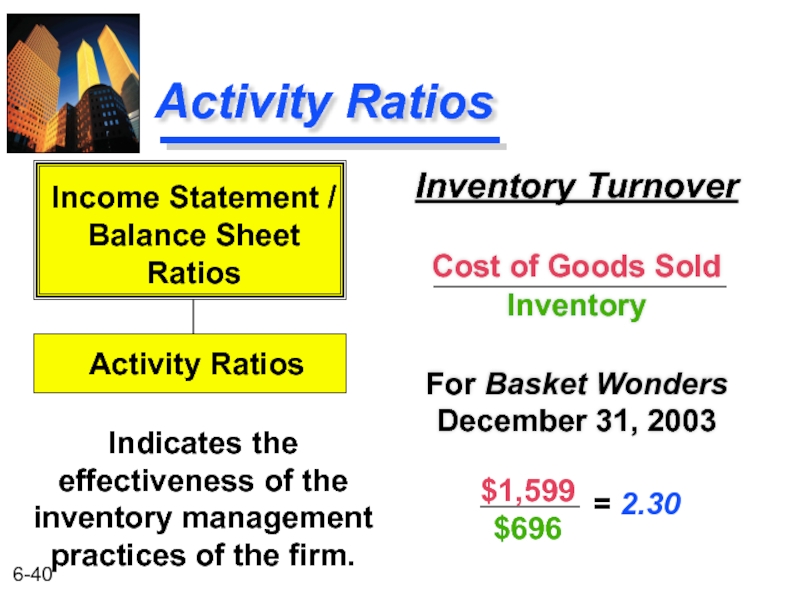
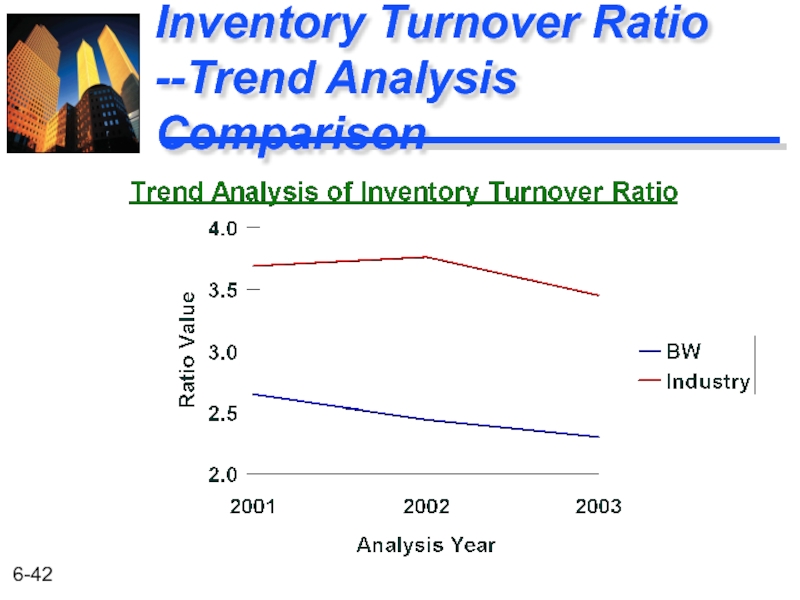
- 40. Activity Ratios Inventory Turnover Cost of
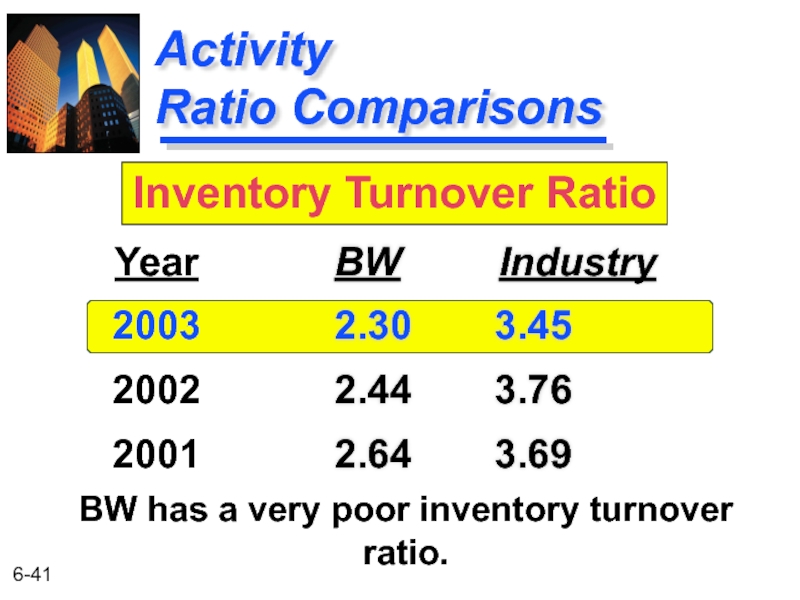
- 41. Activity Ratio Comparisons BW Industry
- 42. Inventory Turnover Ratio --Trend Analysis Comparison
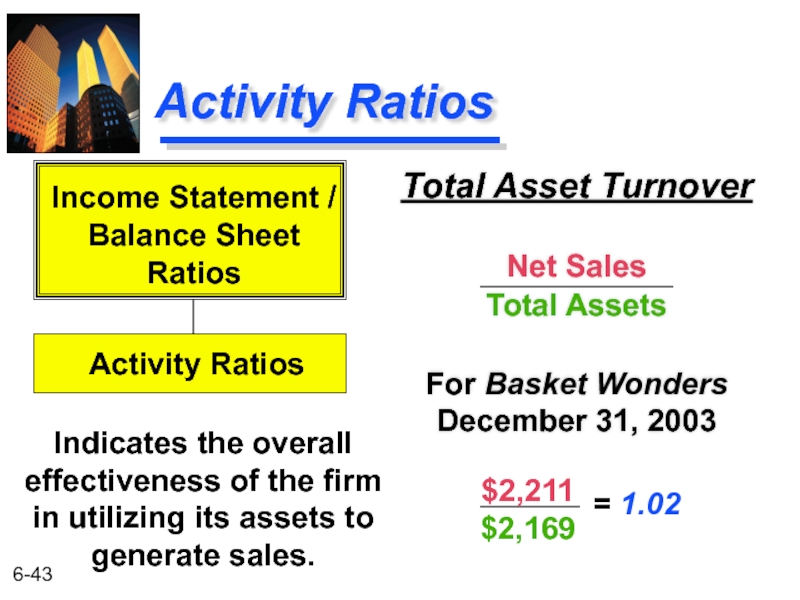
- 43. Activity Ratios Total Asset Turnover Net
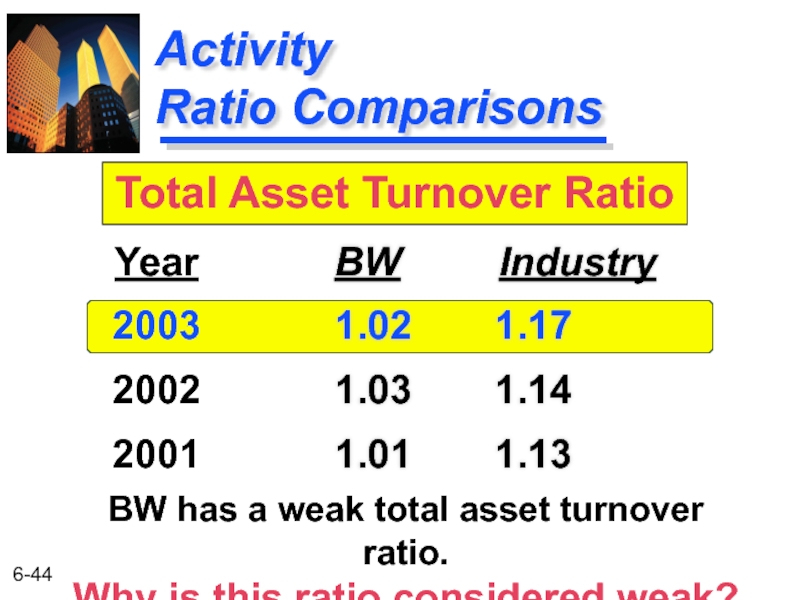
- 44. Activity Ratio Comparisons BW Industry
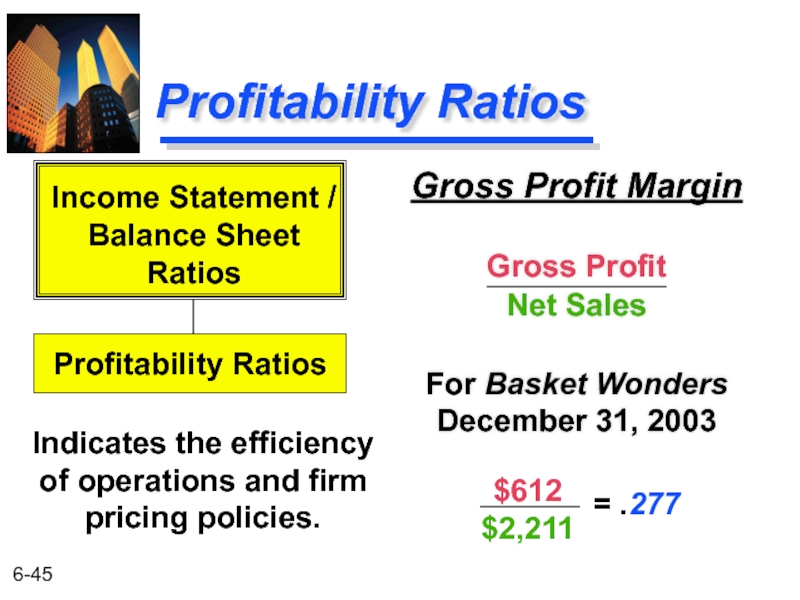
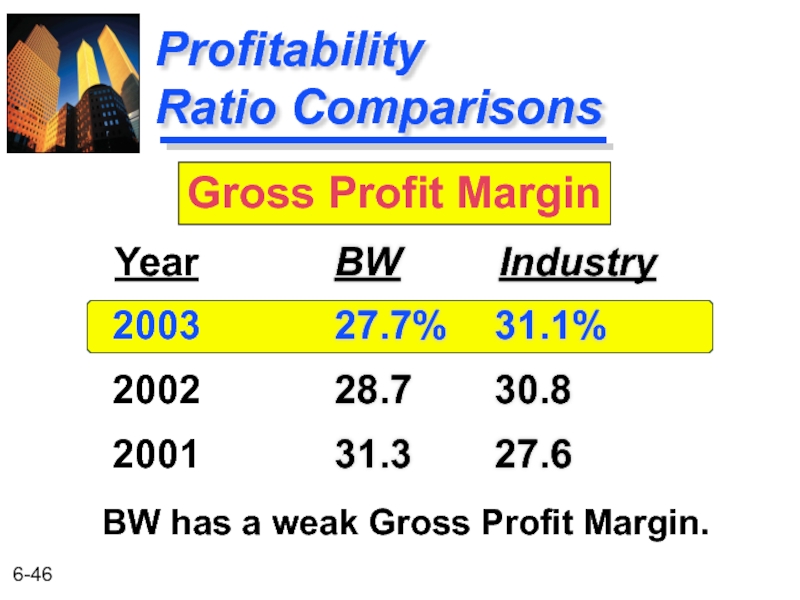
- 45. Profitability Ratios Gross Profit Margin Gross
- 46. Profitability Ratio Comparisons BW Industry
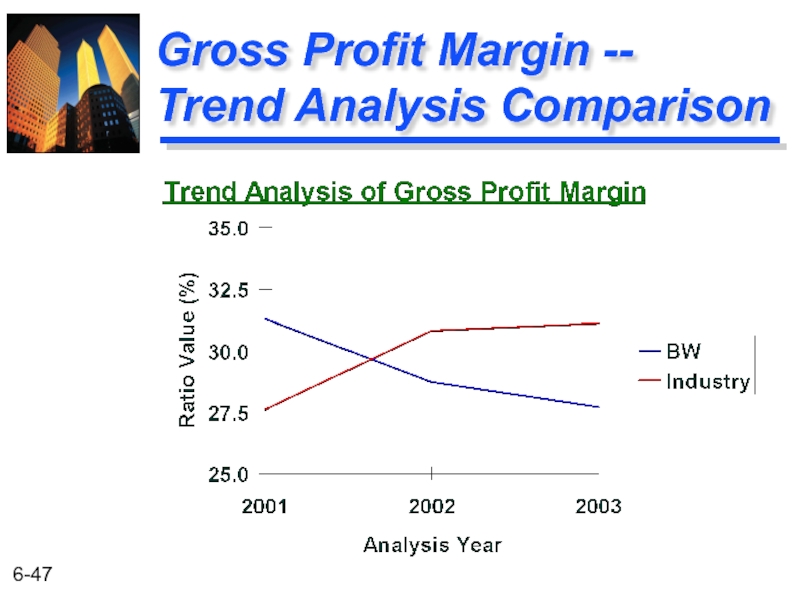
- 47. Gross Profit Margin -- Trend Analysis Comparison
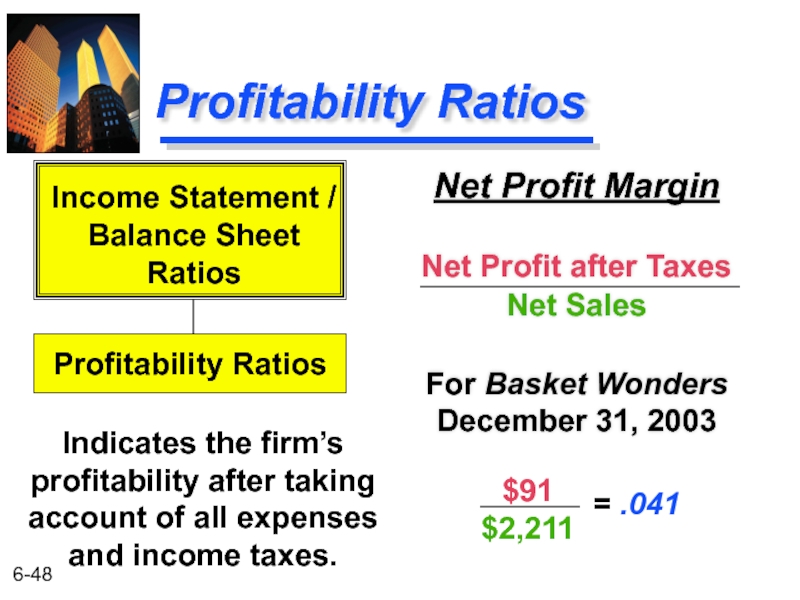
- 48. Profitability Ratios Net Profit Margin Net
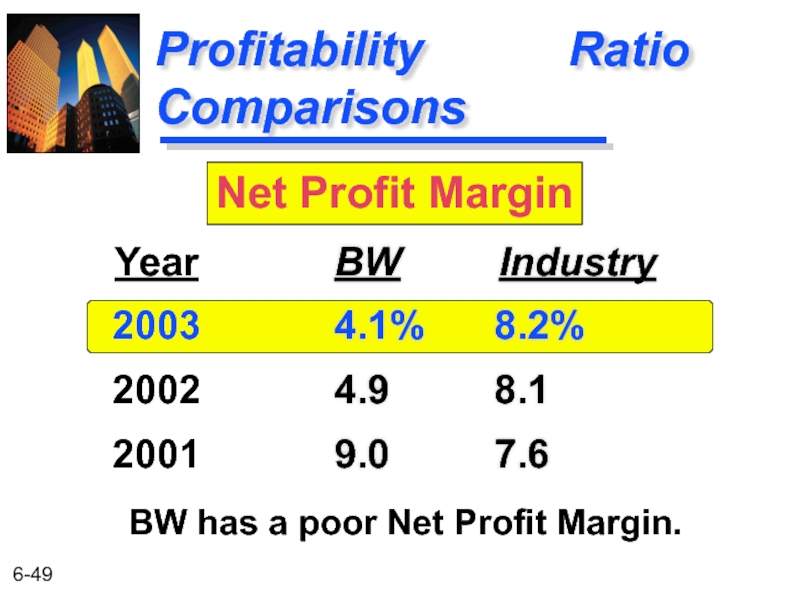
- 49. Profitability Ratio Comparisons BW Industry
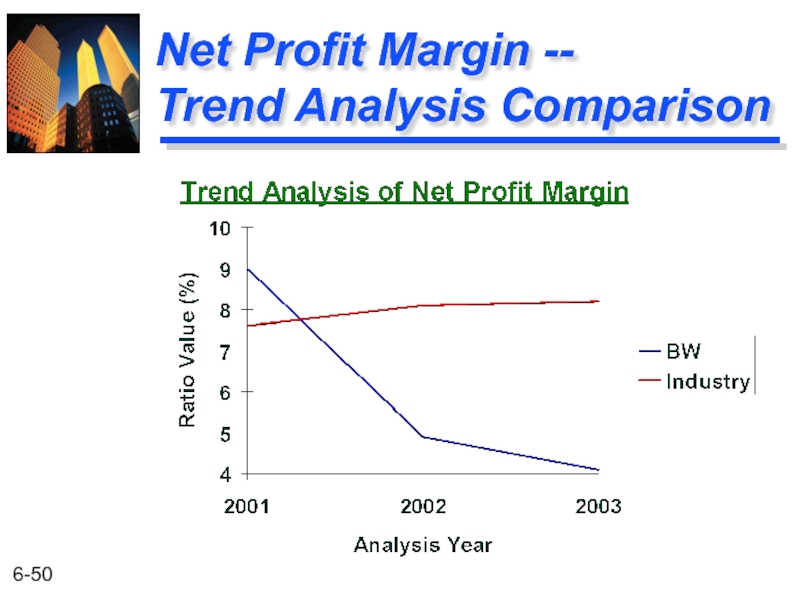
- 50. Net Profit Margin -- Trend Analysis Comparison
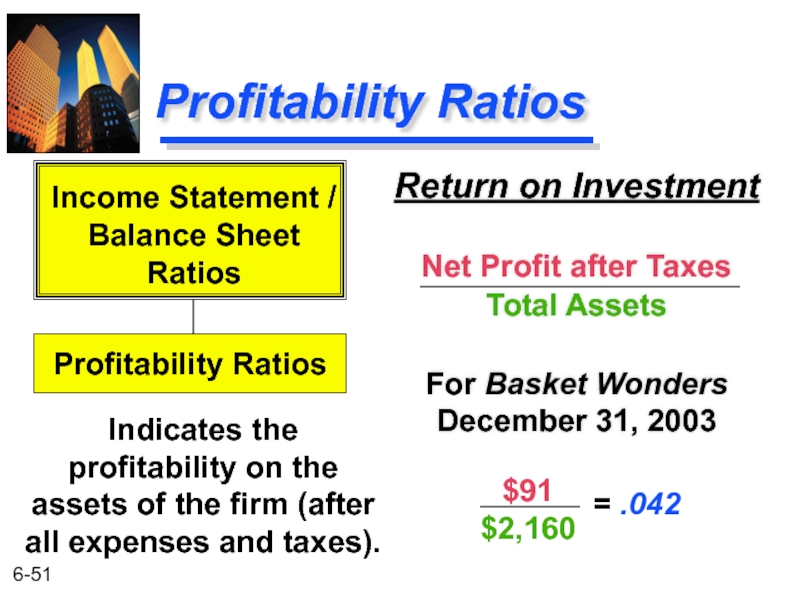
- 51. Profitability Ratios Return on Investment Net
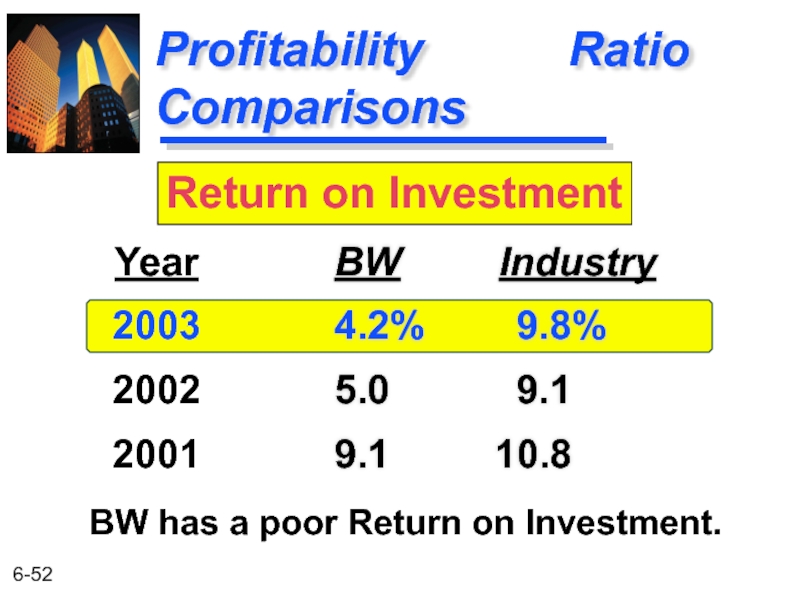
- 52. Profitability Ratio Comparisons BW Industry
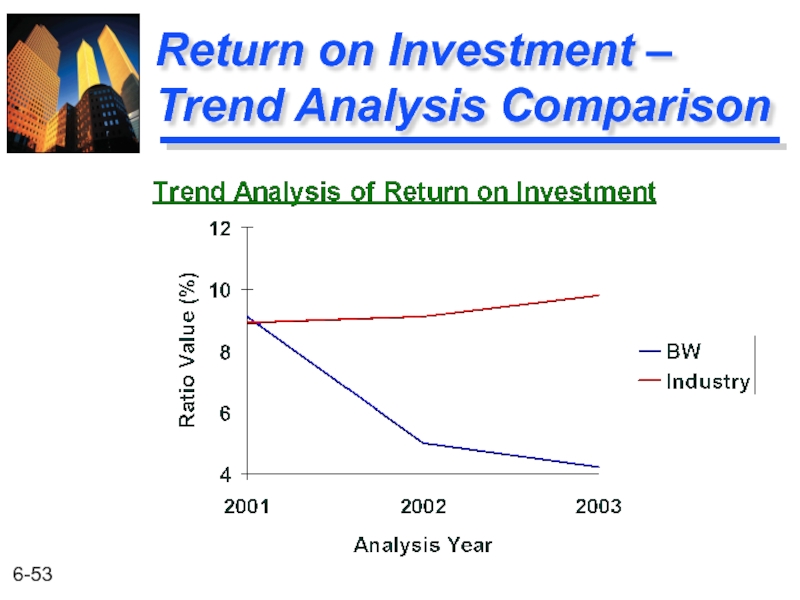
- 53. Return on Investment – Trend Analysis Comparison
- 54. Profitability Ratios Return on Equity Net
- 55. Profitability Ratio Comparisons BW
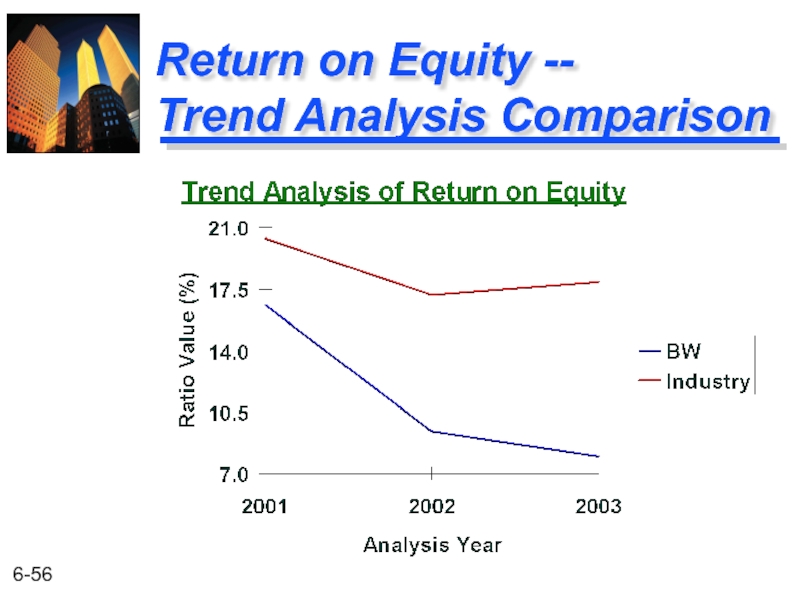
- 56. Return on Equity -- Trend Analysis Comparison
- 57. Return on Investment and the
- 58. Return on Equity and
- 59. Summary of the Profitability Trend Analyses The
- 60. Summary of Ratio Analyses Inventories are too
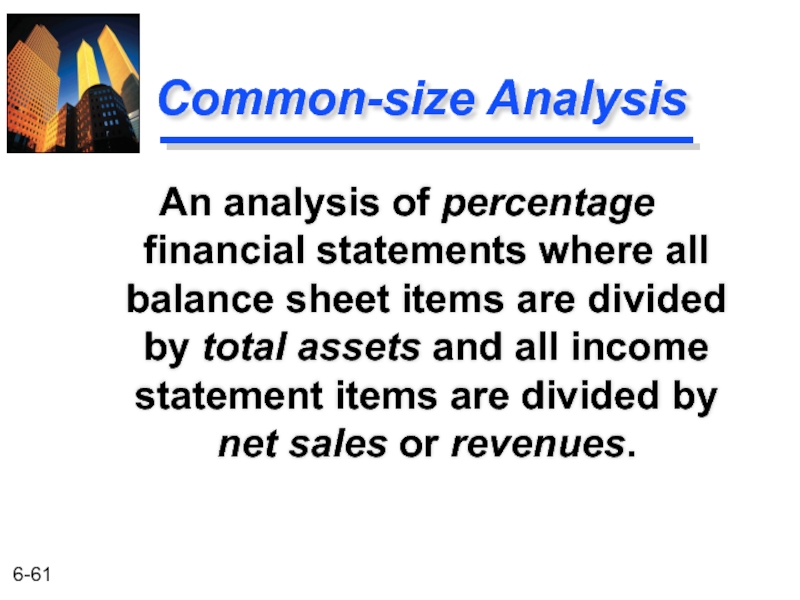
- 61. Common-size Analysis An analysis of percentage financial
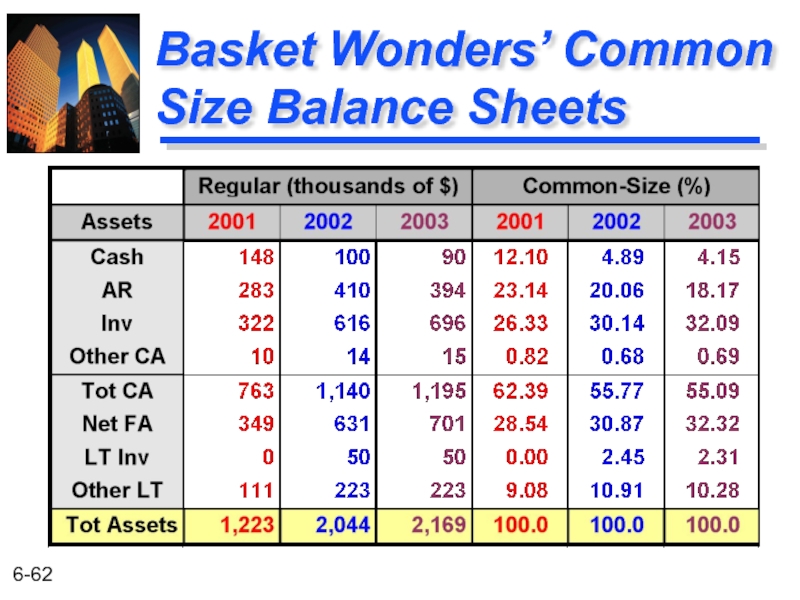
- 62. Basket Wonders’ Common Size Balance Sheets
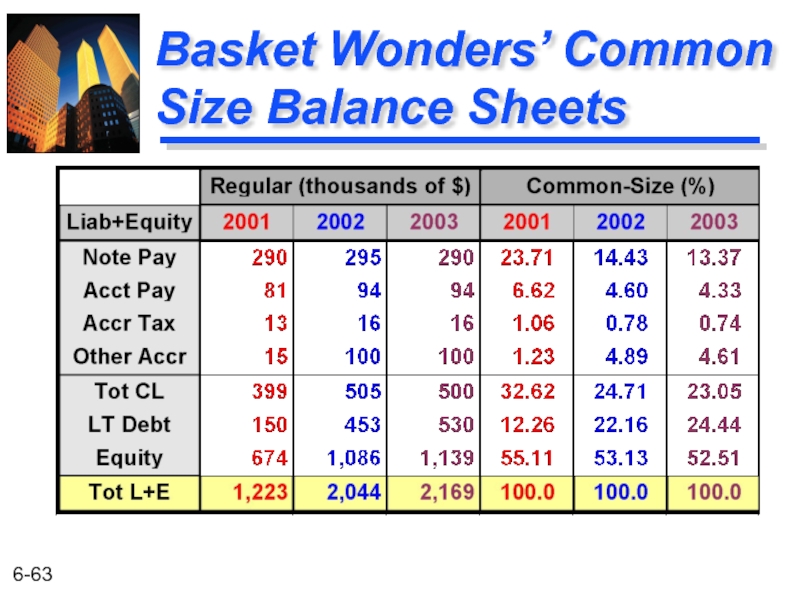
- 63. Basket Wonders’ Common Size Balance Sheets
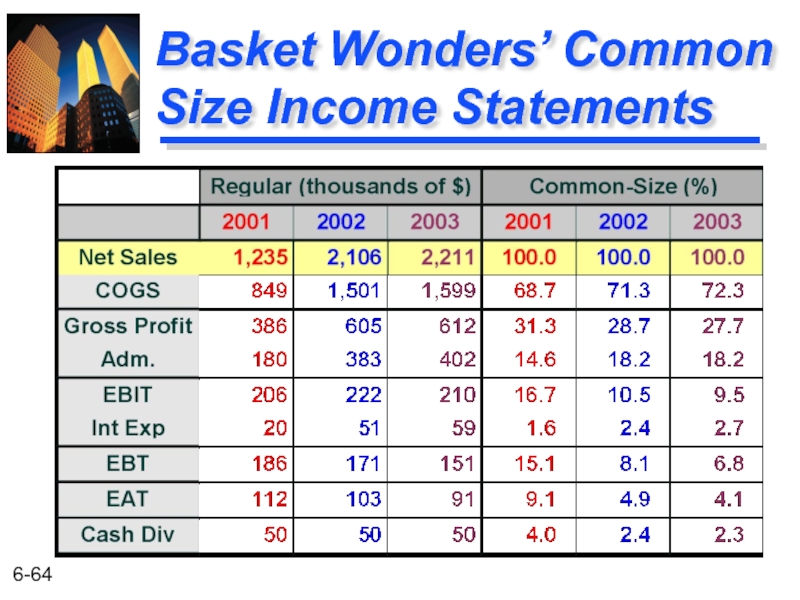
- 64. Basket Wonders’ Common Size Income Statements
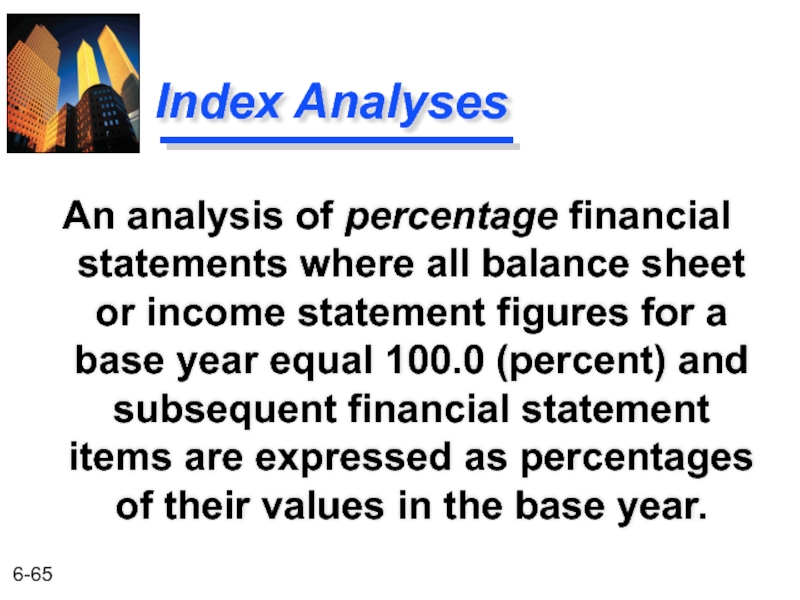
- 65. Index Analyses An analysis of percentage financial
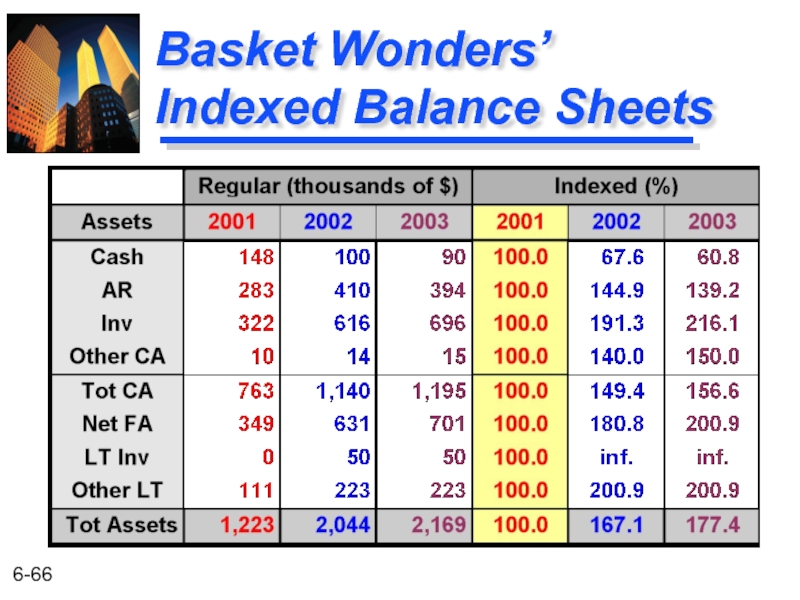
- 66. Basket Wonders’ Indexed Balance Sheets
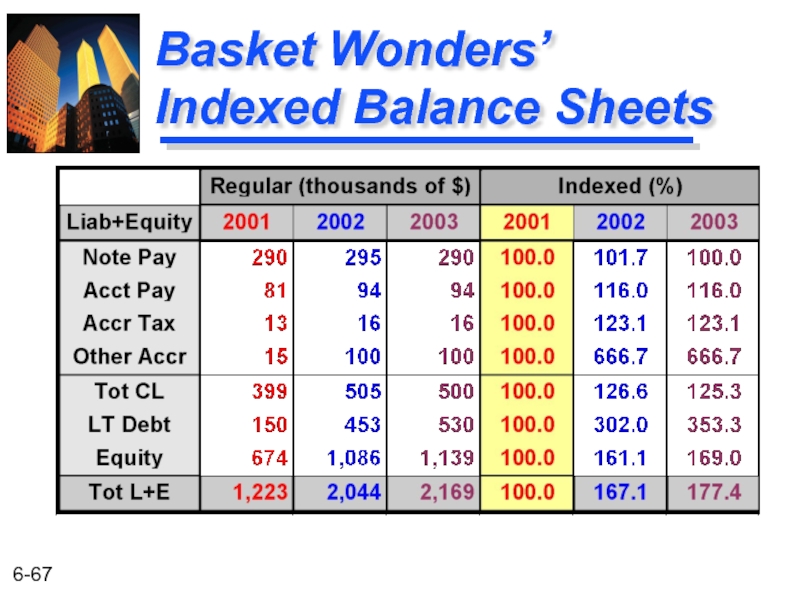
- 67. Basket Wonders’ Indexed Balance Sheets
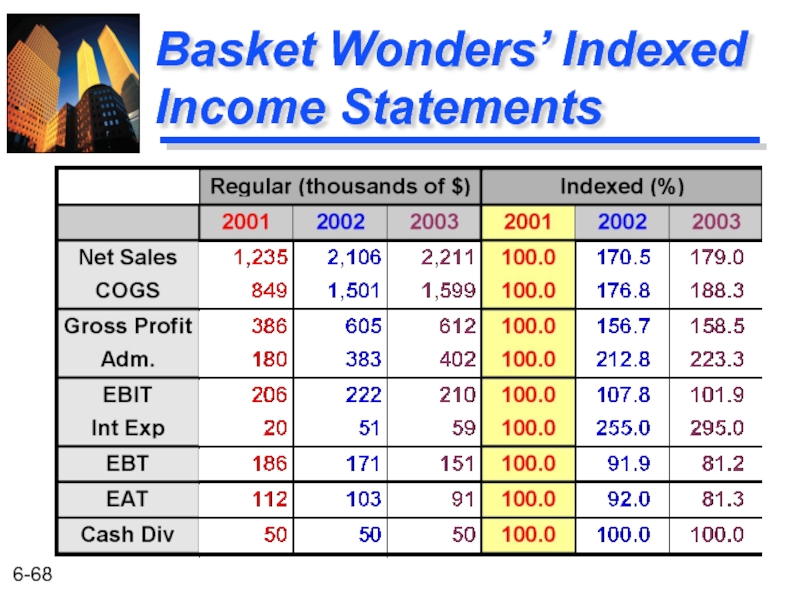
- 68. Basket Wonders’ Indexed Income Statements
Слайд 2Financial
Statement Analysis
Financial Statements
A Possible Framework for Analysis
Ratio Analysis
Trend Analysis
Common-Size and
Слайд 3Examples of External Uses of Statement Analysis
Trade Creditors -- Focus on
Bondholders -- Focus on the long-term cash flow of the firm.
Shareholders -- Focus on the profitability and long-term health of the firm.
Слайд 4Examples of Internal Uses of Statement Analysis
Plan -- Focus on assessing
Control -- Focus on return on investment for various assets and asset efficiency.
Understand -- Focus on understanding how suppliers of funds analyze the firm.
Слайд 5Primary Types of Financial Statements
Income Statement
A summary of a firm’s revenues
Balance Sheet
A summary of a firm’s financial position on a given date that shows total assets = total liabilities + owners’ equity.
Слайд 6Basket Wonders’ Balance Sheet (Asset Side)
a. How the firm stands on
b. What BW owned.
c. Amounts owed by customers.
d. Future expense items already paid.
e. Cash/likely convertible to cash within 1 year.
f. Original amount paid.
g. Acc. deductions for wear and tear.
Cash and C.E. $ 90 Acct. Rec.c 394 Inventories 696 Prepaid Exp d 5 Accum Tax Prepay 10 Current Assetse $1,195 Fixed Assets (@Cost)f 1030 Less: Acc. Depr. g (329) Net Fix. Assets $ 701 Investment, LT 50 Other Assets, LT 223 Total Assets b $2,169
Basket Wonders Balance Sheet (thousands) Dec. 31, 2003a
Слайд 7Basket Wonders’ Balance Sheet (Liability Side)
a. Note, Assets = Liabilities +
b. What BW owed and ownership position.
c. Owed to suppliers for goods and services.
d. Unpaid wages, salaries, etc.
e. Debts payable < 1 year.
f. Debts payable > 1 year.
g. Original investment.
h. Earnings reinvested.
Notes Payable $ 290 Acct. Payablec 94 Accrued Taxes d 16 Other Accrued Liab. d 100 Current Liab. e $ 500 Long-Term Debt f 530 Shareholders’ Equity Com. Stock ($1 par) g 200 Add Pd in Capital g 729 Retained Earnings h 210 Total Equity $1,139
Total Liab/Equitya,b $2,169
Basket Wonders Balance Sheet (thousands) Dec. 31, 2003
Слайд 8Basket Wonders’ Income Statement
a. Measures profitability over a time period.
b. Received,
c. Sales comm., adv., officers’ salaries, etc.
d. Operating income.
e. Cost of borrowed funds.
f. Taxable income.
g. Amount earned for shareholders.
Net Sales $ 2,211 Cost of Goods Sold b 1,599 Gross Profit $ 612 SG&A Expenses c 402 EBITd $ 210 Interest Expensee 59 EBT f $ 151 Income Taxes 60 EATg $ 91 Cash Dividends 38 Increase in RE $ 53
Basket Wonders Statement of Earnings (in thousands) for Year Ending December 31, 2003a
Слайд 9Framework for Financial Analysis
Analytical Tools Used
Sources and Uses Statement
Statement of Cash
Cash Budgets
1. Analysis of the funds
needs of the firm.
Trend / Seasonal Component
How much funding will be required in the future?
Is there a seasonal component?
Слайд 10Framework for Financial Analysis
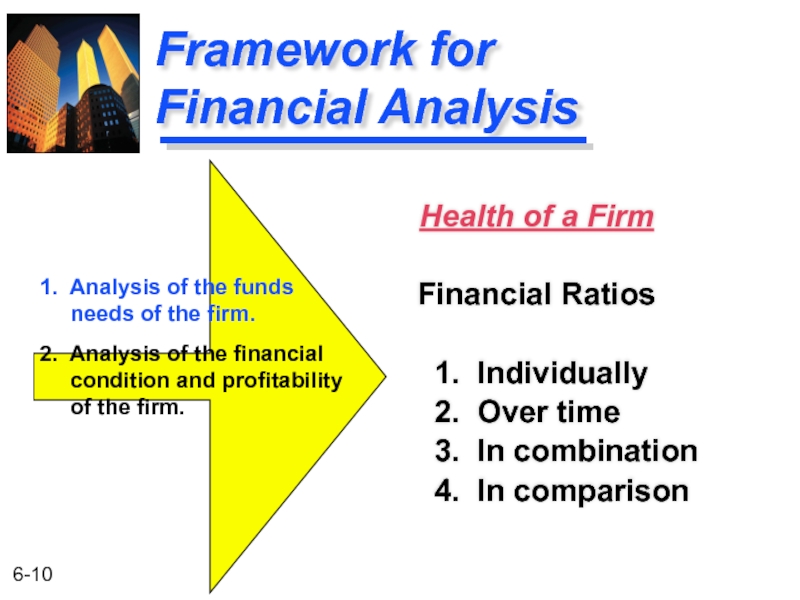
Health of a Firm
Financial Ratios
1. Individually
2. Over time
3.
4. In comparison
1. Analysis of the funds
needs of the firm.
2. Analysis of the financial
condition and profitability
of the firm.
Слайд 11Framework for Financial Analysis
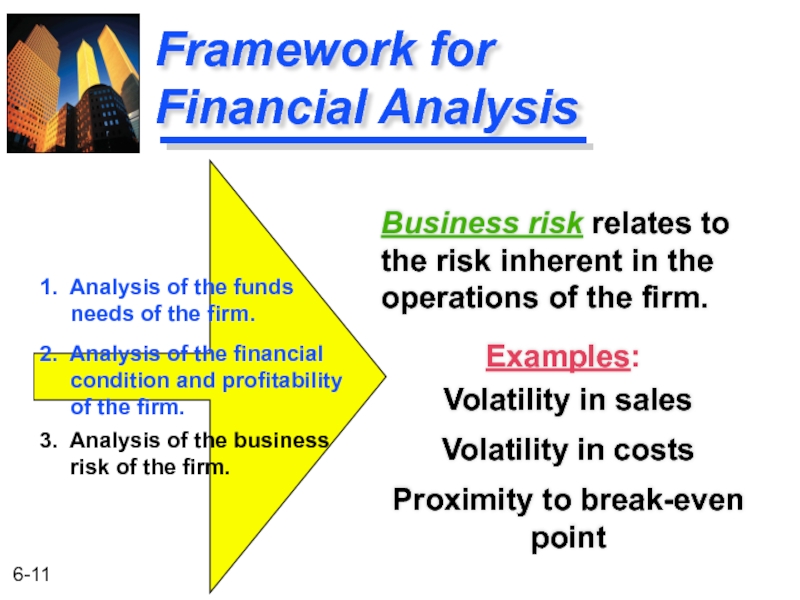
Examples:
Volatility in sales
Volatility in costs
Proximity to break-even point
1.
needs of the firm.
2. Analysis of the financial
condition and profitability
of the firm.
3. Analysis of the business
risk of the firm.
Business risk relates to the risk inherent in the operations of the firm.
Слайд 12Framework for Financial Analysis
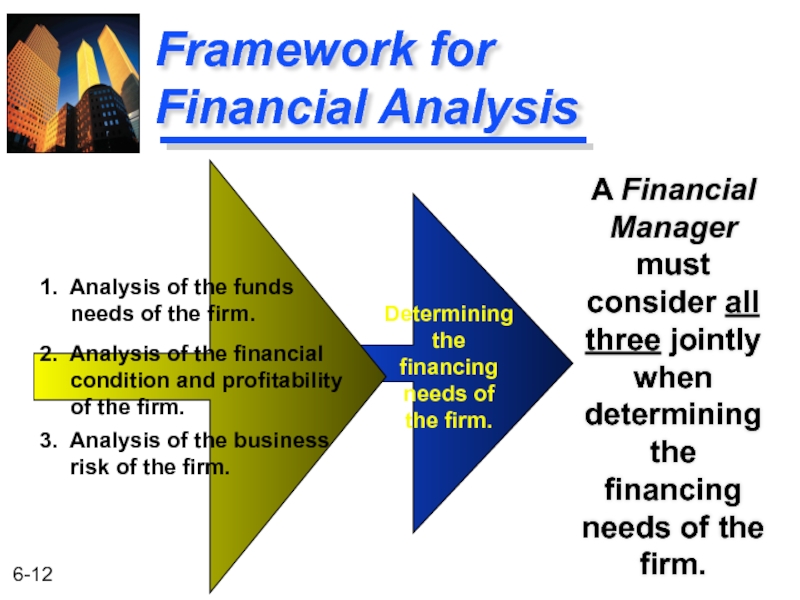
A Financial Manager must consider all three jointly
Determining
the
financing
needs of
the firm.
1. Analysis of the funds
needs of the firm.
2. Analysis of the financial
condition and profitability
of the firm.
3. Analysis of the business
risk of the firm.
Слайд 13
Framework for Financial Analysis
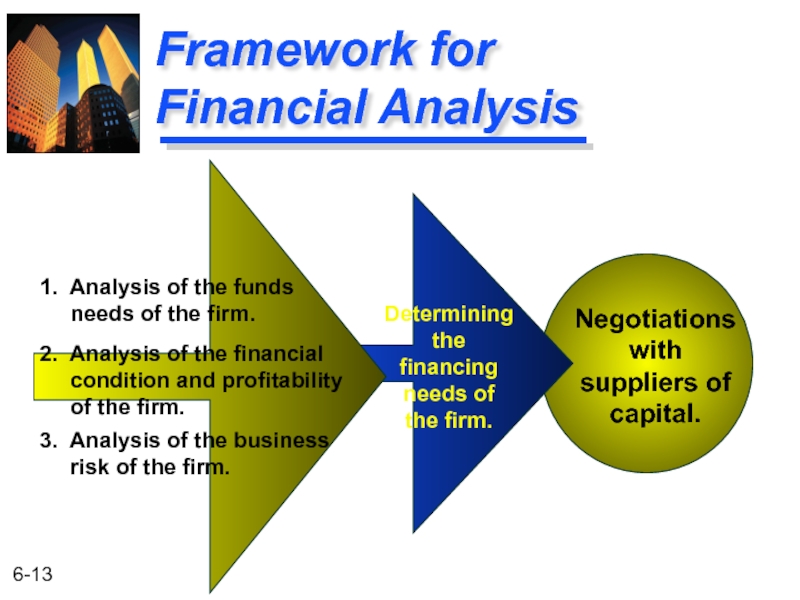
Negotiations
with
suppliers of
capital.
Determining
the
financing
needs of
the firm.
1. Analysis of
needs of the firm.
2. Analysis of the financial
condition and profitability
of the firm.
3. Analysis of the business
risk of the firm.
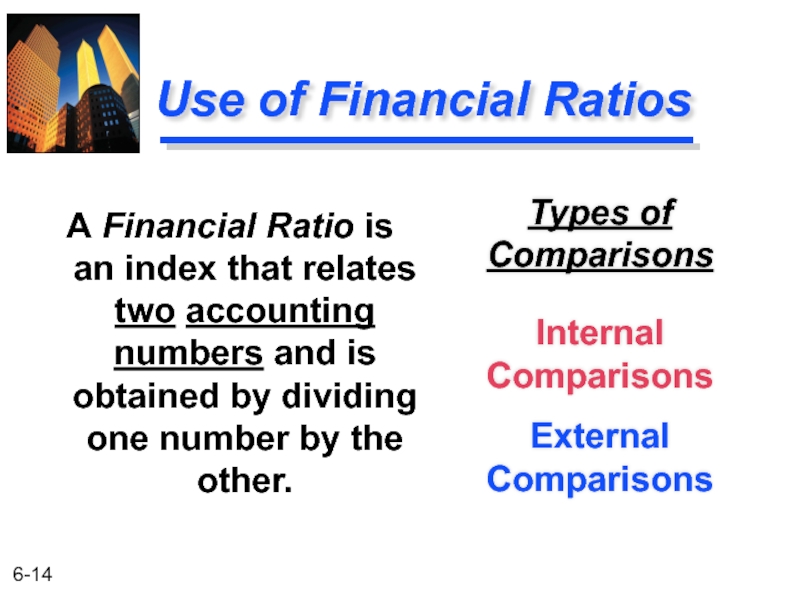
Слайд 14Use of Financial Ratios
Types of Comparisons
Internal Comparisons
External Comparisons
A Financial Ratio is
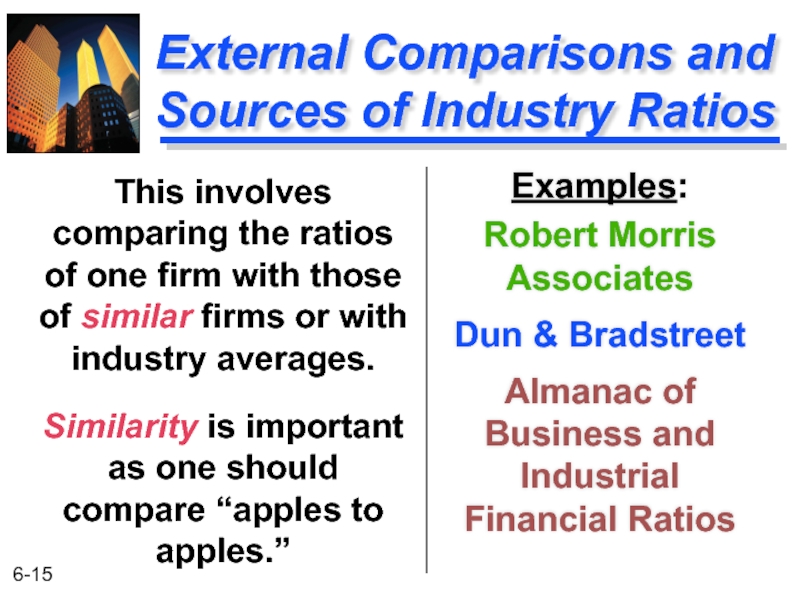
Слайд 15External Comparisons and Sources of Industry Ratios
Examples:
Robert Morris Associates
Dun & Bradstreet
Almanac
This involves comparing the ratios of one firm with those of similar firms or with industry averages.
Similarity is important as one should compare “apples to apples.”
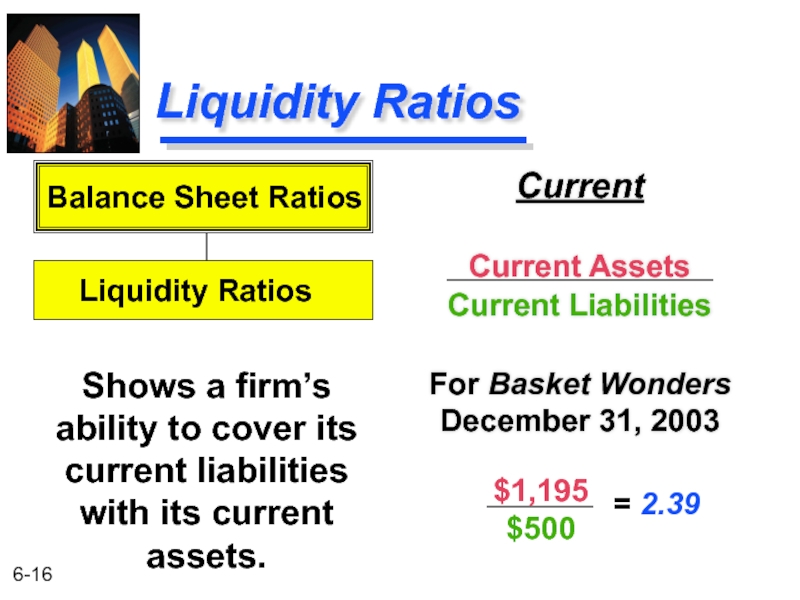
Слайд 16Liquidity Ratios
Current
Current Assets
Current Liabilities
For Basket Wonders December 31, 2003
Shows a firm’s
Balance Sheet Ratios
Liquidity Ratios
$1,195
$500
= 2.39
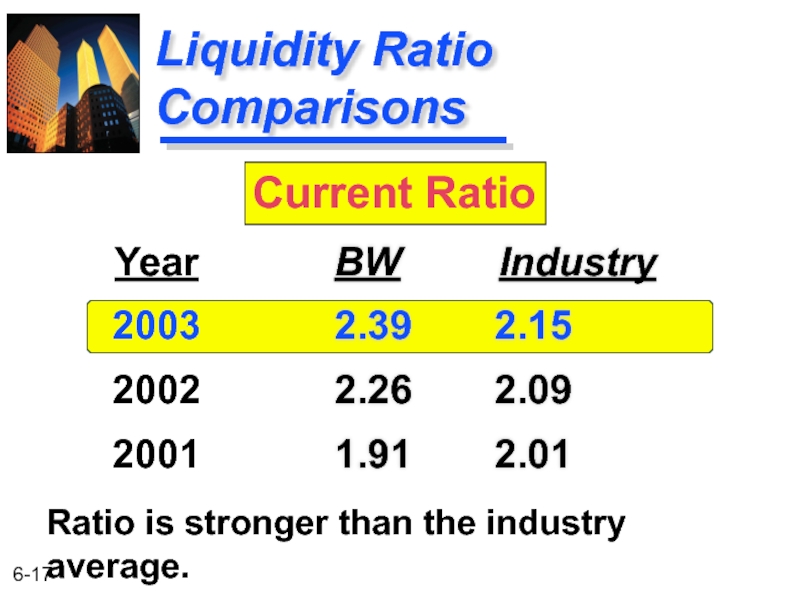
Слайд 17
Liquidity Ratio Comparisons
BW Industry
2.39 2.15
2.26 2.09
1.91 2.01
Year
2003
2002
2001
Current Ratio
Ratio is stronger than the industry
Слайд 18Liquidity Ratios
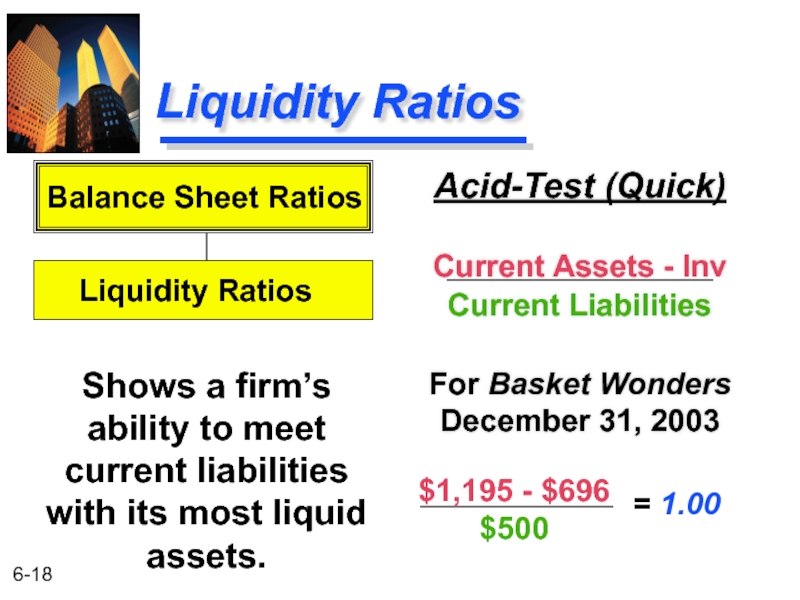
Acid-Test (Quick)
Current Assets - Inv
Current Liabilities
For Basket Wonders December 31,
Shows a firm’s ability to meet current liabilities with its most liquid assets.
Balance Sheet Ratios
Liquidity Ratios
$1,195 - $696
$500
= 1.00
Слайд 19
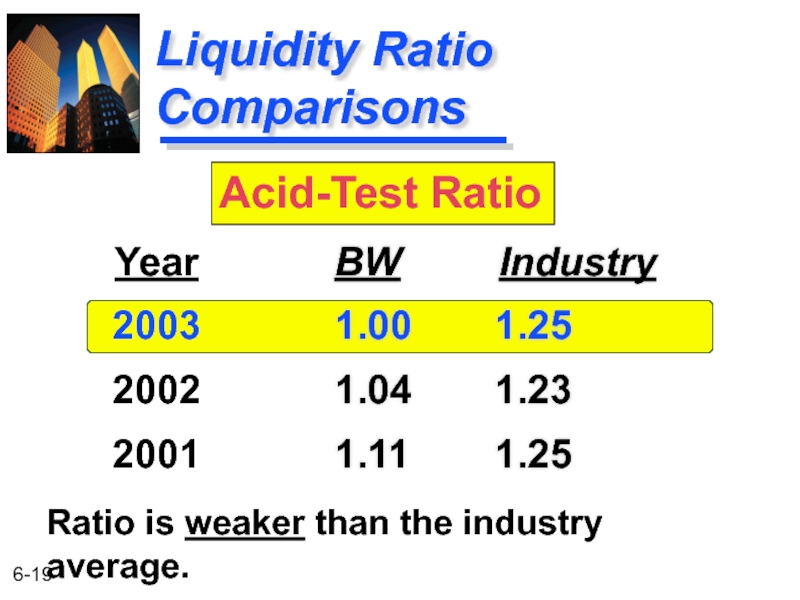
Liquidity Ratio Comparisons
BW Industry
1.00 1.25
1.04 1.23
1.11 1.25
Year
2003
2002
2001
Acid-Test Ratio
Ratio is weaker than the industry
Слайд 20Summary of the Liquidity Ratio Comparisons
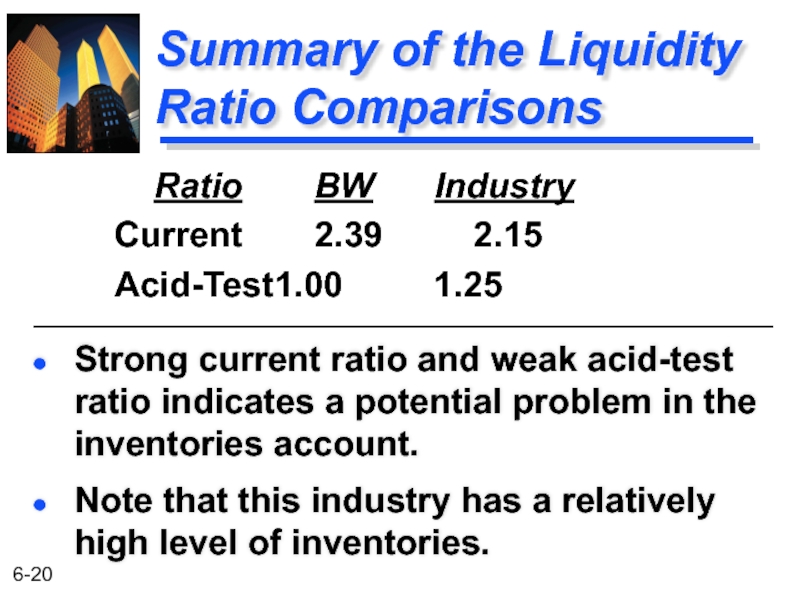
Strong current ratio and weak acid-test
Note that this industry has a relatively high level of inventories.
Ratio BW Industry
Current 2.39 2.15
Acid-Test 1.00 1.25
Слайд 23Summary of the Liquidity Trend Analyses
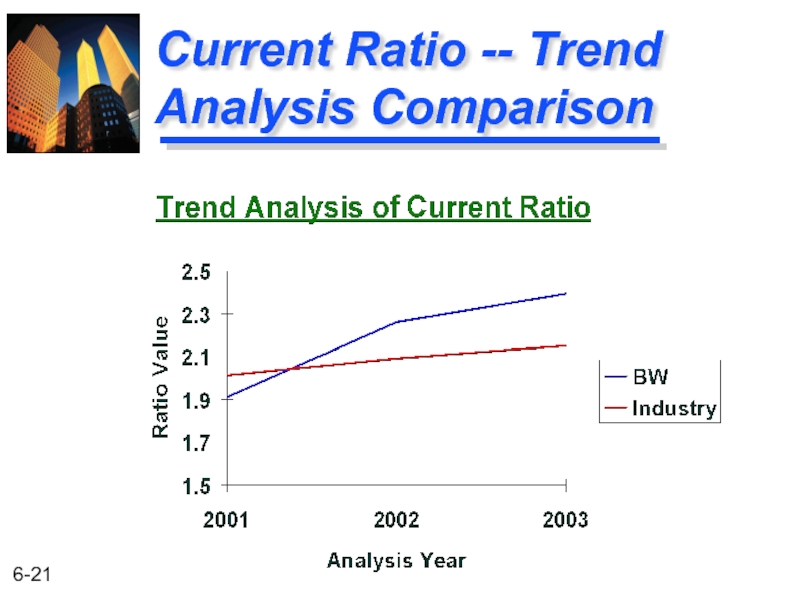
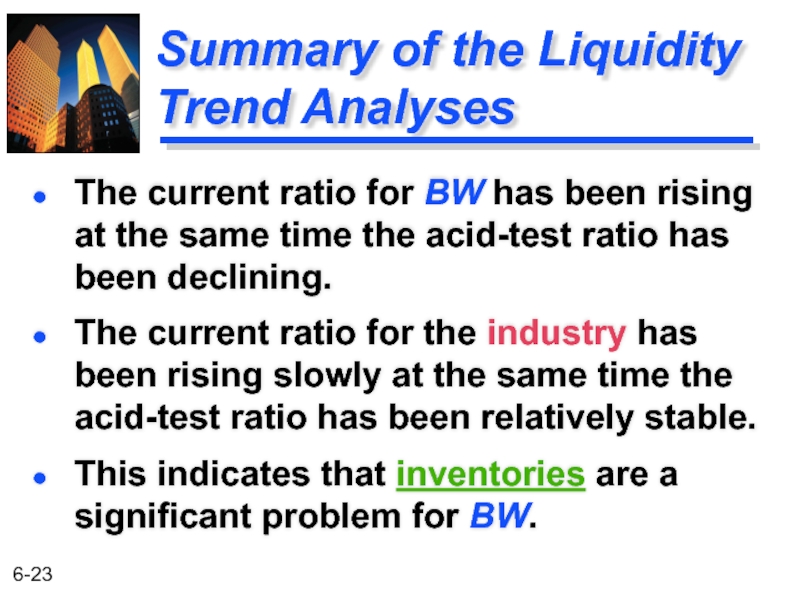
The current ratio for the industry
This indicates that inventories are a significant problem for BW.
The current ratio for BW has been rising at the same time the acid-test ratio has been declining.
Слайд 24Financial Leverage Ratios
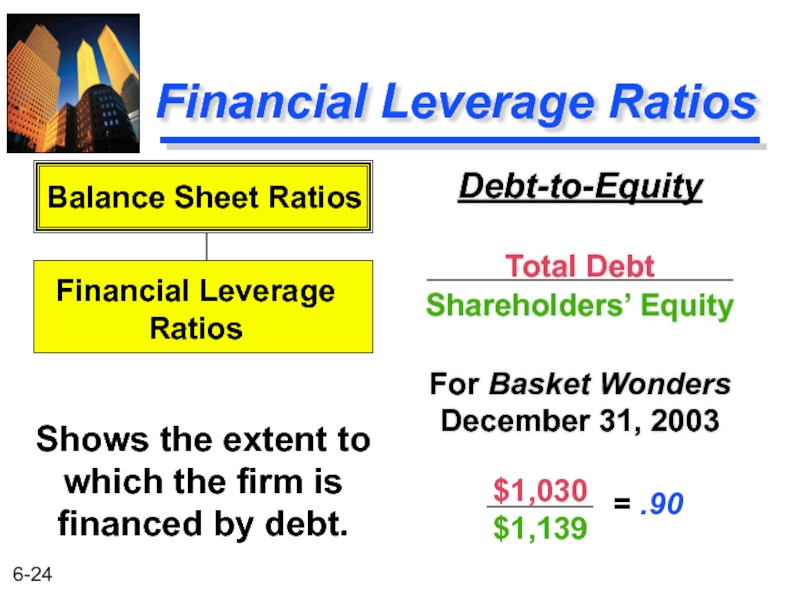
Debt-to-Equity
Total Debt
Shareholders’ Equity
For Basket Wonders December 31, 2003
Shows the
Balance Sheet Ratios
Financial Leverage
Ratios
$1,030
$1,139
= .90
Слайд 25
Financial Leverage
Ratio Comparisons
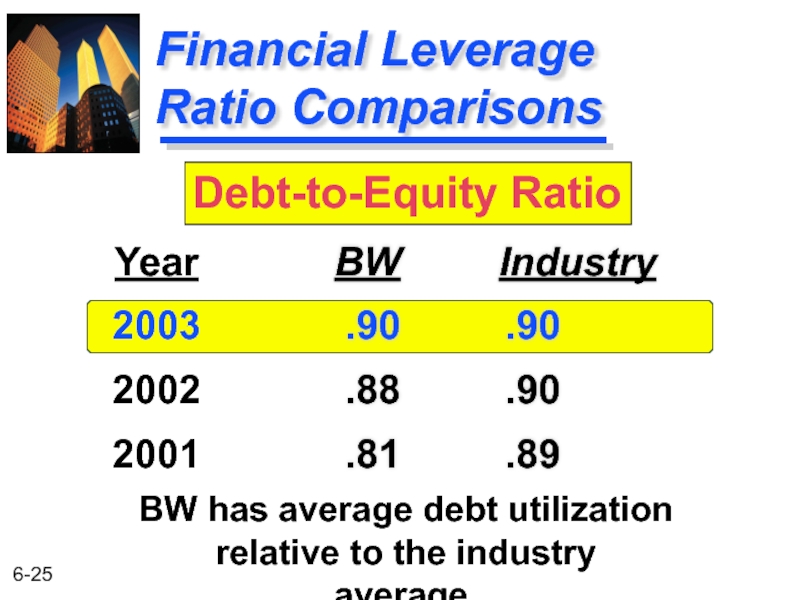
BW Industry
.90 .90
.88 .90
.81
Year
2003
2002
2001
Debt-to-Equity Ratio
BW has average debt utilization
relative to the industry average.
Слайд 26Financial Leverage Ratios
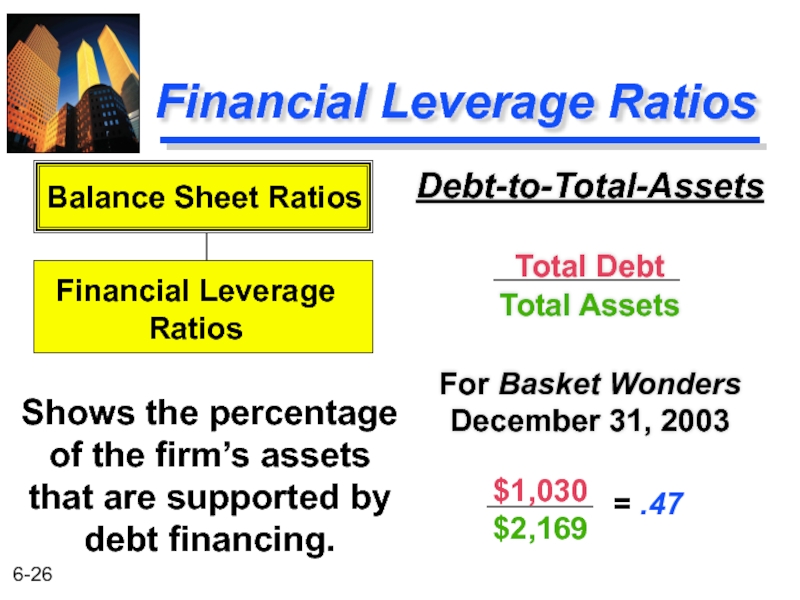
Debt-to-Total-Assets
Total Debt
Total Assets
For Basket Wonders December 31, 2003
Shows the
Balance Sheet Ratios
Financial Leverage
Ratios
$1,030
$2,169
= .47
Слайд 27
Financial Leverage
Ratio Comparisons
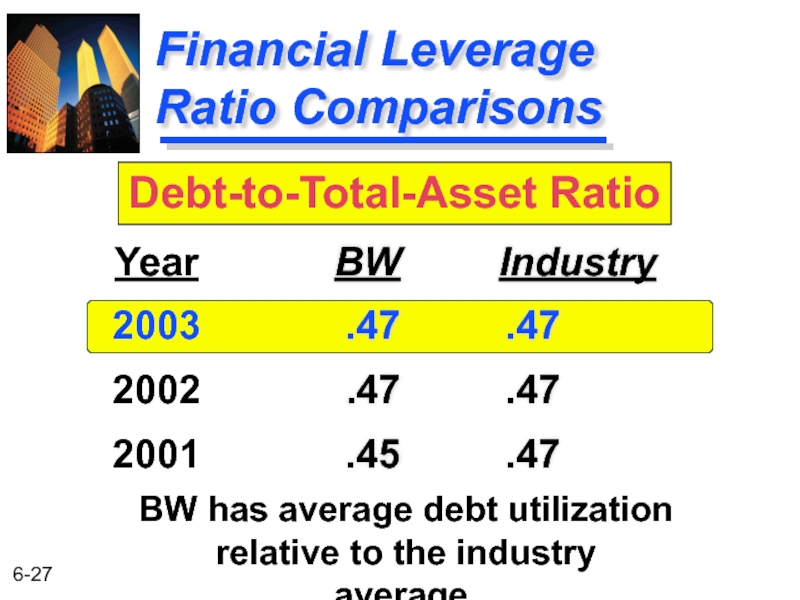
BW Industry
.47 .47
.47 .47
.45
Year
2003
2002
2001
Debt-to-Total-Asset Ratio
BW has average debt utilization
relative to the industry average.
Слайд 28Financial Leverage Ratios
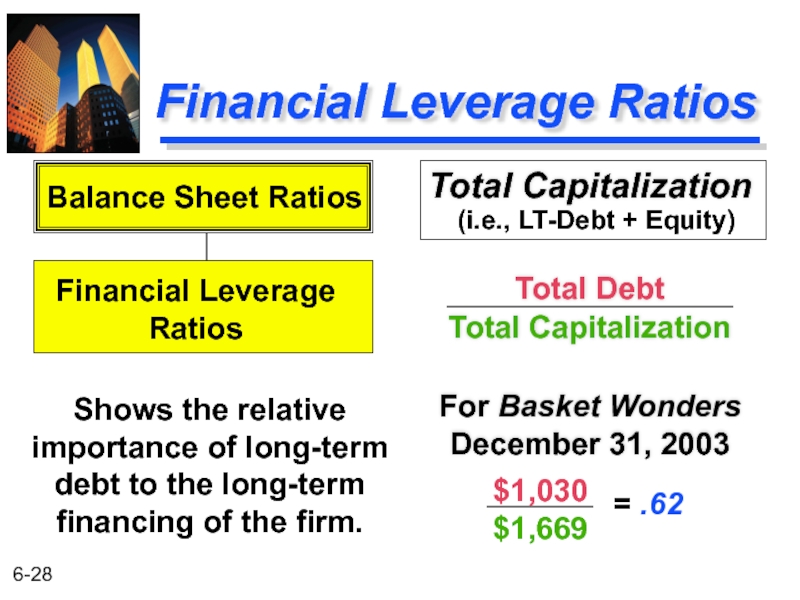
Total Capitalization
Total Debt
Total Capitalization
For Basket Wonders December 31, 2003
Shows
Balance Sheet Ratios
Financial Leverage
Ratios
$1,030
$1,669
= .62
(i.e., LT-Debt + Equity)
Слайд 29
Financial Leverage
Ratio Comparisons
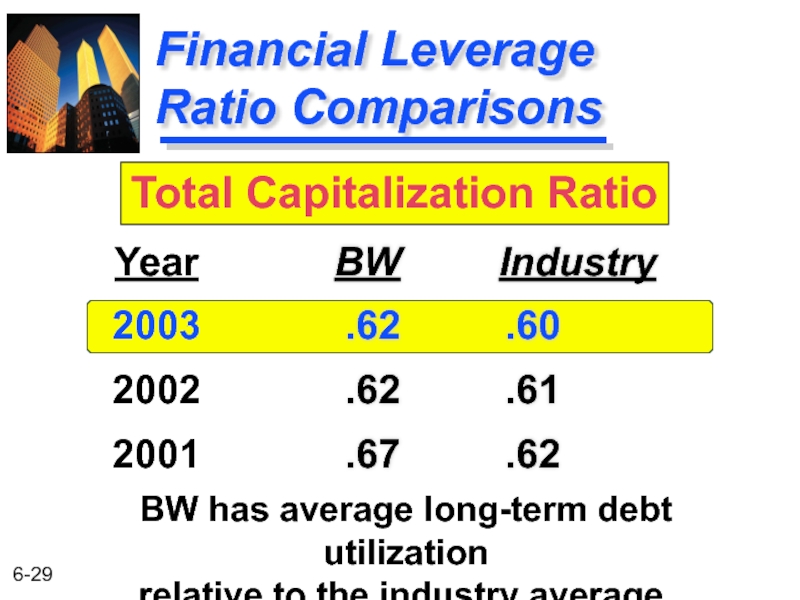
BW Industry
.62 .60
.62 .61
.67
Year
2003
2002
2001
Total Capitalization Ratio
BW has average long-term debt utilization
relative to the industry average.
Слайд 30Coverage Ratios
Interest Coverage
EBIT
Interest Charges
For Basket Wonders December 31, 2003
Indicates a firm’s
Income Statement
Ratios
Coverage Ratios
$210
$59
= 3.56
Слайд 31
Coverage
Ratio Comparisons
BW Industry
3.56 5.19
4.35 5.02
10.30 4.66
Year
2003
2002
2001
Interest Coverage Ratio
BW has
relative to the industry average.
Слайд 33Summary of the Coverage Trend Analysis
This indicates that low earnings (EBIT)
Note, we know that debt levels are in line with the industry averages.
The interest coverage ratio for BW has been falling since 2001. It has been below industry averages for the past two years.
Слайд 34Activity Ratios
Receivable Turnover
Annual Net Credit Sales
Receivables
For Basket Wonders December 31, 2003
Indicates
Income Statement /
Balance Sheet
Ratios
Activity Ratios
$2,211
$394
= 5.61
(Assume all sales are credit sales.)
Слайд 35Activity Ratios
Avg Collection Period
Days in the Year
Receivable Turnover
For Basket Wonders December
Average number of days that receivables are outstanding.
(or RT in days)
Income Statement /
Balance Sheet
Ratios
Activity Ratios
365
5.61
= 65 days
Слайд 36
Activity
Ratio Comparisons
BW Industry
65.0 65.7
71.1 66.3
83.6 69.2
Year
2003
2002
2001
Average Collection Period
BW has improved the average collection
Слайд 37Activity Ratios
Payable Turnover (PT)
Annual Credit Purchases
Accounts Payable
For Basket Wonders December 31,
Indicates the promptness of payment to suppliers by the firm.
Income Statement /
Balance Sheet
Ratios
Activity Ratios
$1551
$94
= 16.5
(Assume annual credit
purchases = $1,551.)
Слайд 38Activity Ratios
PT in Days
Days in the Year
Payable Turnover
For Basket Wonders December
Average number of days that payables are outstanding.
Income Statement /
Balance Sheet
Ratios
Activity Ratios
365
16.5
= 22.1 days
Слайд 39
Activity
Ratio Comparisons
BW Industry
22.1 46.7
25.4 51.1
43.5 48.5
Year
2003
2002
2001
Payable Turnover in Days
BW has improved the PT
Is this good?
Слайд 40Activity Ratios
Inventory Turnover
Cost of Goods Sold
Inventory
For Basket Wonders December 31, 2003
Indicates
Income Statement /
Balance Sheet
Ratios
Activity Ratios
$1,599
$696
= 2.30
Слайд 41
Activity
Ratio Comparisons
BW Industry
2.30 3.45
2.44 3.76
2.64 3.69
Year
2003
2002
2001
Inventory Turnover Ratio
BW has a very poor inventory
Слайд 43Activity Ratios
Total Asset Turnover
Net Sales
Total Assets
For Basket Wonders December 31, 2003
Indicates
Income Statement /
Balance Sheet
Ratios
Activity Ratios
$2,211
$2,169
= 1.02
Слайд 44
Activity
Ratio Comparisons
BW Industry
1.02 1.17
1.03 1.14
1.01 1.13
Year
2003
2002
2001
Total Asset Turnover Ratio
BW has a weak total
Why is this ratio considered weak?
Слайд 45Profitability Ratios
Gross Profit Margin
Gross Profit
Net Sales
For Basket Wonders December 31, 2003
Indicates
Income Statement /
Balance Sheet
Ratios
Profitability Ratios
$612
$2,211
= .277
Слайд 46
Profitability
Ratio Comparisons
BW Industry
27.7% 31.1%
28.7 30.8
31.3 27.6
Year
2003
2002
2001
Gross Profit Margin
BW has a weak Gross Profit
Слайд 48Profitability Ratios
Net Profit Margin
Net Profit after Taxes
Net Sales
For Basket Wonders December
Indicates the firm’s profitability after taking account of all expenses and income taxes.
Income Statement /
Balance Sheet
Ratios
Profitability Ratios
$91
$2,211
= .041
Слайд 49
Profitability Ratio Comparisons
BW Industry
4.1% 8.2%
4.9 8.1
9.0 7.6
Year
2003
2002
2001
Net Profit Margin
BW has a poor Net
Слайд 51Profitability Ratios
Return on Investment
Net Profit after Taxes
Total Assets
For Basket Wonders December
Indicates the profitability on the assets of the firm (after all expenses and taxes).
Income Statement /
Balance Sheet
Ratios
Profitability Ratios
$91
$2,160
= .042
Слайд 52
Profitability Ratio Comparisons
BW Industry
4.2% 9.8%
5.0 9.1
9.1 10.8
Year
2003
2002
2001
Return on Investment
BW has a
Слайд 54Profitability Ratios
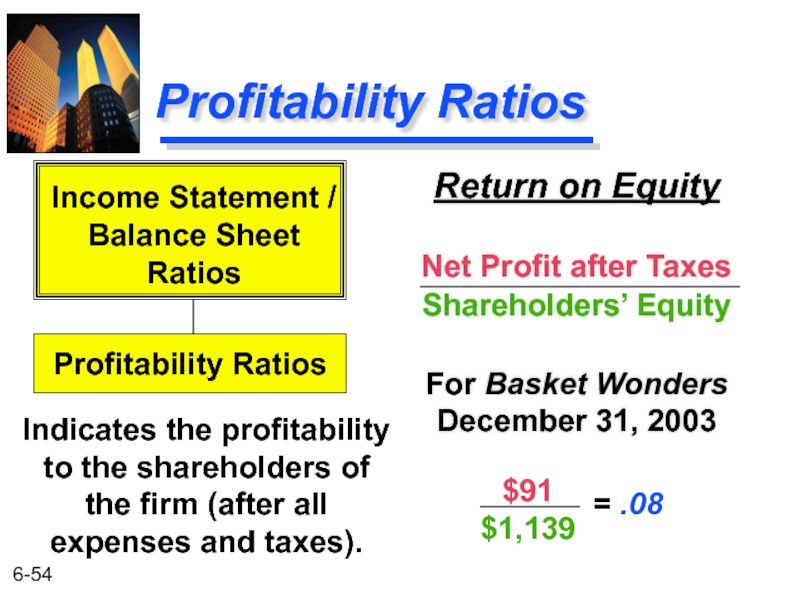
Return on Equity
Net Profit after Taxes
Shareholders’ Equity
For Basket Wonders December
Indicates the profitability to the shareholders of the firm (after all expenses and taxes).
Income Statement /
Balance Sheet
Ratios
Profitability Ratios
$91
$1,139
= .08
Слайд 55
Profitability Ratio Comparisons
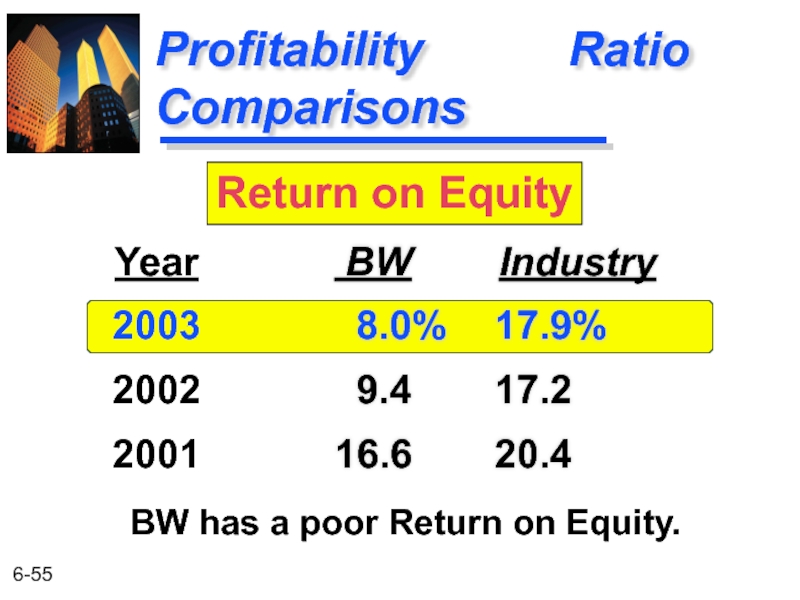
BW Industry
8.0% 17.9%
9.4 17.2
16.6 20.4
Year
2003
2002
2001
Return on Equity
BW
Слайд 57
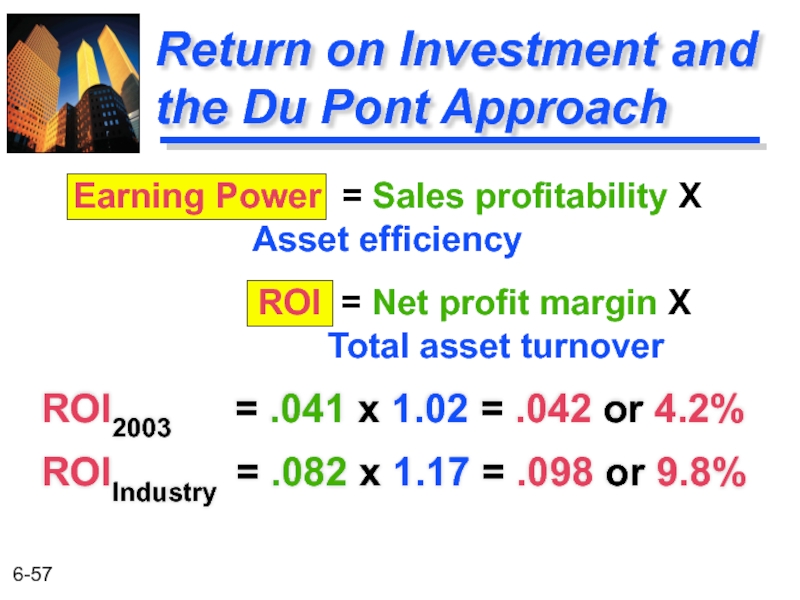
Return on Investment and the Du Pont Approach
ROI2003 =
ROIIndustry = .082 x 1.17 = .098 or 9.8%
ROI = Net profit margin X
Total asset turnover
Earning Power = Sales profitability X
Asset efficiency
Слайд 58
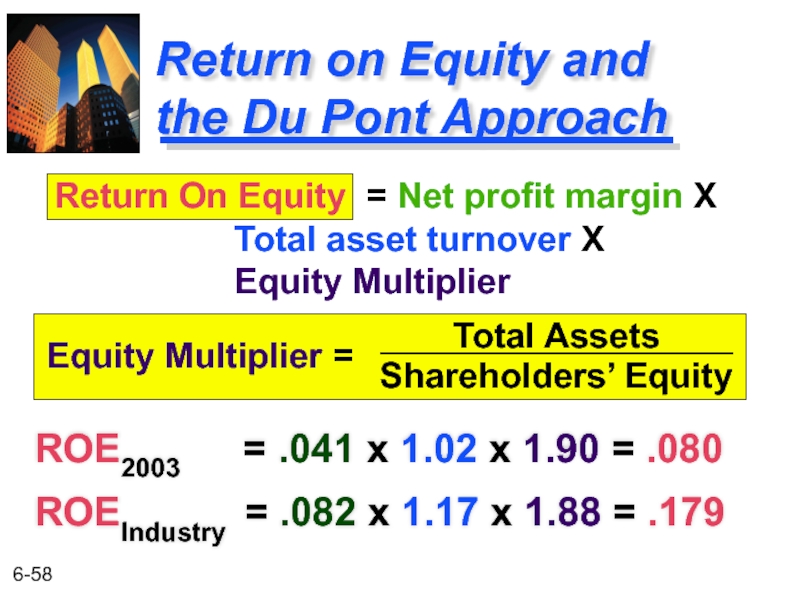
Return on Equity and
the Du Pont Approach
ROE2003 =
ROEIndustry = .082 x 1.17 x 1.88 = .179
Return On Equity = Net profit margin X
Total asset turnover X
Equity Multiplier
Equity Multiplier =
Total Assets
Shareholders’ Equity
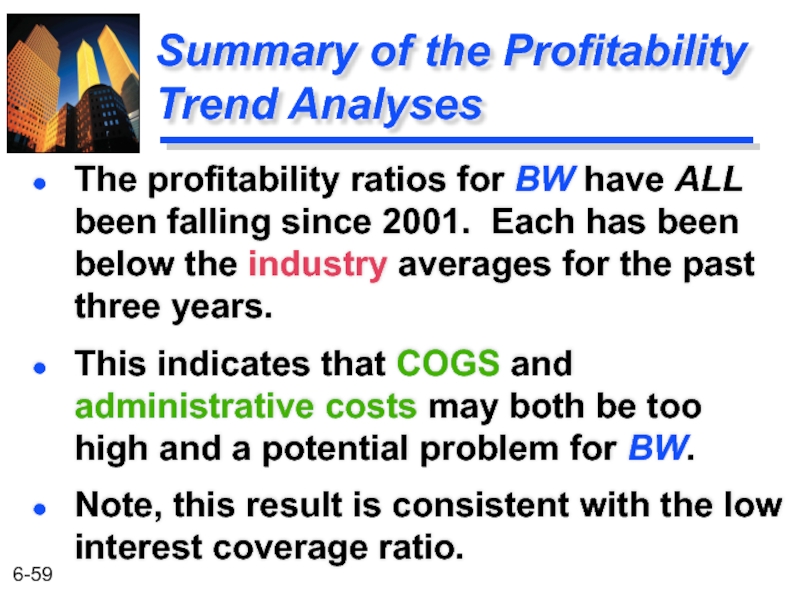
Слайд 59Summary of the Profitability Trend Analyses
The profitability ratios for BW have
This indicates that COGS and administrative costs may both be too high and a potential problem for BW.
Note, this result is consistent with the low interest coverage ratio.
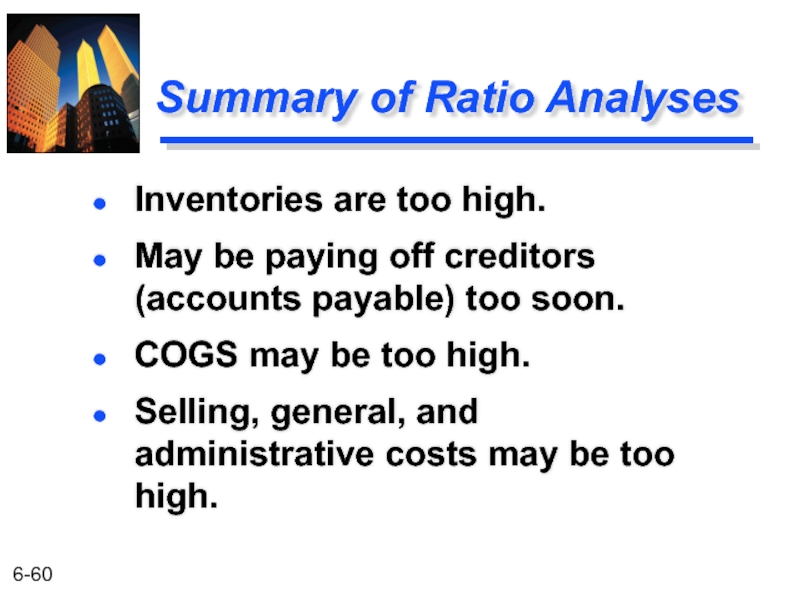
Слайд 60Summary of Ratio Analyses
Inventories are too high.
May be paying off creditors
COGS may be too high.
Selling, general, and administrative costs may be too high.

