- Главная
- Разное
- Дизайн
- Бизнес и предпринимательство
- Аналитика
- Образование
- Развлечения
- Красота и здоровье
- Финансы
- Государство
- Путешествия
- Спорт
- Недвижимость
- Армия
- Графика
- Культурология
- Еда и кулинария
- Лингвистика
- Английский язык
- Астрономия
- Алгебра
- Биология
- География
- Детские презентации
- Информатика
- История
- Литература
- Маркетинг
- Математика
- Медицина
- Менеджмент
- Музыка
- МХК
- Немецкий язык
- ОБЖ
- Обществознание
- Окружающий мир
- Педагогика
- Русский язык
- Технология
- Физика
- Философия
- Химия
- Шаблоны, картинки для презентаций
- Экология
- Экономика
- Юриспруденция
Financial Statement. Analysis презентация
Содержание
- 1. Financial Statement. Analysis
- 2. Profitability Margins and return ratios provide information
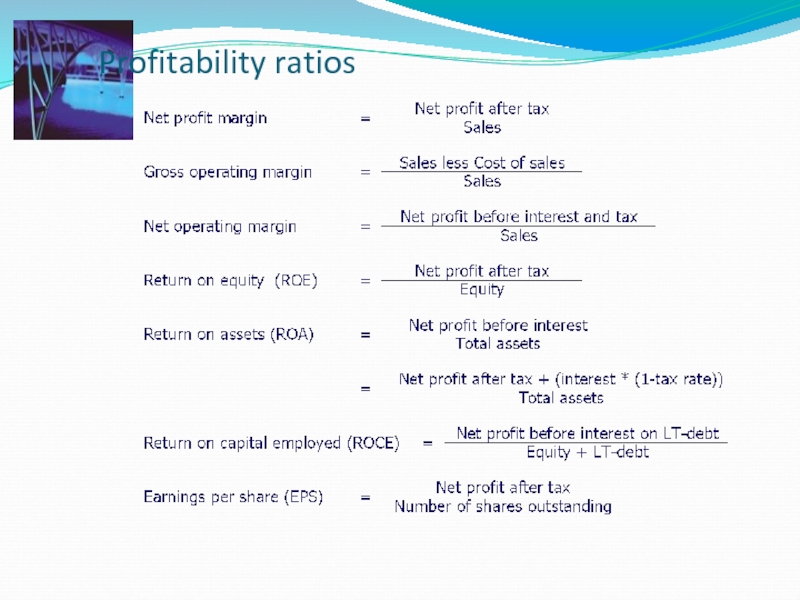
- 3. Profitability ratios
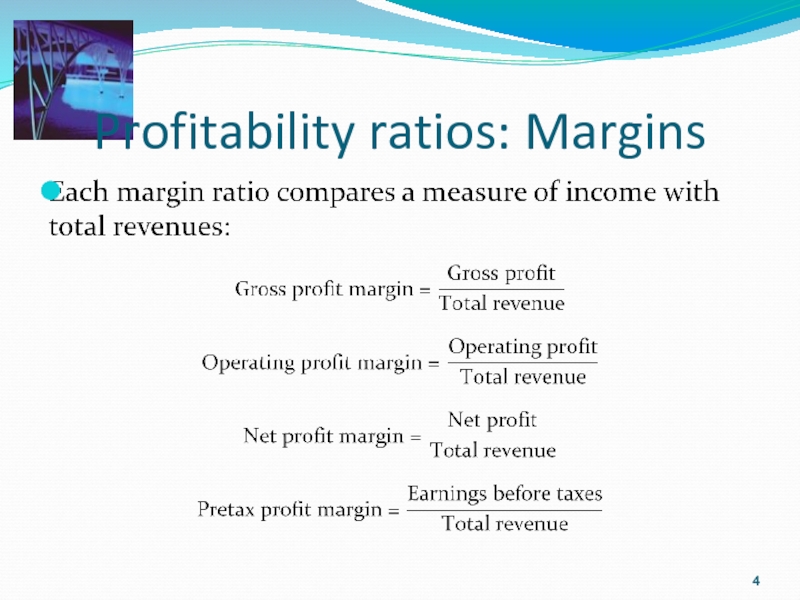
- 4. Profitability ratios: Margins
- 5. Earnings, (or net income,) are simply
- 6. Retained earnings
- 7. Measuring
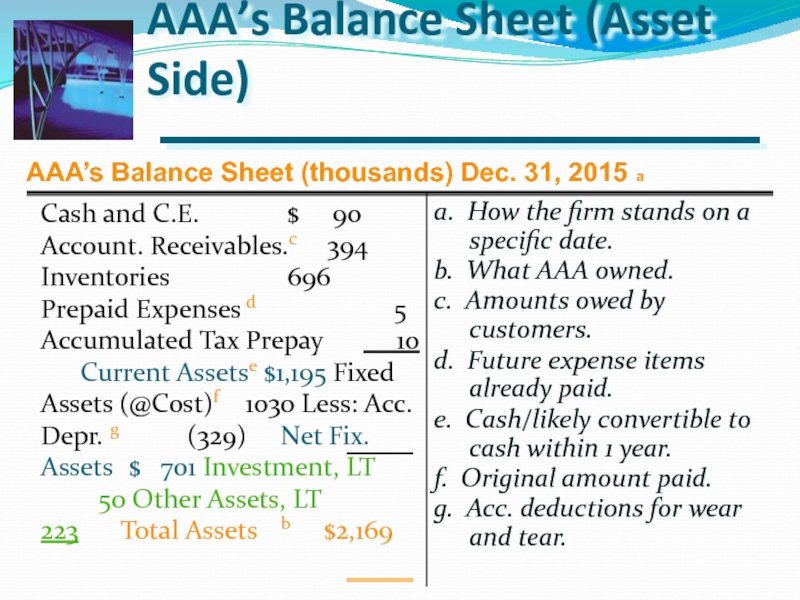
- 9. AAA’s Balance Sheet (Asset Side) a. How
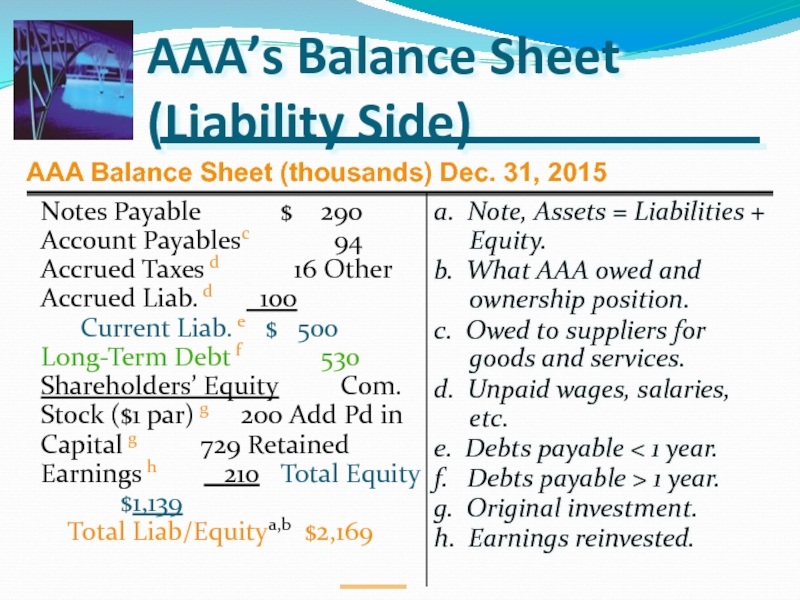
- 10. AAA’s Balance Sheet (Liability Side) a. Note,
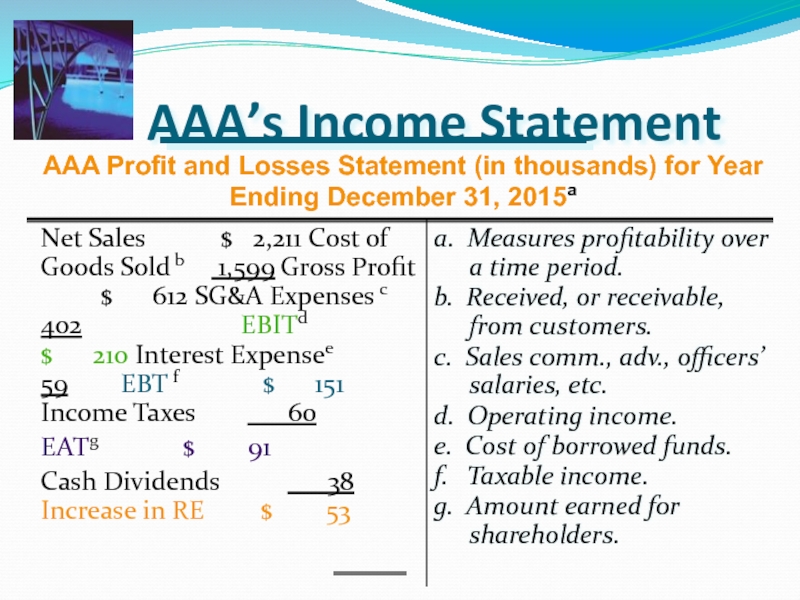
- 11. AAA’s Income Statement a. Measures profitability over
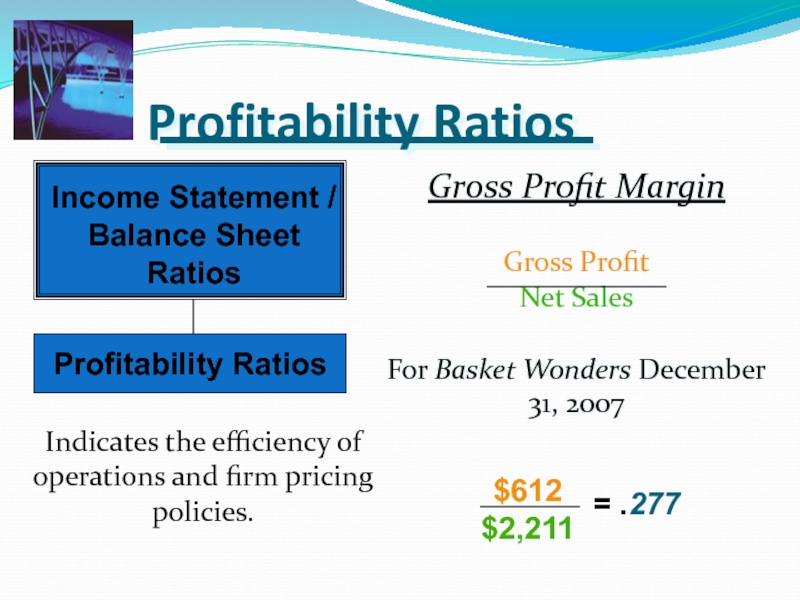
- 12. Profitability Ratios Gross Profit Margin Gross
- 13. Profitability Ratio Comparisons BW Industry
- 14. Gross Profit Margin -- Trend Analysis Comparison
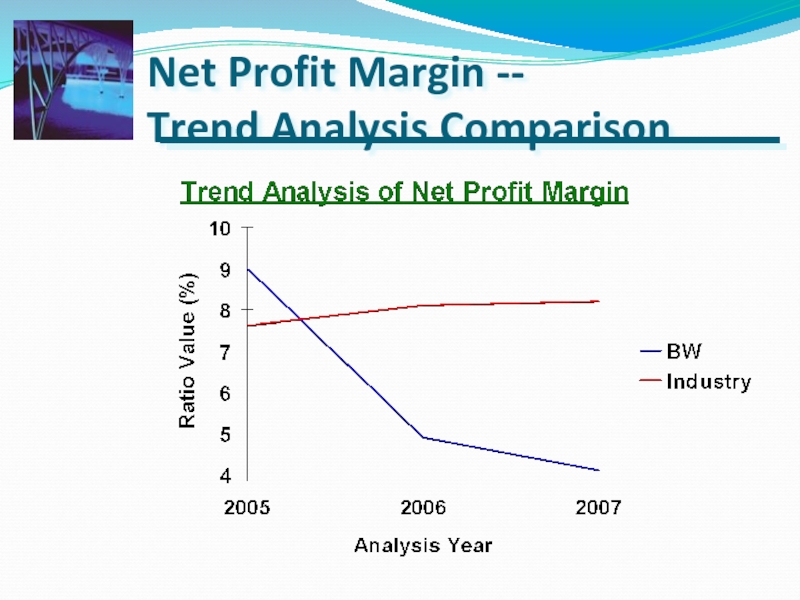
- 15. Profitability Ratios Net Profit Margin Net
- 16. Profitability Ratio Comparisons BW Industry
- 17. Net Profit Margin -- Trend Analysis Comparison
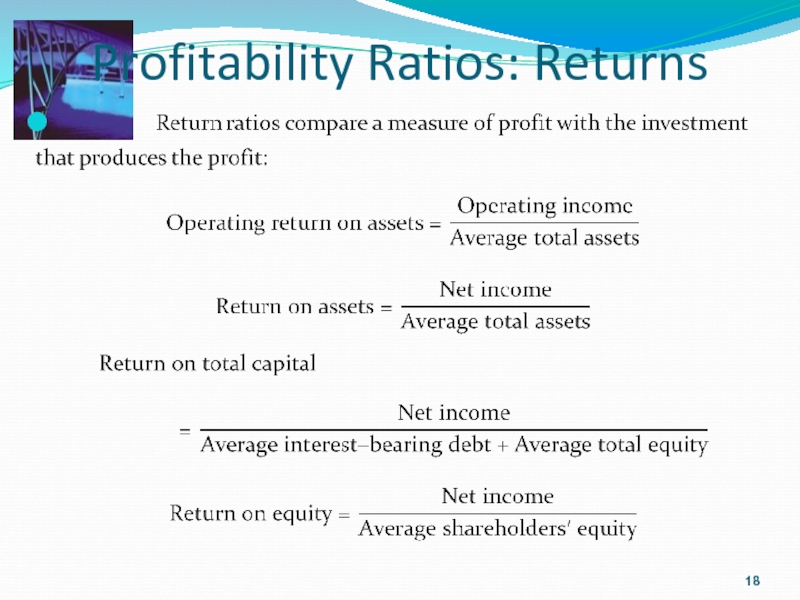
- 18. Profitability Ratios: Returns
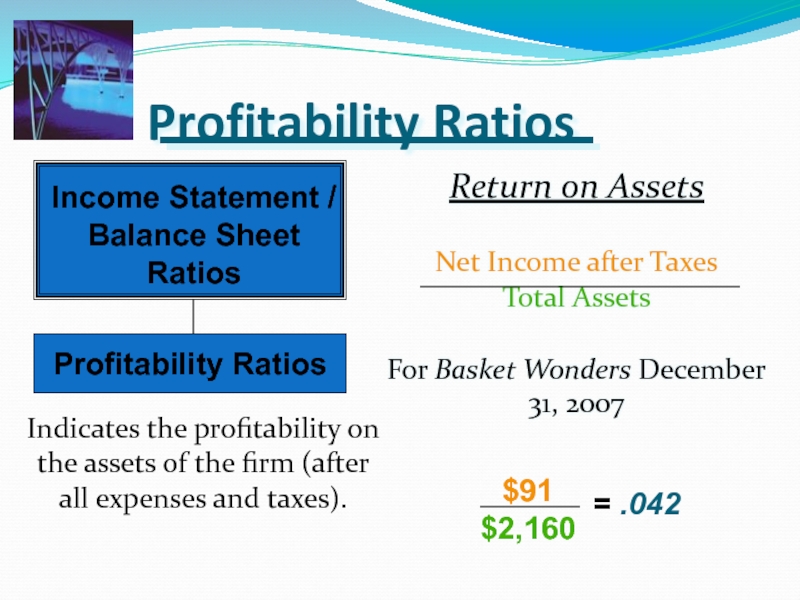
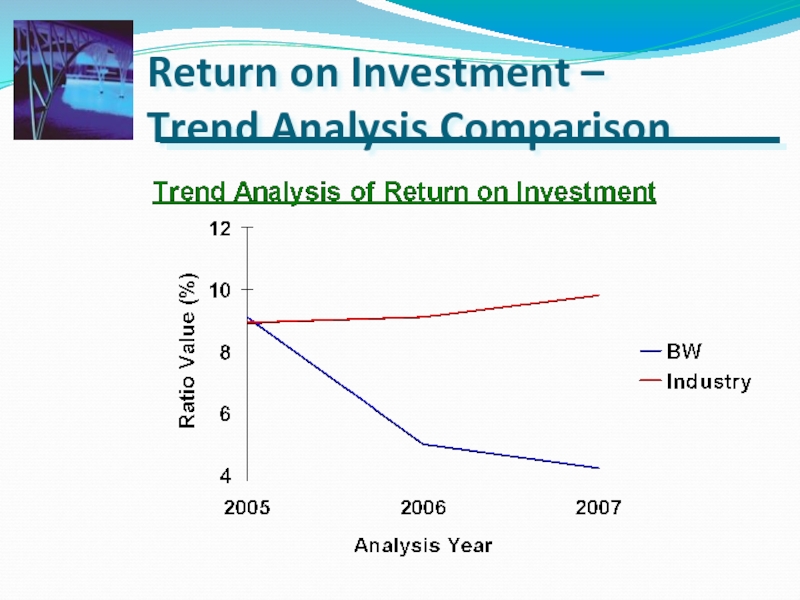
- 19. Profitability Ratios Return on Assets Net
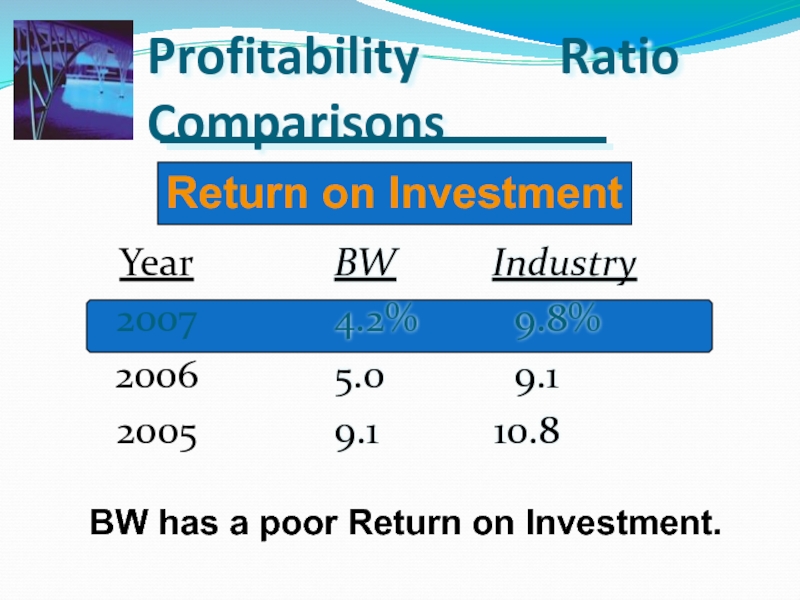
- 20. Profitability Ratio Comparisons BW Industry
- 21. Return on Investment – Trend Analysis Comparison
- 22. Profitability Ratios Return on Equity Net
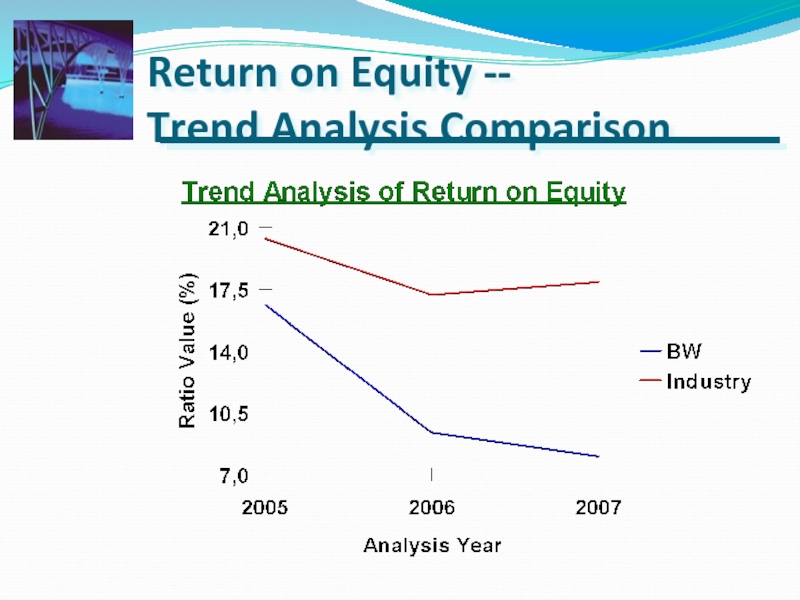
- 23. Profitability Ratio Comparisons BW
- 24. Return on Equity -- Trend Analysis Comparison
- 25. The DuPont Formulas The DuPont formula uses
- 26. Five-Component DuPont Model
- 27. Example: The DuPont Formula Suppose that an
- 28. Example: the DuPont Formula
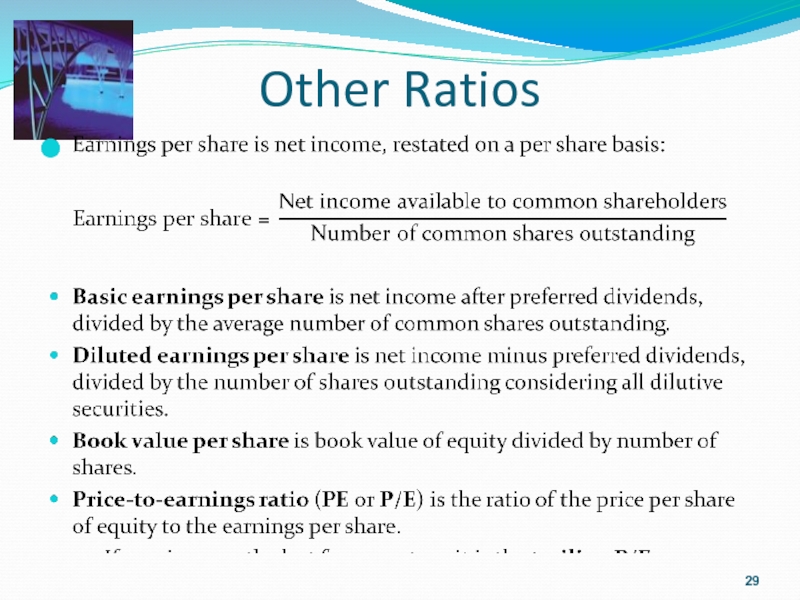
- 29. Other Ratios
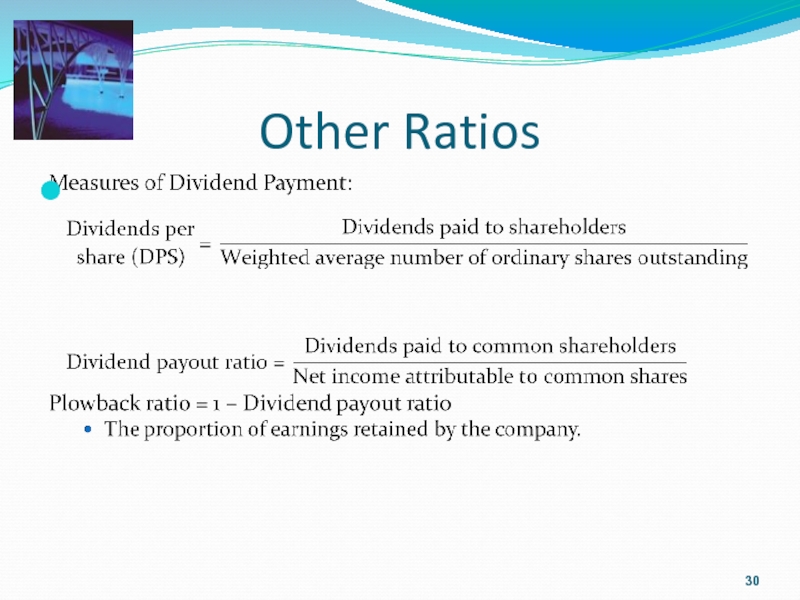
- 30. Other Ratios
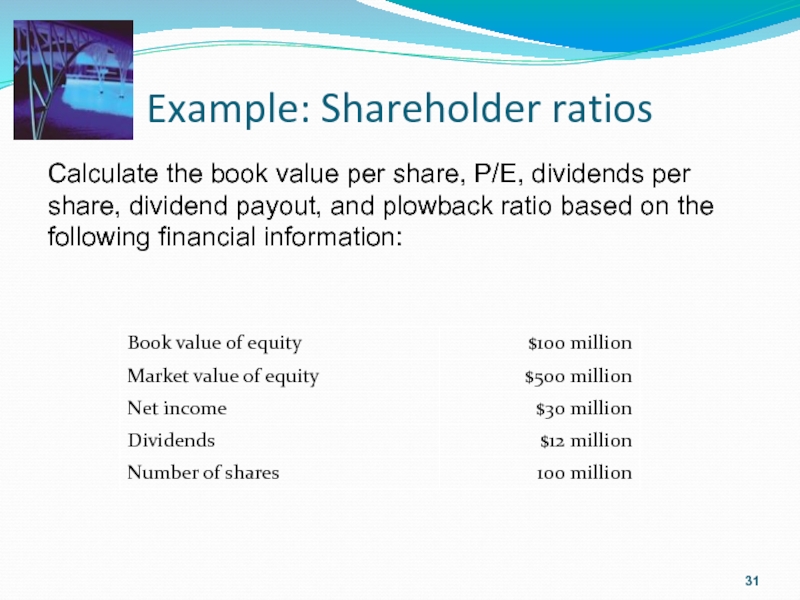
- 31. Example: Shareholder ratios Calculate the book value
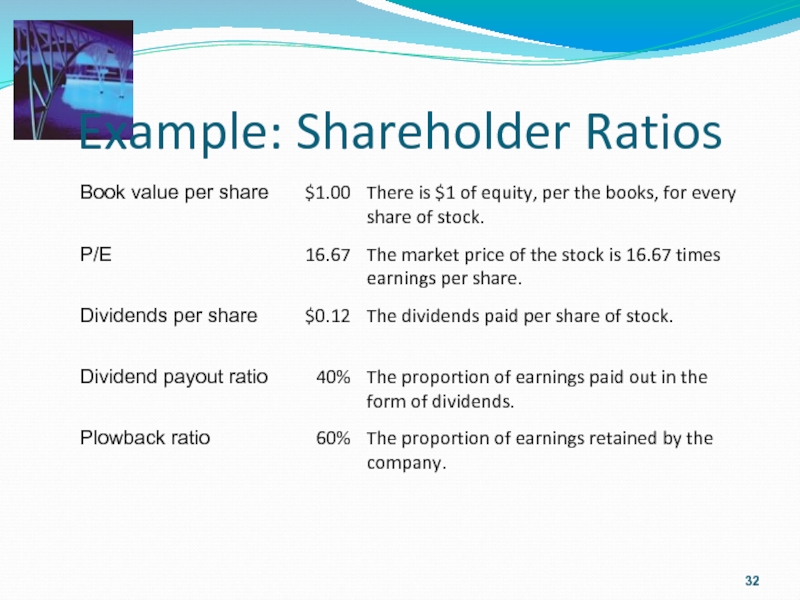
- 32. Example: Shareholder Ratios
- 33. Effective Use of Ratio Analysis In addition
- 34. Summary Financial ratio analysis and common-size analysis
Слайд 2Profitability
Margins and return ratios provide information on the profitability of a
A margin is a portion of revenues that is a profit.
A return is a comparison of a profit with the investment/asset necessary to generate the profit.
Слайд 5
Earnings, (or net income,) are simply revenues minus costs. They are
Earnings would not be a good measure of economic profits given that the financial statements are subject to accounting rules.
Earnings measure the return to equity holders. The calculation subtracts debt interest payments and taxes owed.
Earnings Before Interest and Taxes (EBIT) is also an important measure of profit. It includes payments that go to debt holders and the tax authority.
Слайд 6 Retained earnings
Retained earnings are the earnings
Retained earnings = earnings - dividends
The balance sheet can grow in one of three ways:
1. Internally, through retained earnings.
2. Externally by issuing new equity.
3. Externally by issuing new debt.
Слайд 7 Measuring profit
Return on equity (ROE)
ROE will not be the same as the firms stock return over the period.
Given that ROE uses accounting earnings as the profit
measure, it is sensitive to the manipulations discussed above.
Earnings are measured over a period of time, (ie. year,) whereas the book value of equity on the balance sheet is at a specific point of time.
Слайд 8 Return on assets
Return on
Again, ROA uses earnings to measure profit, but divides by the firm's book value.
ROA is insensitive to the firm's financing decision.
Thus, it is a measure of operating portability.
Слайд 9AAA’s Balance Sheet (Asset Side)
a. How the firm stands on a
b. What AAA owned.
c. Amounts owed by customers.
d. Future expense items already paid.
e. Cash/likely convertible to cash within 1 year.
f. Original amount paid.
g. Acc. deductions for wear and tear.
Cash and C.E. $ 90 Account. Receivables.c 394 Inventories 696 Prepaid Expenses d 5 Accumulated Tax Prepay 10 Current Assetse $1,195 Fixed Assets (@Cost)f 1030 Less: Acc. Depr. g (329) Net Fix. Assets $ 701 Investment, LT 50 Other Assets, LT 223 Total Assets b $2,169
AAA’s Balance Sheet (thousands) Dec. 31, 2015 a
Слайд 10AAA’s Balance Sheet (Liability Side)
a. Note, Assets = Liabilities + Equity.
b.
c. Owed to suppliers for goods and services.
d. Unpaid wages, salaries, etc.
e. Debts payable < 1 year.
f. Debts payable > 1 year.
g. Original investment.
h. Earnings reinvested.
Notes Payable $ 290 Account Payablesc 94 Accrued Taxes d 16 Other Accrued Liab. d 100 Current Liab. e $ 500 Long-Term Debt f 530 Shareholders’ Equity Com. Stock ($1 par) g 200 Add Pd in Capital g 729 Retained Earnings h 210 Total Equity $1,139
Total Liab/Equitya,b $2,169
AAA Balance Sheet (thousands) Dec. 31, 2015
Слайд 11AAA’s Income Statement
a. Measures profitability over a time period.
b. Received, or
c. Sales comm., adv., officers’ salaries, etc.
d. Operating income.
e. Cost of borrowed funds.
f. Taxable income.
g. Amount earned for shareholders.
Net Sales $ 2,211 Cost of Goods Sold b 1,599 Gross Profit $ 612 SG&A Expenses c 402 EBITd $ 210 Interest Expensee 59 EBT f $ 151 Income Taxes 60
EATg $ 91
Cash Dividends 38 Increase in RE $ 53
AAA Profit and Losses Statement (in thousands) for Year Ending December 31, 2015a
Слайд 12Profitability Ratios
Gross Profit Margin
Gross Profit
Net Sales
For Basket Wonders December 31, 2007
Indicates
Income Statement /
Balance Sheet
Ratios
Profitability Ratios
$612
$2,211
= .277
Слайд 13
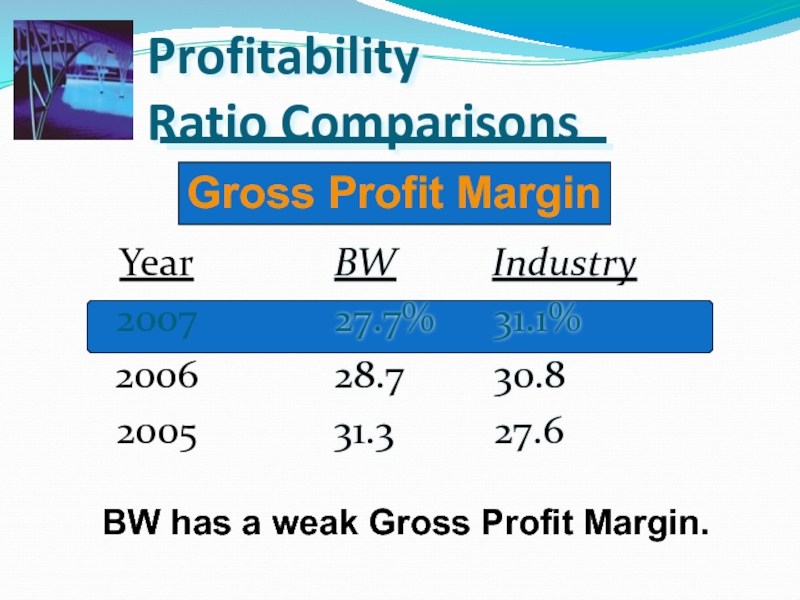
Profitability
Ratio Comparisons
BW Industry
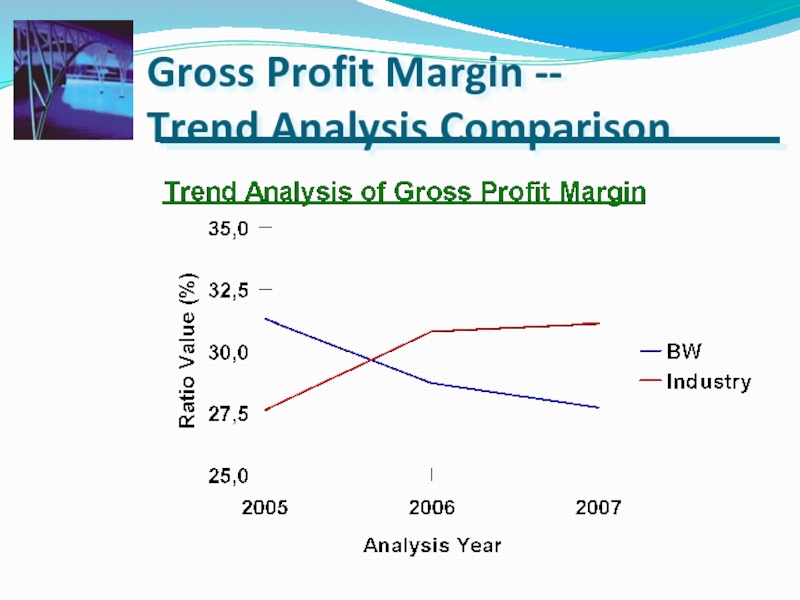
27.7% 31.1%
28.7 30.8
31.3 27.6
Year
2007
2006
2005
Gross Profit Margin
BW has a weak Gross Profit
Слайд 15Profitability Ratios
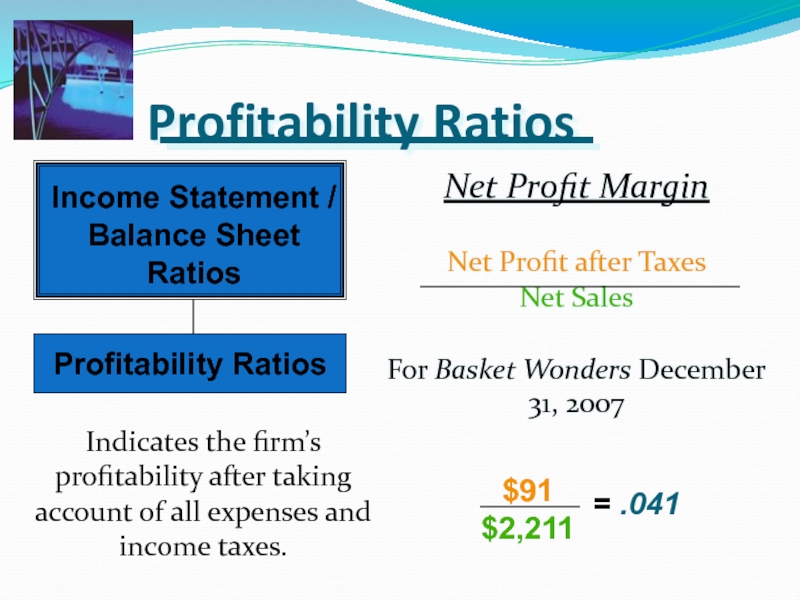
Net Profit Margin
Net Profit after Taxes
Net Sales
For Basket Wonders December
Indicates the firm’s profitability after taking account of all expenses and income taxes.
Income Statement /
Balance Sheet
Ratios
Profitability Ratios
$91
$2,211
= .041
Слайд 16
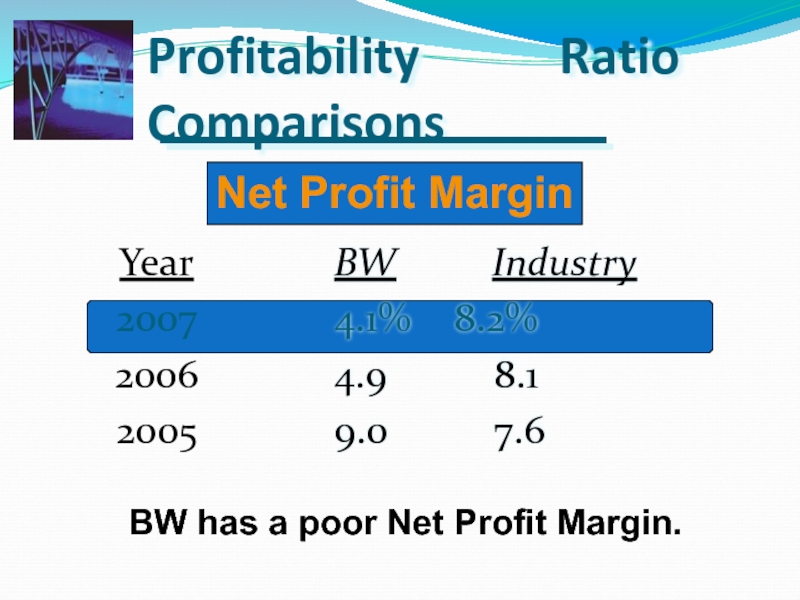
Profitability Ratio Comparisons
BW Industry
4.1% 8.2%
4.9 8.1
9.0 7.6
Year
2007
2006
2005
Net Profit Margin
BW has a poor Net
Слайд 19Profitability Ratios
Return on Assets
Net Income after Taxes
Total Assets
For Basket Wonders December
Indicates the profitability on the assets of the firm (after all expenses and taxes).
Income Statement /
Balance Sheet
Ratios
Profitability Ratios
$91
$2,160
= .042
Слайд 20
Profitability Ratio Comparisons
BW Industry
4.2% 9.8%
5.0 9.1
9.1 10.8
Year
2007
2006
2005
Return on Investment
BW has a
Слайд 22Profitability Ratios
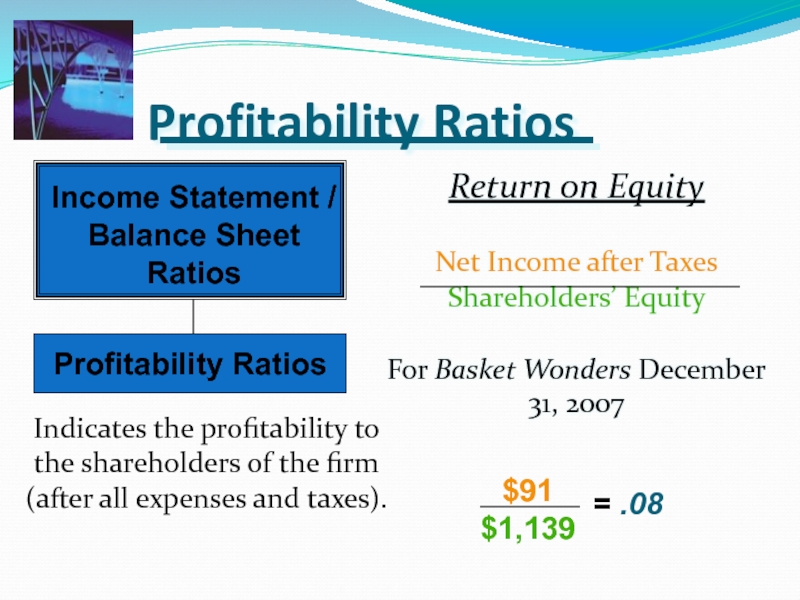
Return on Equity
Net Income after Taxes
Shareholders’ Equity
For Basket Wonders December
Indicates the profitability to the shareholders of the firm (after all expenses and taxes).
Income Statement /
Balance Sheet
Ratios
Profitability Ratios
$91
$1,139
= .08
Слайд 23
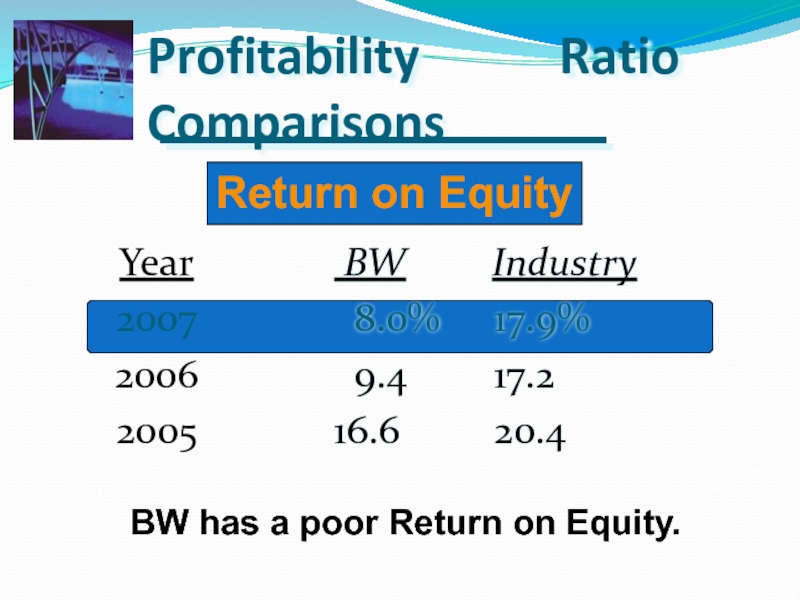
Profitability Ratio Comparisons
BW Industry
8.0% 17.9%
9.4 17.2
16.6 20.4
Year
2007
2006
2005
Return on Equity
BW
Слайд 25The DuPont Formulas
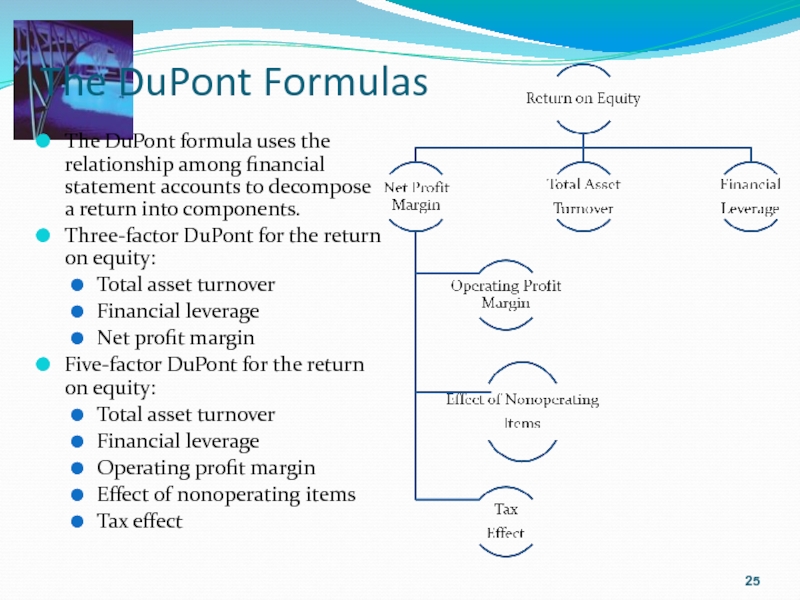
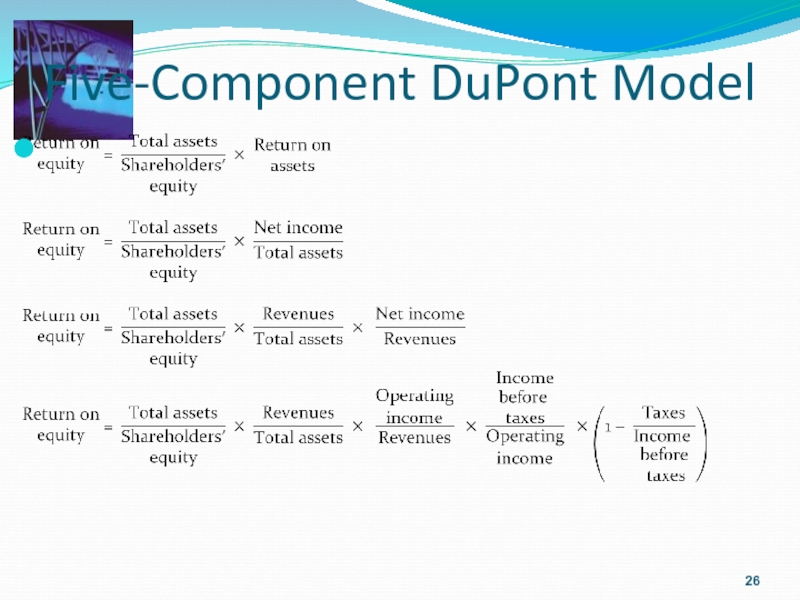
The DuPont formula uses the relationship among financial statement
Three-factor DuPont for the return on equity:
Total asset turnover
Financial leverage
Net profit margin
Five-factor DuPont for the return on equity:
Total asset turnover
Financial leverage
Operating profit margin
Effect of nonoperating items
Tax effect
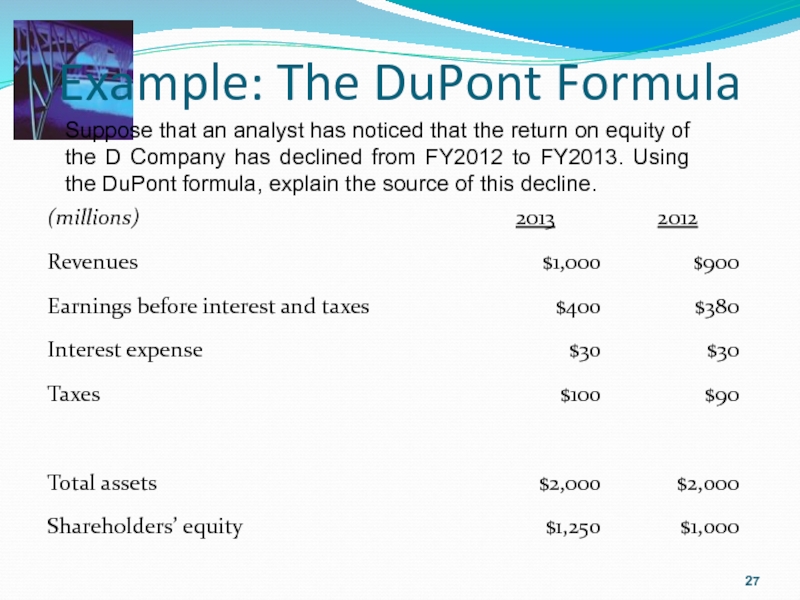
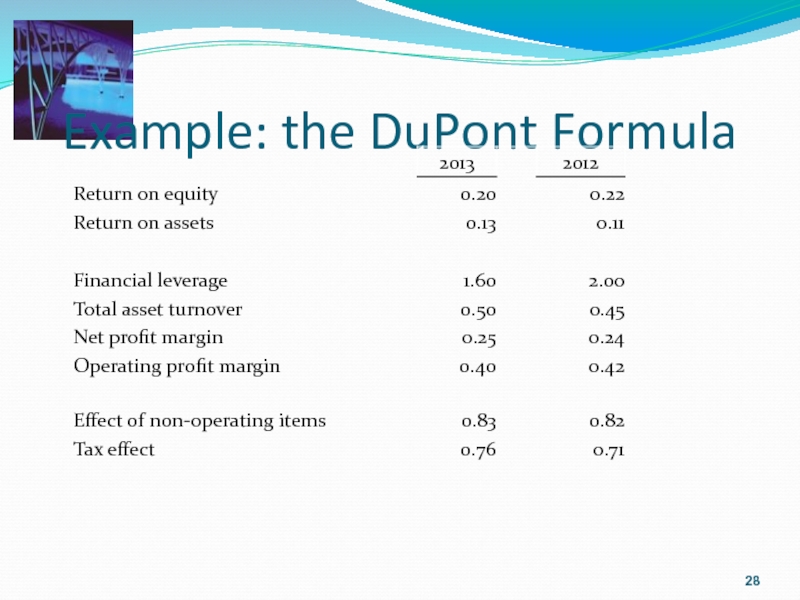
Слайд 27Example: The DuPont Formula
Suppose that an analyst has noticed that the
Слайд 31Example: Shareholder ratios
Calculate the book value per share, P/E, dividends per
Слайд 33Effective Use of Ratio Analysis
In addition to ratios, an analyst should
Effective use of ratios requires looking at ratios
Over time.
Compared with other companies in the same line of business.
In the context of major events in the company (for example, mergers or divestitures), accounting changes, and changes in the company’s product mix.
Слайд 34Summary
Financial ratio analysis and common-size analysis help gauge the financial performance
A thorough financial analysis of a company requires examining its efficiency in putting its assets to work, its liquidity position, its solvency, and its profitability.
We can use the tools of common-size analysis and financial ratio analysis, including the DuPont model, to help understand where a company has been.
We then use relationships among financial statement accounts in pro forma analysis, forecasting the company’s income statements and balance sheets for future periods, to see how the company’s performance is likely to evolve.
