- Главная
- Разное
- Дизайн
- Бизнес и предпринимательство
- Аналитика
- Образование
- Развлечения
- Красота и здоровье
- Финансы
- Государство
- Путешествия
- Спорт
- Недвижимость
- Армия
- Графика
- Культурология
- Еда и кулинария
- Лингвистика
- Английский язык
- Астрономия
- Алгебра
- Биология
- География
- Детские презентации
- Информатика
- История
- Литература
- Маркетинг
- Математика
- Медицина
- Менеджмент
- Музыка
- МХК
- Немецкий язык
- ОБЖ
- Обществознание
- Окружающий мир
- Педагогика
- Русский язык
- Технология
- Физика
- Философия
- Химия
- Шаблоны, картинки для презентаций
- Экология
- Экономика
- Юриспруденция
Capital adequacy: BASEL 2 and BASEL 3 презентация
Содержание
- 1. Capital adequacy: BASEL 2 and BASEL 3
- 2. AGENDA: Functions of bank capital; Definitions
- 3. Importance of Bank Capital Absorb unanticipated
- 4. Two DEFINITIONS of capital: Economic
- 5. Problem 1
- 6. Why do FI and Regulators are against
- 7. Leverage Ratio Banks are required to meet
- 8. OBJECTIVES of CAPITAL ADEQUACY: Development of more
- 9. History of Basel capital requirements: 1988 –
- 10. BASEL 2 (adopted in 2004 by G20)
- 11. STRUCTURE OF BANK CAPITAL:
- 12. STRUCTURE OF BANK CAPITAL: TIER
- 13. MINIMUM RATIOS: LIMITS AND RESTRICTIONS:
- 14. Capital ratios of Kazakhstani banks
- 15. Average leverage ratios of Kazakhstani banks
- 16. Growth in assets, loans and Loan loss provisions of Kazakhstani banks
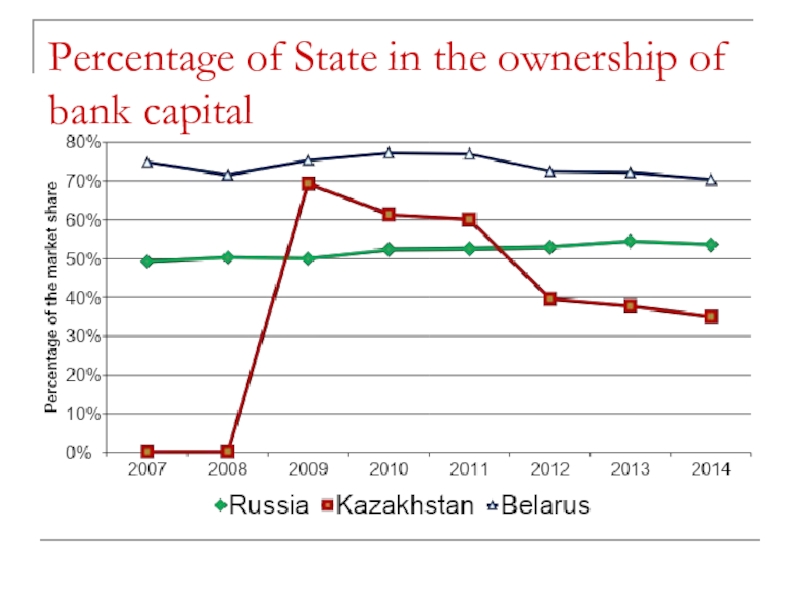
- 17. Percentage of State in the ownership of bank capital
- 18. RISK WEIGHTED ASSETS Total Risk-weighted Assets (TRWA)
- 19. ESTIMATION OF RISK WEIGHTED ASSETS FOR CREDIT
- 20. Standardised approach (use outside credit rating)
- 21. EXAMPLE: Step 1. Calculate Risk-Weighted on-Balance Sheet
- 22. Step 2. Calculate Credit Equivalents for Off-Balance
- 23. Step 3. Calculate Credit Equivalents for OTC
- 24. Step 4. Total Risk Weighted assets
- 25. Example continued: Calculate the minimum capital
- 26. Internal rating based approach (foundation and advanced)
- 27. Foundation and advanced approaches differ primary in
- 28. MARKET RISK (adopted in 1998) April
- 29. The pro-cyclicality of the VaR requirements
- 30. What is Stressed VaR? The
- 31. Definition of Operational Risk Risk of loss
- 32. Basel II Pillar 1 – Operational Risk
- 33. Basic Indicator Approach (BIA) Banks using the
- 34. A Standardised Approach (SA) In the
- 35. PILLAR 2: Supervisory Review SRP
- 36. PILLAR 2: Supervisory Review 4
- 37. The supervisory review process is intended not
- 38. Internal Capital Adequacy Assessment Process
- 39. PILLAR 3: Market discipline The
- 40. Information to disclosure should include: Capital
- 41. Problems with Basel 2 revealed by the
- 42. BASEL III On 12th of
- 43. A. Comparison of Basel 2 and Basel
- 44. Basel III squeezes capital Common Equity Tier
- 45. B. Capital Conservation buffer The purpose of
- 46. C. Countercyclical capital buffer Countercyclical buffer An
- 47. C. Countercyclical Capital Buffer BASEL II:
- 48. Capital for Systemically Important Banks only
Слайд 2AGENDA:
Functions of bank capital;
Definitions of Bank Capital, leverage ratio;
Structure of BASEL
Bank capital and minimum ratios;
Risk-weighted assets for credit risk, market risk and operational risk
Basel 2 and Basel 3.
Слайд 3Importance of Bank Capital
Absorb unanticipated losses and preserve confidence of
Protect uninsured depositors and other stakeholders;
Protect FI owners against increases in insurance premiums and liquidity premiums;
Acquire real investments in order to provide financial services.
Слайд 4Two DEFINITIONS of capital:
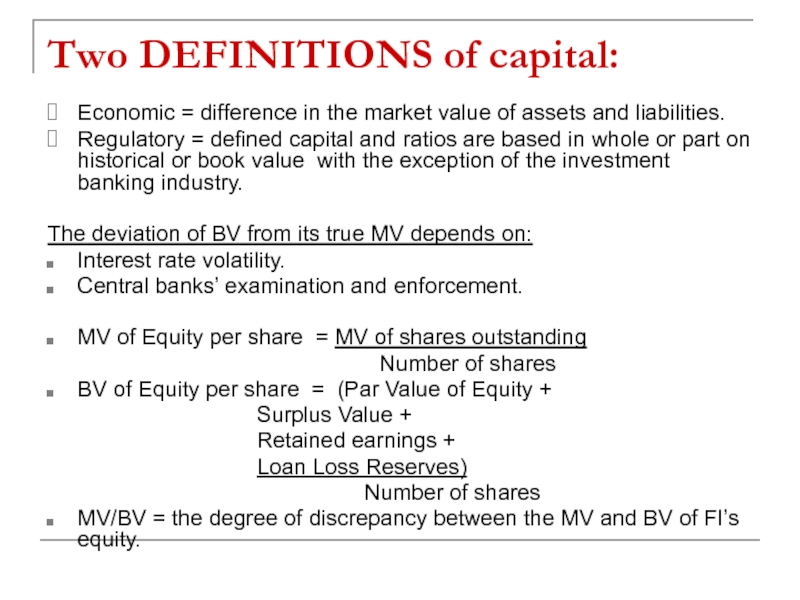
Economic = difference in the market value
Regulatory = defined capital and ratios are based in whole or part on historical or book value with the exception of the investment banking industry.
The deviation of BV from its true MV depends on:
Interest rate volatility.
Central banks’ examination and enforcement.
MV of Equity per share = MV of shares outstanding
Number of shares
BV of Equity per share = (Par Value of Equity +
Surplus Value +
Retained earnings +
Loan Loss Reserves)
Number of shares
MV/BV = the degree of discrepancy between the MV and BV of FI’s equity.
Слайд 6Why do FI and Regulators are against market value accounting?
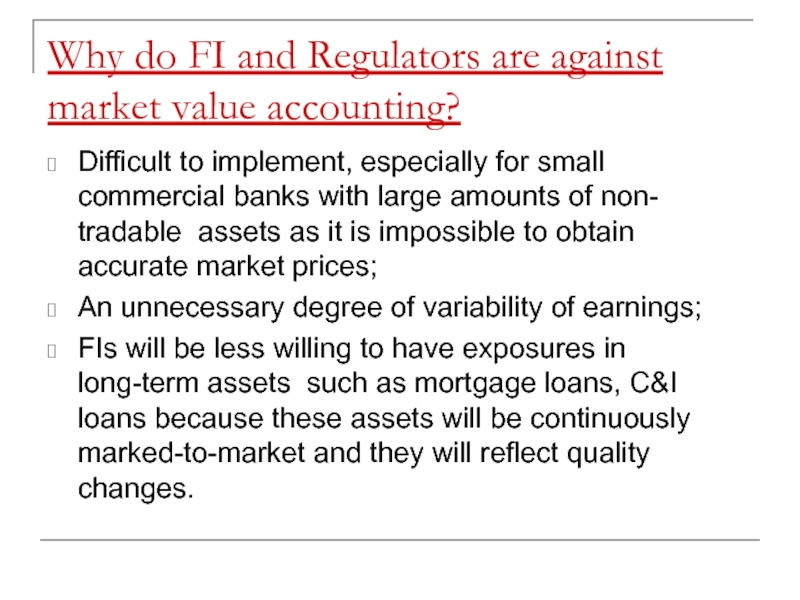
Difficult to
An unnecessary degree of variability of earnings;
FIs will be less willing to have exposures in long-term assets such as mortgage loans, C&I loans because these assets will be continuously marked-to-market and they will reflect quality changes.
Слайд 7Leverage Ratio
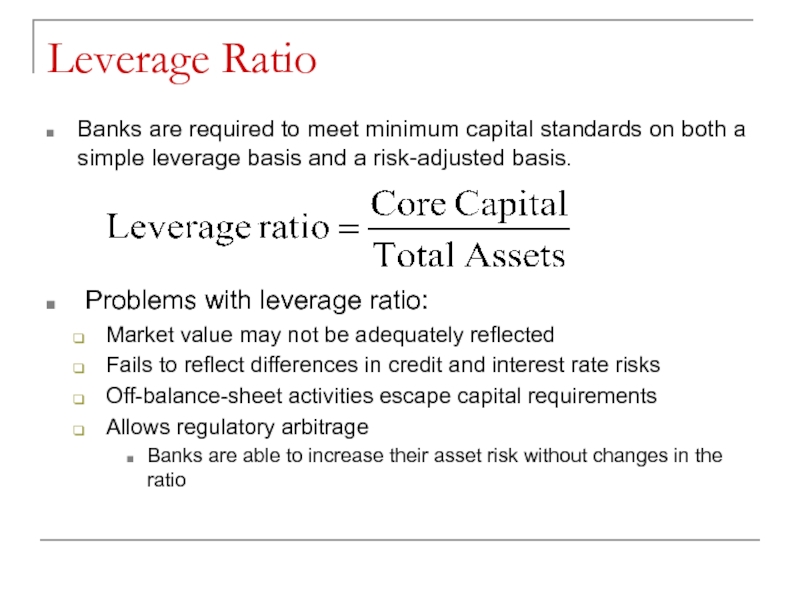
Banks are required to meet minimum capital standards on both
Problems with leverage ratio:
Market value may not be adequately reflected
Fails to reflect differences in credit and interest rate risks
Off-balance-sheet activities escape capital requirements
Allows regulatory arbitrage
Banks are able to increase their asset risk without changes in the ratio
Слайд 8OBJECTIVES of CAPITAL ADEQUACY:
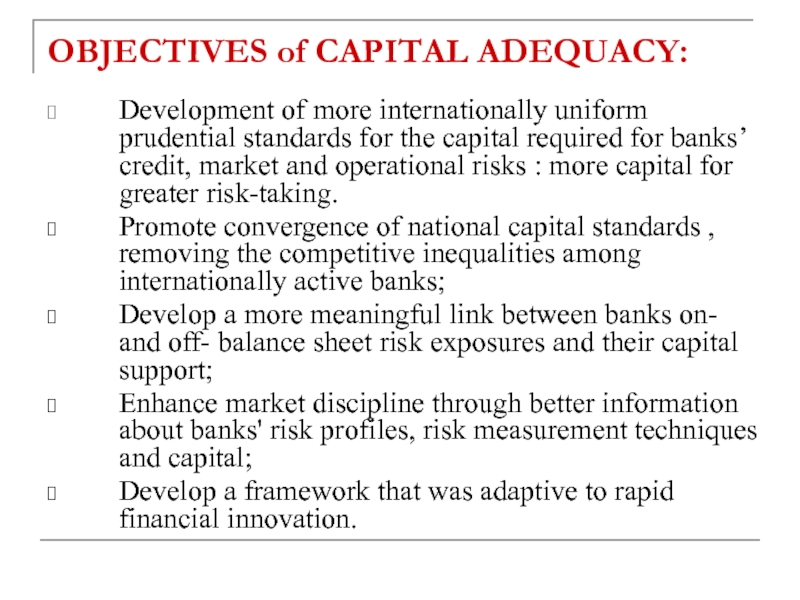
Development of more internationally uniform prudential standards for
Promote convergence of national capital standards , removing the competitive inequalities among internationally active banks;
Develop a more meaningful link between banks on- and off- balance sheet risk exposures and their capital support;
Enhance market discipline through better information about banks' risk profiles, risk measurement techniques and capital;
Develop a framework that was adaptive to rapid financial innovation.
Слайд 9History of Basel capital requirements:
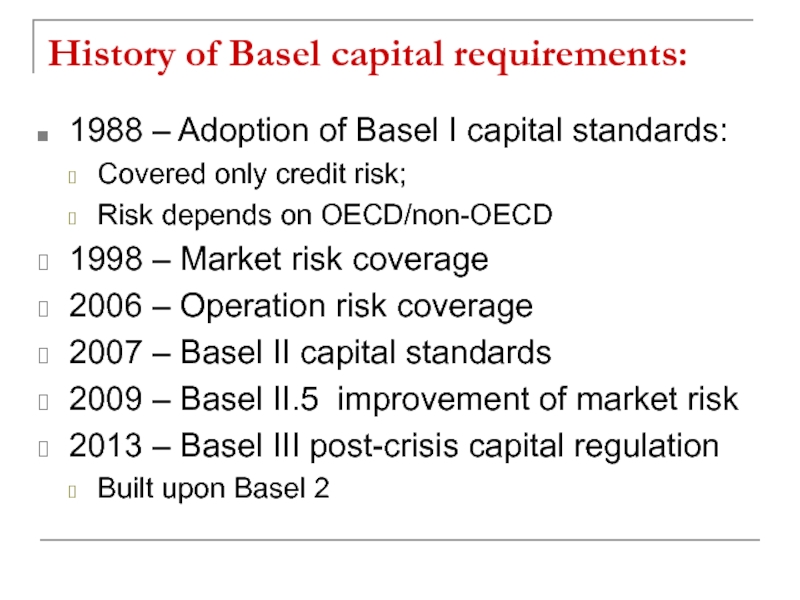
1988 – Adoption of Basel I capital
Covered only credit risk;
Risk depends on OECD/non-OECD
1998 – Market risk coverage
2006 – Operation risk coverage
2007 – Basel II capital standards
2009 – Basel II.5 improvement of market risk
2013 – Basel III post-crisis capital regulation
Built upon Basel 2
Слайд 10BASEL 2 (adopted in 2004 by G20)
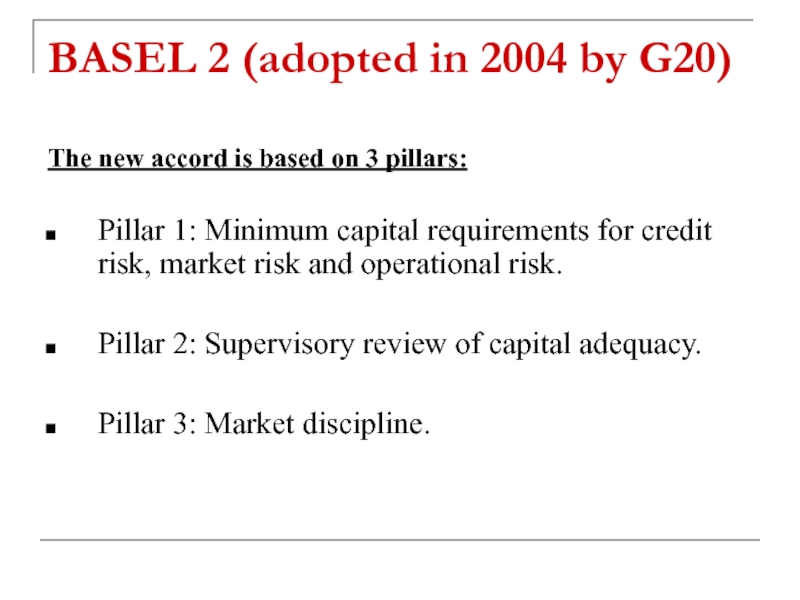
The new accord is based
Pillar 1: Minimum capital requirements for credit risk, market risk and operational risk.
Pillar 2: Supervisory review of capital adequacy.
Pillar 3: Market discipline.
Слайд 11STRUCTURE OF BANK CAPITAL:
TIER 1
(CORE CAPITAL) + Non-cumulative perpetual preferred stocks
+ Retained earnings
+ Minority interest in equity accounts of consolidated subsidiaries
+ Disclosed reserves
Deductions: – Goodwill
– Increase in equity capital resulting from a securitization exposure
Слайд 12STRUCTURE OF BANK CAPITAL:
TIER 2 (SUPPLEMENTARY CAPITAL) =
+ Cumulative
+ Undisclosed Reserves
+ Asset Revaluation Reserves
+ General Loan Loss Reserves
+ Hybrid (Debt/Equity) Capital Instruments
+ Subordinated long-term debt
Other Deductions: 50% from Tier 1 and 50% from Tier 2 capital:
- Investments in unconsolidated subsidiaries engaged in banking and financial activities;
TIER 3 (to cover market risk only) = subordinated short-term debt
TOTAL CAPITAL = TIER 1 + TIER 2 + Tier 3 - Deductions
Слайд 13MINIMUM RATIOS:
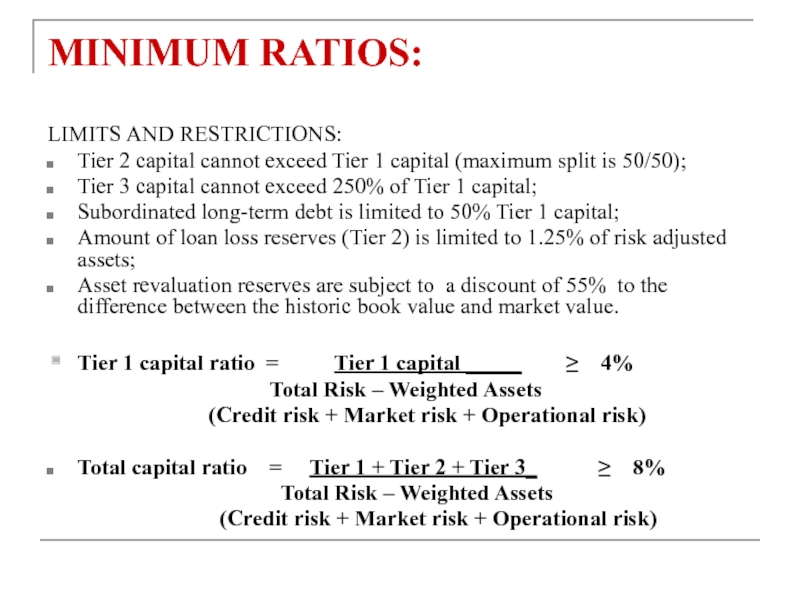
LIMITS AND RESTRICTIONS:
Tier 2 capital cannot exceed Tier 1
Tier 3 capital cannot exceed 250% of Tier 1 capital;
Subordinated long-term debt is limited to 50% Tier 1 capital;
Amount of loan loss reserves (Tier 2) is limited to 1.25% of risk adjusted assets;
Asset revaluation reserves are subject to a discount of 55% to the difference between the historic book value and market value.
Tier 1 capital ratio = Tier 1 capital _____ ≥ 4%
Total Risk – Weighted Assets
(Credit risk + Market risk + Operational risk)
Total capital ratio = Tier 1 + Tier 2 + Tier 3_ ≥ 8%
Total Risk – Weighted Assets
(Credit risk + Market risk + Operational risk)
Слайд 18RISK WEIGHTED ASSETS
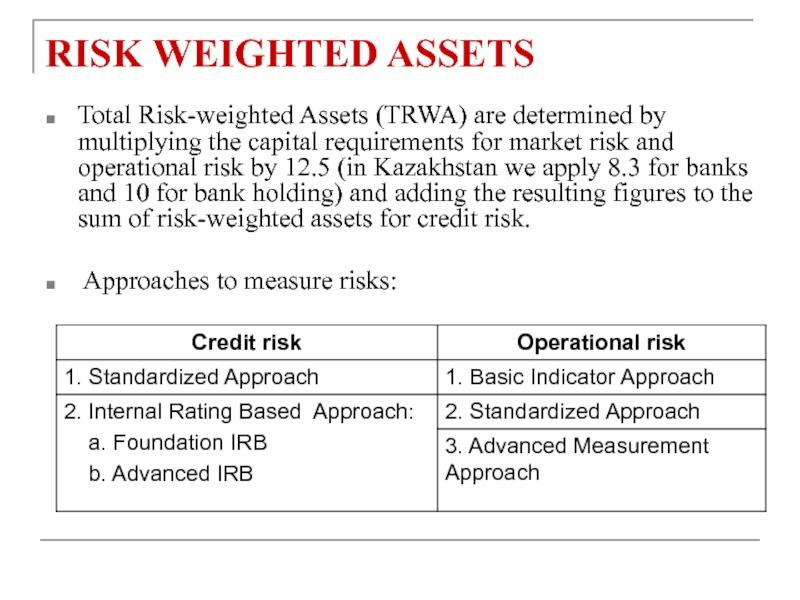
Total Risk-weighted Assets (TRWA) are determined by multiplying the
Approaches to measure risks:
Слайд 19ESTIMATION OF RISK WEIGHTED ASSETS FOR CREDIT RISK: Standardized approach
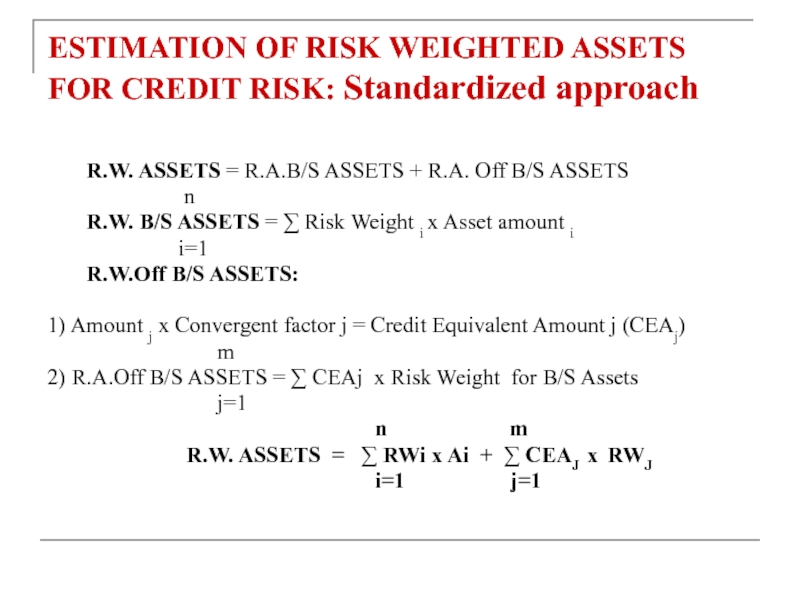
n
R.W. B/S ASSETS = ∑ Risk Weight i x Asset amount i
i=1
R.W.Off B/S ASSETS:
1) Amount j x Convergent factor j = Credit Equivalent Amount j (CEAj)
m
2) R.A.Off B/S ASSETS = ∑ CEAj x Risk Weight for B/S Assets
j=1
n m
R.W. ASSETS = ∑ RWi x Ai + ∑ CEAJ x RWJ
i=1 j=1
Слайд 20Standardised approach (use outside credit rating)
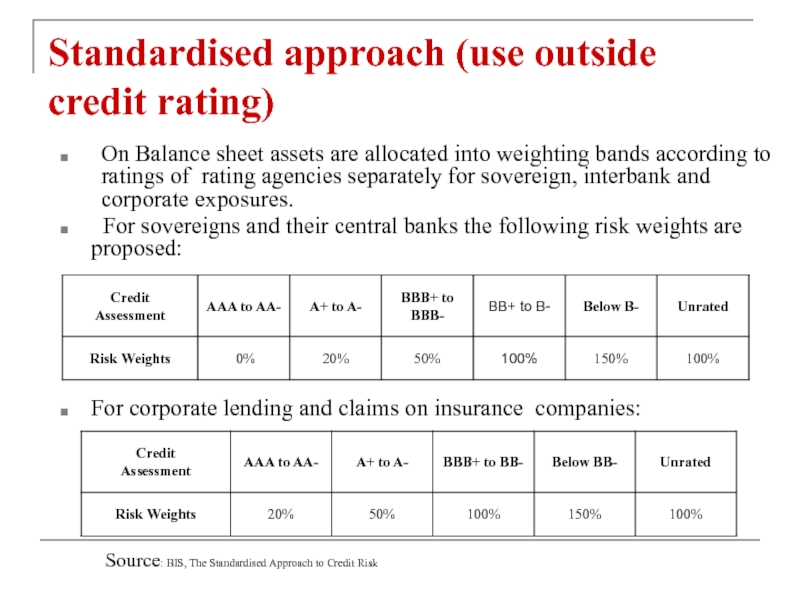
On Balance sheet assets are allocated
For sovereigns and their central banks the following risk weights are proposed:
For corporate lending and claims on insurance companies:
Source: BIS, The Standardised Approach to Credit Risk
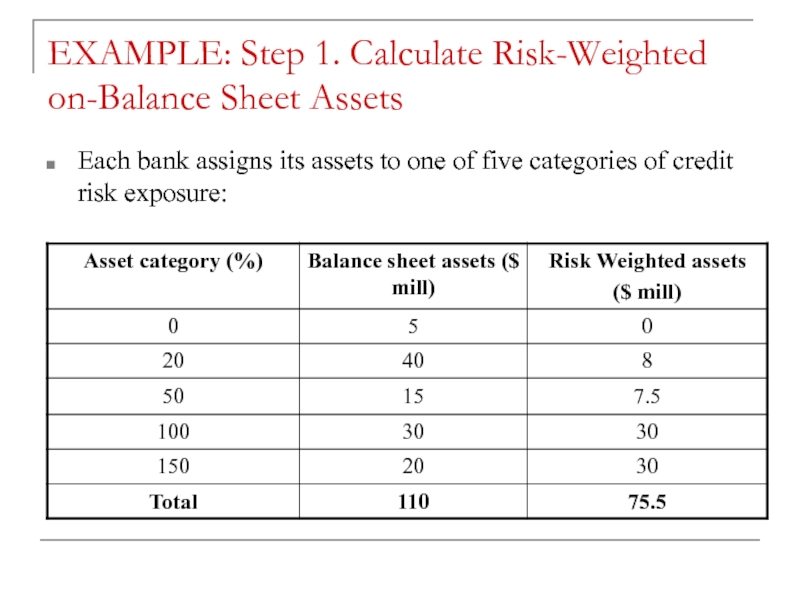
Слайд 21EXAMPLE: Step 1. Calculate Risk-Weighted on-Balance Sheet Assets
Each bank assigns its
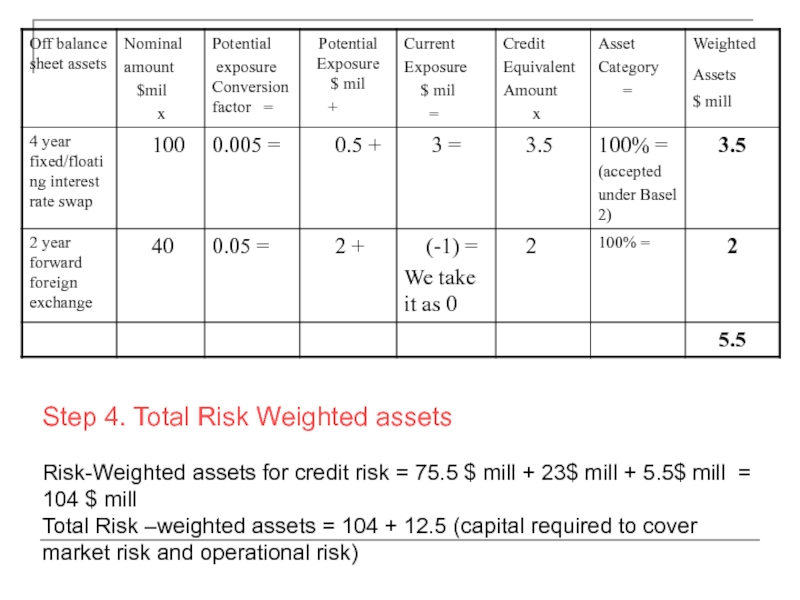
Слайд 22Step 2. Calculate Credit Equivalents for Off-Balance sheet Items other than
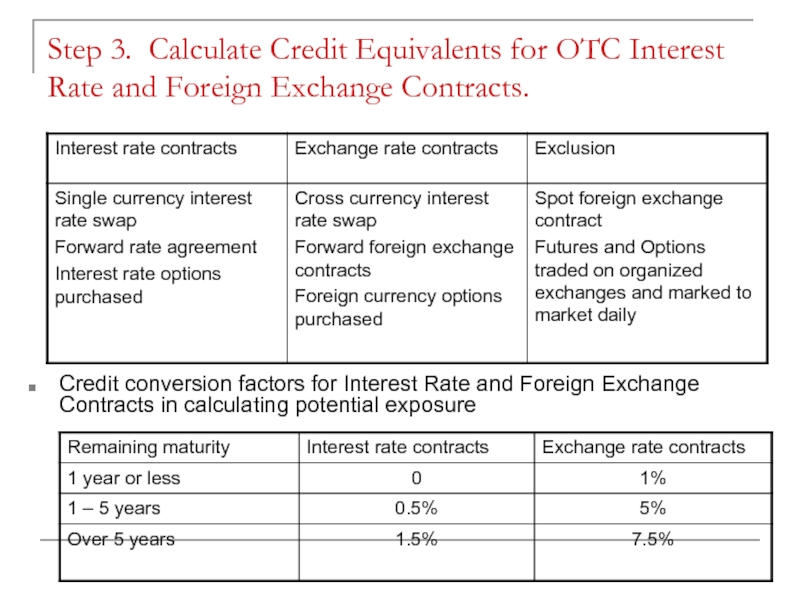
Слайд 23Step 3. Calculate Credit Equivalents for OTC Interest Rate and Foreign
Credit conversion factors for Interest Rate and Foreign Exchange Contracts in calculating potential exposure
Слайд 24Step 4. Total Risk Weighted assets
Risk-Weighted assets for credit risk =
104 $ mill
Total Risk –weighted assets = 104 + 12.5 (capital required to cover market risk and operational risk)
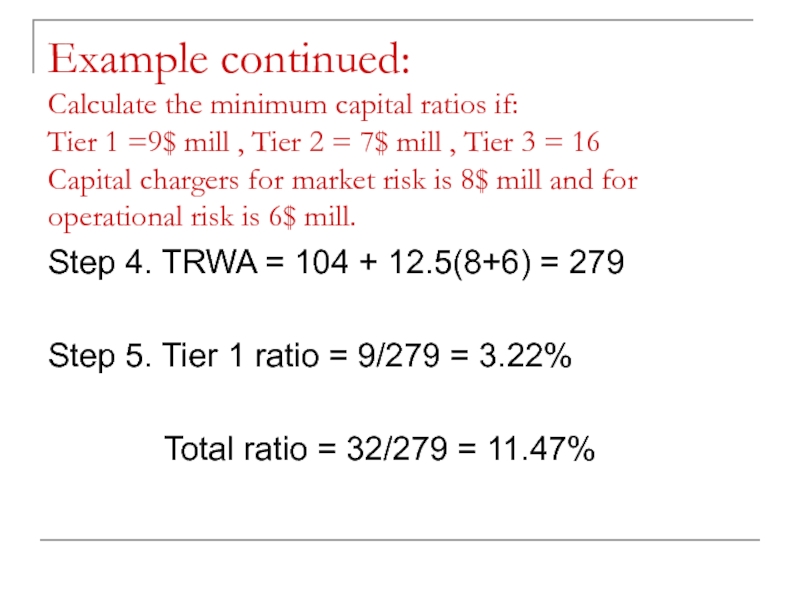
Слайд 25Example continued: Calculate the minimum capital ratios if: Tier 1 =9$ mill
Step 4. TRWA = 104 + 12.5(8+6) = 279
Step 5. Tier 1 ratio = 9/279 = 3.22%
Total ratio = 32/279 = 11.47%
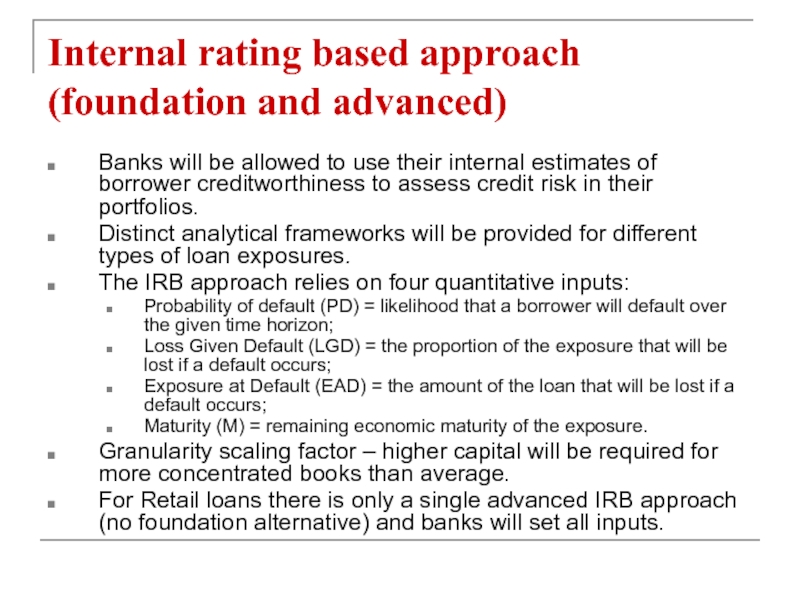
Слайд 26Internal rating based approach (foundation and advanced)
Banks will be allowed to
Distinct analytical frameworks will be provided for different types of loan exposures.
The IRB approach relies on four quantitative inputs:
Probability of default (PD) = likelihood that a borrower will default over the given time horizon;
Loss Given Default (LGD) = the proportion of the exposure that will be lost if a default occurs;
Exposure at Default (EAD) = the amount of the loan that will be lost if a default occurs;
Maturity (M) = remaining economic maturity of the exposure.
Granularity scaling factor – higher capital will be required for more concentrated books than average.
For Retail loans there is only a single advanced IRB approach (no foundation alternative) and banks will set all inputs.
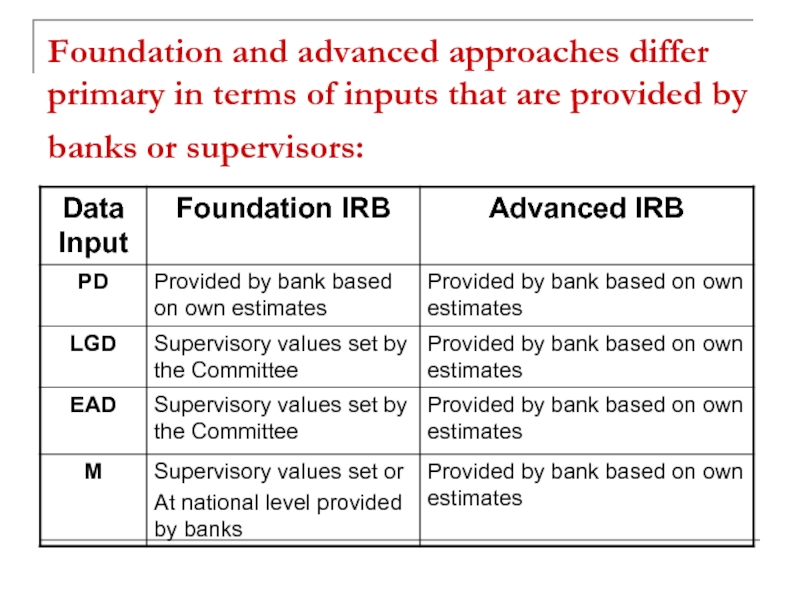
Слайд 27Foundation and advanced approaches differ primary in terms of inputs that
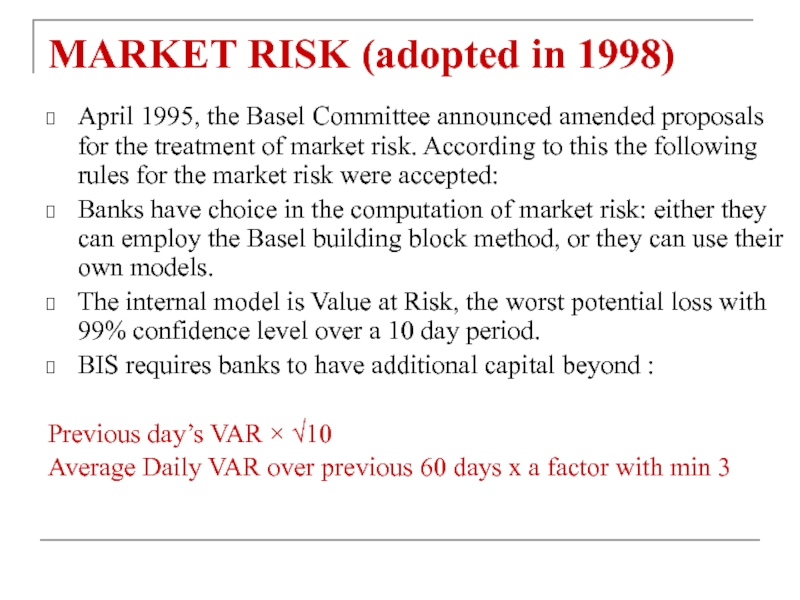
Слайд 28MARKET RISK (adopted in 1998)
April 1995, the Basel Committee announced amended
Banks have choice in the computation of market risk: either they can employ the Basel building block method, or they can use their own models.
The internal model is Value at Risk, the worst potential loss with 99% confidence level over a 10 day period.
BIS requires banks to have additional capital beyond :
Previous day’s VAR × √10
Average Daily VAR over previous 60 days x a factor with min 3
Слайд 29The pro-cyclicality of the VaR requirements
VaR to “an airbag that works
Слайд 30What is Stressed VaR?
The new component of stressed VaR is defined
Each latest available stressed VaR number (sVaRt-1)
An average of the stressed VaR measures over the preceding sixty (60)days (sVaRavg) multiplied my a multiplication factor ms
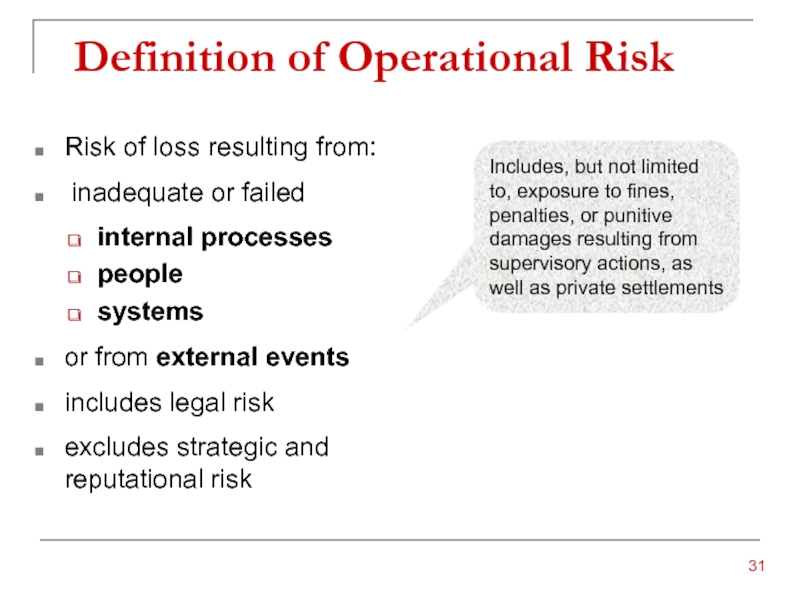
Слайд 31Definition of Operational Risk
Risk of loss resulting from:
inadequate or failed
internal
people
systems
or from external events
includes legal risk
excludes strategic and reputational risk
Includes, but not limited to, exposure to fines, penalties, or punitive damages resulting from supervisory actions, as well as private settlements
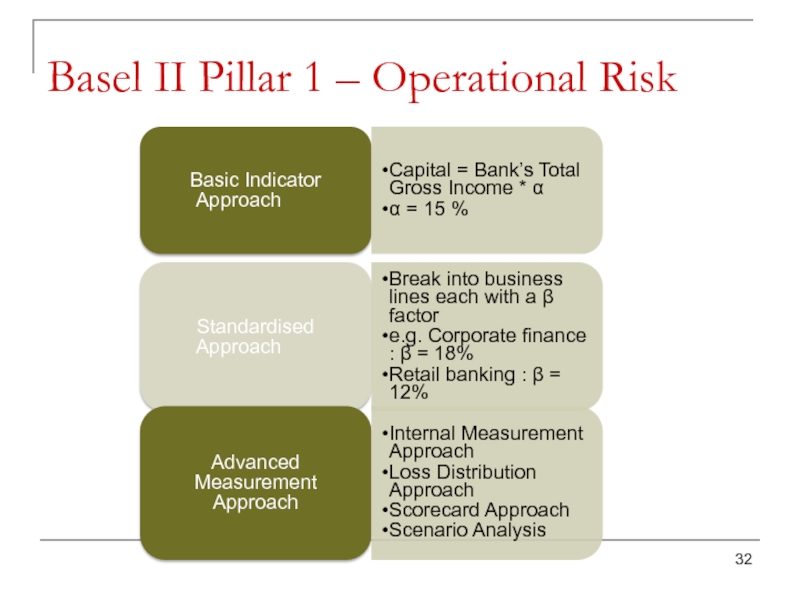
Слайд 32Basel II Pillar 1 – Operational Risk
Basic Indicator Approach
Capital = Bank’s
α = 15 %
Standardised Approach
Break into business lines each with a β factor
e.g. Corporate finance : β = 18%
Retail banking : β = 12%
Advanced Measurement Approach
Internal Measurement Approach
Loss Distribution Approach
Scorecard Approach
Scenario Analysis
Слайд 33Basic Indicator Approach (BIA)
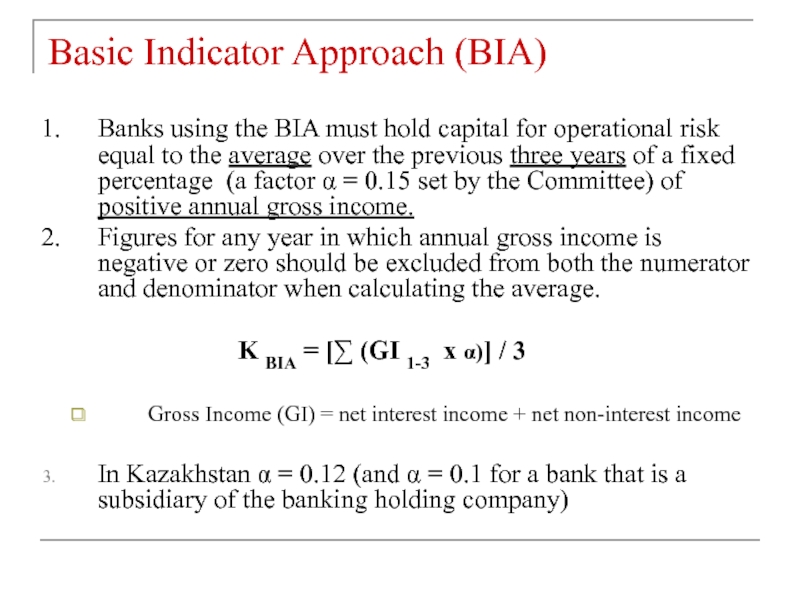
Banks using the BIA must hold capital for
Figures for any year in which annual gross income is negative or zero should be excluded from both the numerator and denominator when calculating the average.
K BIA = [∑ (GI 1-3 x α)] / 3
Gross Income (GI) = net interest income + net non-interest income
In Kazakhstan α = 0.12 (and α = 0.1 for a bank that is a subsidiary of the banking holding company)
Слайд 34A Standardised Approach (SA)
In the SA, banks’ activities are divided into
Capital charge for each business line is computed by multiplying a factor β for each line by the gross income for that business line, then summing.
Total capital charge is calculated as the three year average of the capital charges across each business lines in each year.
Note that the negative capital charges (resulting from negative gross income) in any business line may offset positive capital charges in other business line without limit.
KSA = {∑ years 1-3 max[∑ (GI 1-8 x β1-8),0] / 3
The values of betas are detailed below:
Corporate finance, trading and sales, payment and settlement – 18%;
Commercial banking, agency services – 15%
Retail banking, asset management, retail brokerage – 12%
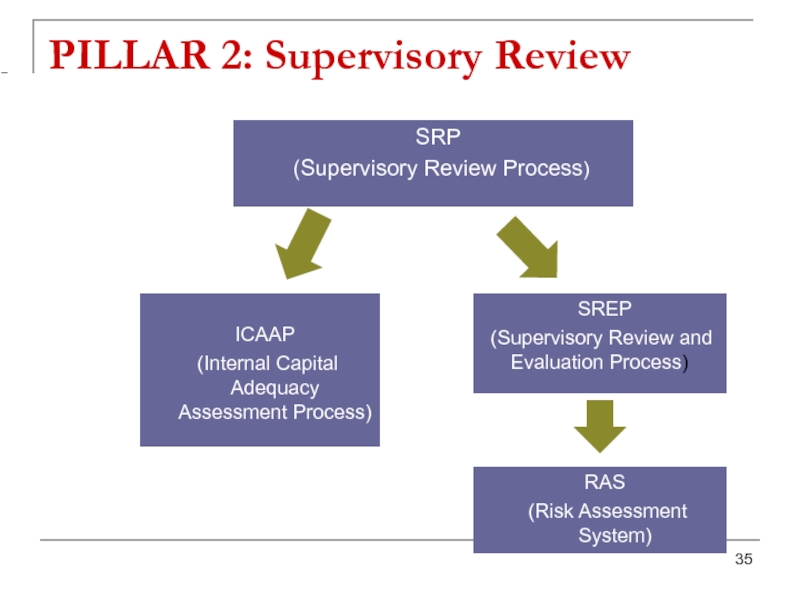
Слайд 35PILLAR 2: Supervisory Review
SRP
(Supervisory Review Process)
ICAAP
(Internal Capital Adequacy
SREP
(Supervisory Review and Evaluation Process)
RAS
(Risk Assessment System)
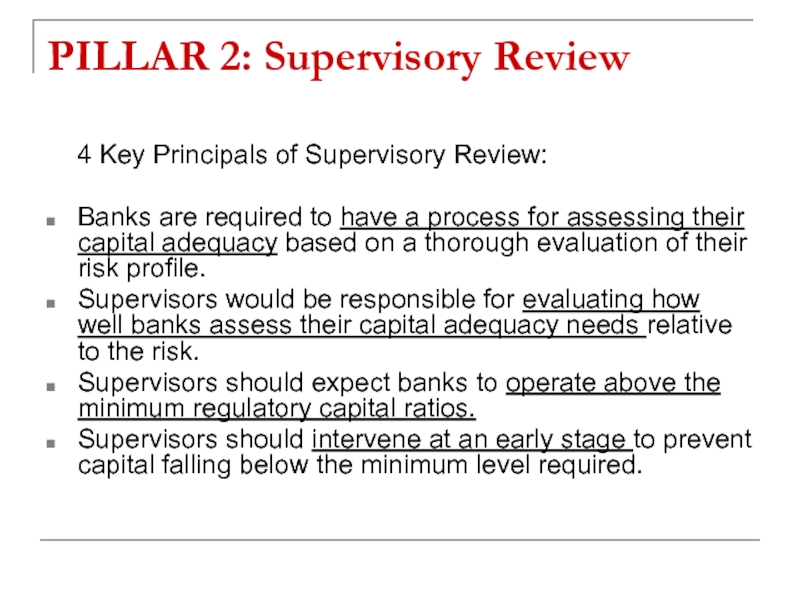
Слайд 36PILLAR 2: Supervisory Review
4 Key Principals of Supervisory Review:
Banks
Supervisors would be responsible for evaluating how well banks assess their capital adequacy needs relative to the risk.
Supervisors should expect banks to operate above the minimum regulatory capital ratios.
Supervisors should intervene at an early stage to prevent capital falling below the minimum level required.
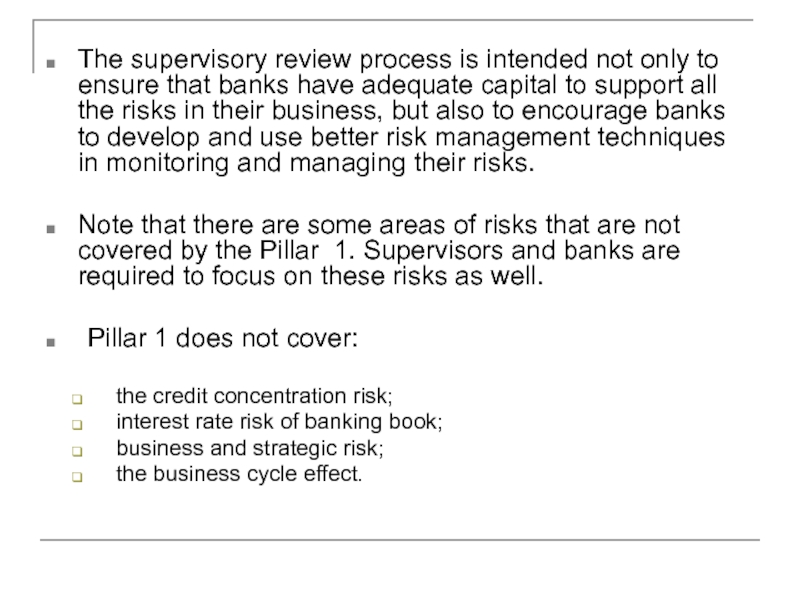
Слайд 37The supervisory review process is intended not only to ensure that
Note that there are some areas of risks that are not covered by the Pillar 1. Supervisors and banks are required to focus on these risks as well.
Pillar 1 does not cover:
the credit concentration risk;
interest rate risk of banking book;
business and strategic risk;
the business cycle effect.
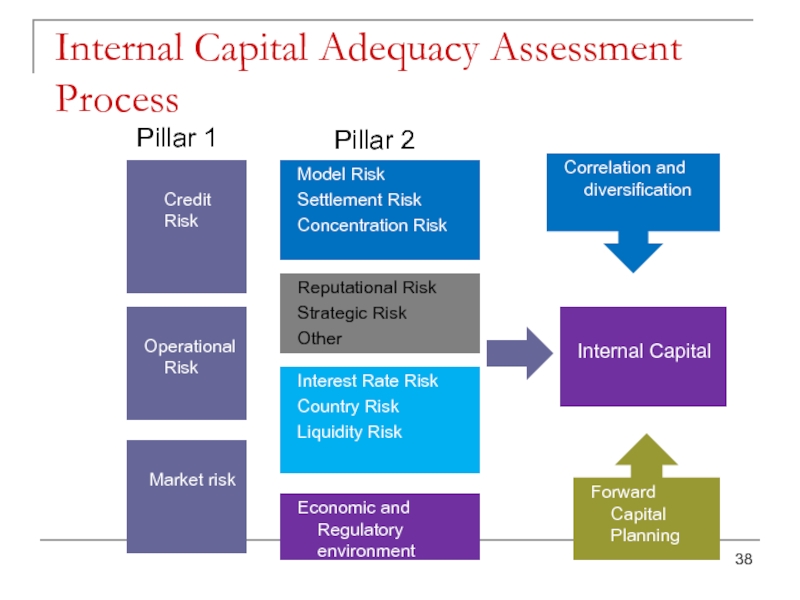
Слайд 38Internal Capital Adequacy Assessment Process
Credit Risk
Operational Risk
Market risk
Pillar
Model Risk
Settlement Risk
Concentration Risk
Interest Rate Risk
Country Risk
Liquidity Risk
Reputational Risk
Strategic Risk
Other
Economic and Regulatory environment
Internal Capital
Forward Capital Planning
Pillar 2
Correlation and diversification
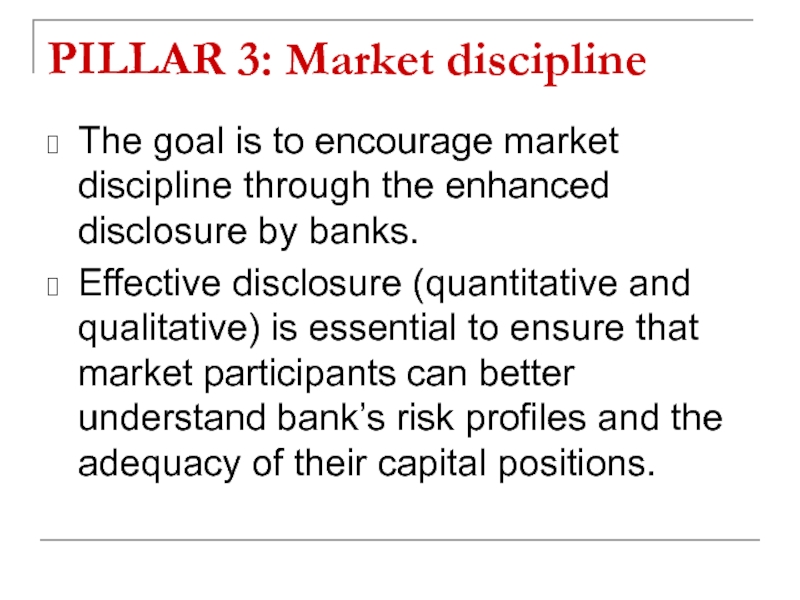
Слайд 39PILLAR 3: Market discipline
The goal is to encourage market discipline
Effective disclosure (quantitative and qualitative) is essential to ensure that market participants can better understand bank’s risk profiles and the adequacy of their capital positions.
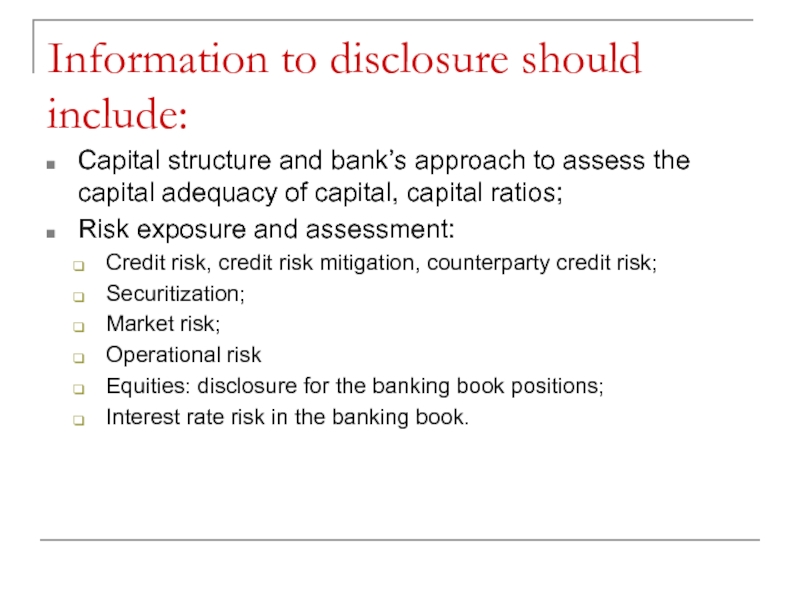
Слайд 40Information to disclosure should include:
Capital structure and bank’s approach to
Risk exposure and assessment:
Credit risk, credit risk mitigation, counterparty credit risk;
Securitization;
Market risk;
Operational risk
Equities: disclosure for the banking book positions;
Interest rate risk in the banking book.
Слайд 41Problems with Basel 2 revealed by the financial crisis 2007
Supervisory capital
It led to the understatement of provisions for loan losses and to overstatement of bank asset values and bank capital (Furlong and Knight, May 24, 2010).
Capital regulation estimated the bank risks under the normal economic conditions and did not consider the cyclicality of the economy.
Systemically important financial institutions were exposed to greater risks due to the interconnectedness of their transactions.
Слайд 42BASEL III
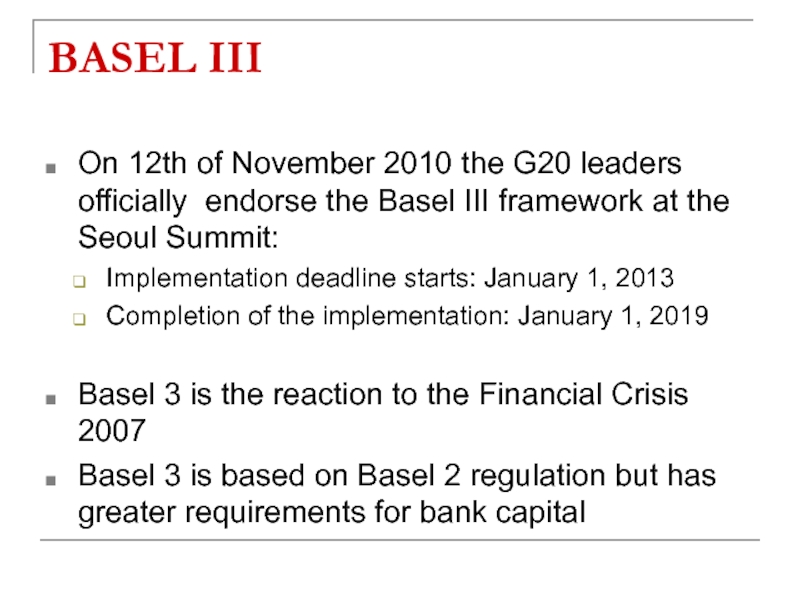
On 12th of November 2010 the G20 leaders officially endorse
Implementation deadline starts: January 1, 2013
Completion of the implementation: January 1, 2019
Basel 3 is the reaction to the Financial Crisis 2007
Basel 3 is based on Basel 2 regulation but has greater requirements for bank capital
Слайд 43A. Comparison of Basel 2 and Basel 3
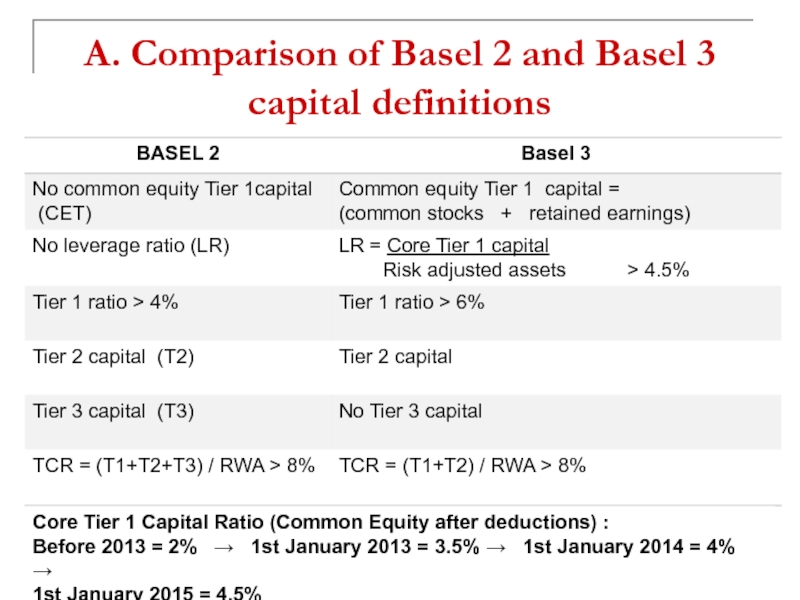
capital definitions
Core Tier
Before 2013 = 2% → 1st January 2013 = 3.5% → 1st January 2014 = 4% →
1st January 2015 = 4.5%
Слайд 44Basel III squeezes capital
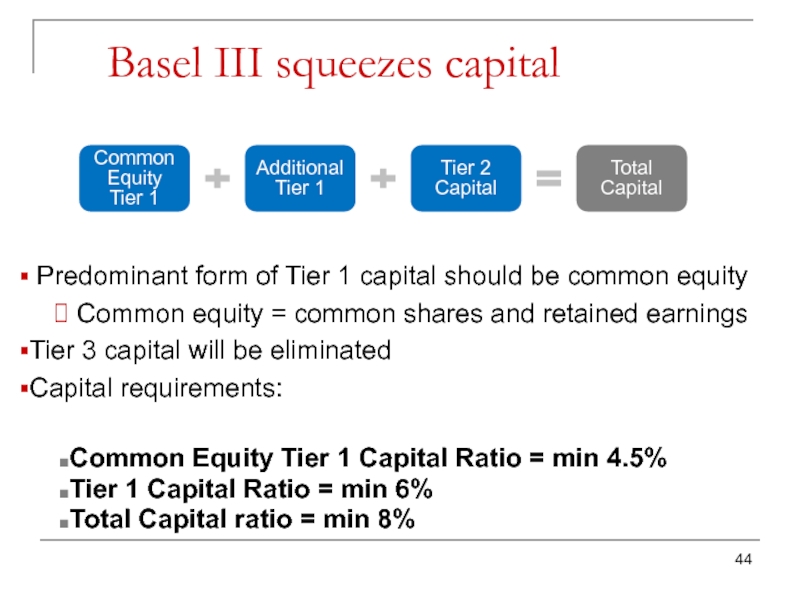
Common Equity Tier 1
Additional Tier 1
Tier 2 Capital
Total
Predominant form of Tier 1 capital should be common equity
Common equity = common shares and retained earnings
Tier 3 capital will be eliminated
Capital requirements:
Common Equity Tier 1 Capital Ratio = min 4.5%
Tier 1 Capital Ratio = min 6%
Total Capital ratio = min 8%
Слайд 45B. Capital Conservation buffer
The purpose of the conservation buffer is to
Capital Conservation Buffer before 2016 = 0%
1st January 2016 = 0.625%, 1st January 2017 = 1.25%,
1st January 2018 = 1.875%, 1st January 2019 = 2.5%
Common Equity Tier 1
Additional Tier 1
Tier 2 Capital
Conservation Buffer
Total Capital
Слайд 46C. Countercyclical capital buffer
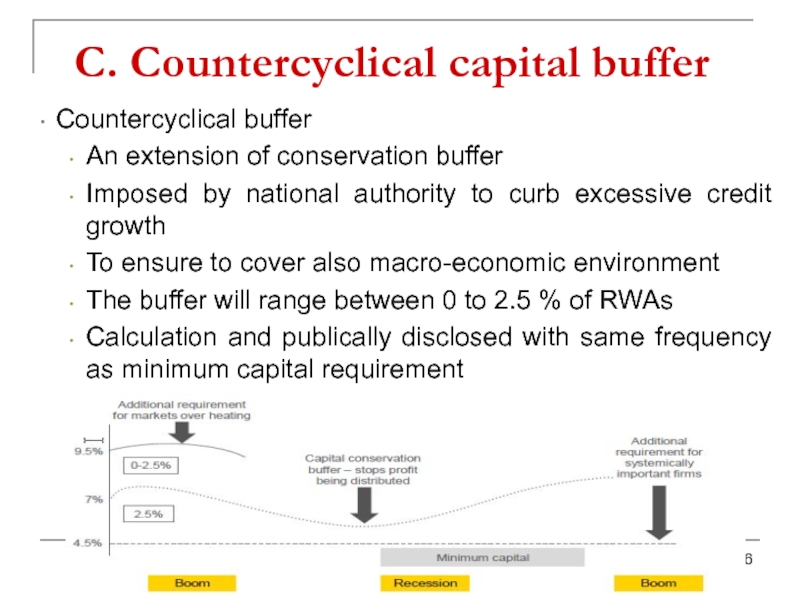
Countercyclical buffer
An extension of conservation buffer
Imposed by national
To ensure to cover also macro-economic environment
The buffer will range between 0 to 2.5 % of RWAs
Calculation and publically disclosed with same frequency as minimum capital requirement
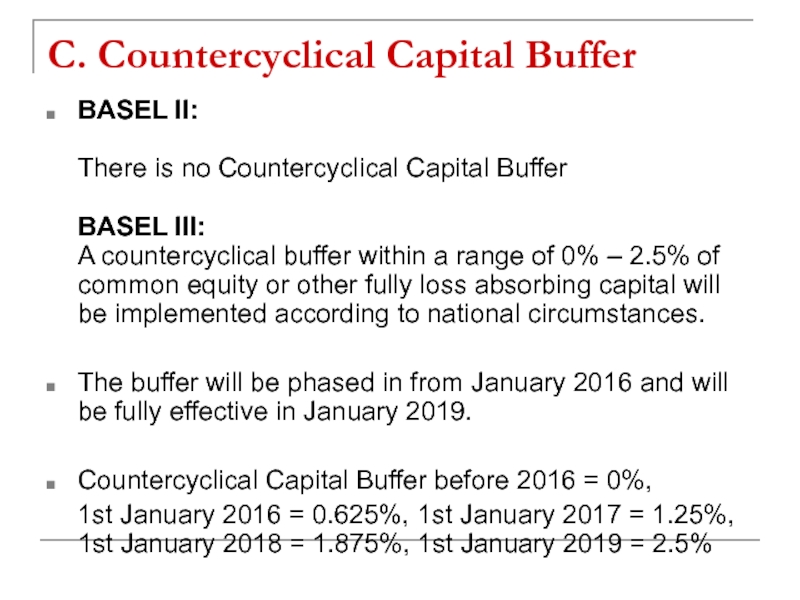
Слайд 47C. Countercyclical Capital Buffer
BASEL II:
There is no Countercyclical Capital Buffer
BASEL
The buffer will be phased in from January 2016 and will be fully effective in January 2019.
Countercyclical Capital Buffer before 2016 = 0%,
1st January 2016 = 0.625%, 1st January 2017 = 1.25%, 1st January 2018 = 1.875%, 1st January 2019 = 2.5%
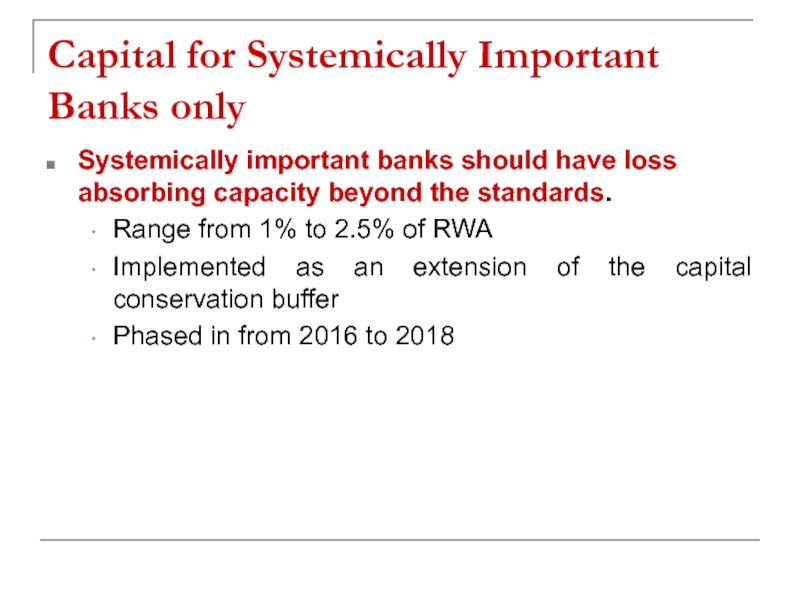
Слайд 48Capital for Systemically Important Banks only
Systemically important banks should have loss
Range from 1% to 2.5% of RWA
Implemented as an extension of the capital conservation buffer
Phased in from 2016 to 2018
