- Главная
- Разное
- Дизайн
- Бизнес и предпринимательство
- Аналитика
- Образование
- Развлечения
- Красота и здоровье
- Финансы
- Государство
- Путешествия
- Спорт
- Недвижимость
- Армия
- Графика
- Культурология
- Еда и кулинария
- Лингвистика
- Английский язык
- Астрономия
- Алгебра
- Биология
- География
- Детские презентации
- Информатика
- История
- Литература
- Маркетинг
- Математика
- Медицина
- Менеджмент
- Музыка
- МХК
- Немецкий язык
- ОБЖ
- Обществознание
- Окружающий мир
- Педагогика
- Русский язык
- Технология
- Физика
- Философия
- Химия
- Шаблоны, картинки для презентаций
- Экология
- Экономика
- Юриспруденция
Banking Industry OverviewSectors, trends, and disruptionsAugust 2015 презентация
Содержание
- 1. Banking Industry OverviewSectors, trends, and disruptionsAugust 2015
- 2. Banking Overview
- 3. S&P 500 Breakdown 19.4 T 7.3 T
- 4. Role of Banks Banks serve an
- 5. Categories of Banks Full-Service Banks Community Banks
- 6. Banking Landscape – Banks by Size Assets
- 7. JP Morgan Chase
- 8. Bank of America
- 9. Citigroup 1997
- 10. Wells Fargo
- 11. Financial Stability Oversight Council (FSCOC) Federal Reserve
- 12. Major Banking Legislation Dodd-Frank Wall
- 13. Drivers of Change in the Banking Industry
- 14. SMB Credit Education Finance Banking Landscape –
- 15. Banking Landscape – Industry Sector Magnitude by
- 16. Banking Landscape – Industry Sector Magnitude by
- 17. Lending Real Estate – Residential Mortgages
- 18. Residential Mortgages Overview Annual Loan Volume Outstanding
- 19. Residential Mortgages – Trends in the Industry
- 20. Lending Education Finance
- 21. Education Financing Overview 83% Outstanding Debt is
- 22. Private Education Financing – Trends in the
- 23. Lending Purchase Finance – Auto Lending
- 24. Auto Loan Overview Industry Size Customer Base
- 25. Auto Loans – Trends in the Industry
- 26. Lending Consumer Credit
- 27. Consumer Credit Overview Industry Size Credit
- 28. Consumer Credit – Trends in the Industry
- 29. Lending SMB Lending
- 30. Small Business Lending Overview Industry Size Customer
- 31. SMB Lending – Trends in the Industry
- 32. Lending Payday
- 33. Industry Size Customer Base The average payday
- 34. Trends Payday Loans – Trends in the
- 35. Venture Financing
- 36. Venture Capital Activity In 2014
- 37. What Sectors are Hot? Source: CB Insights
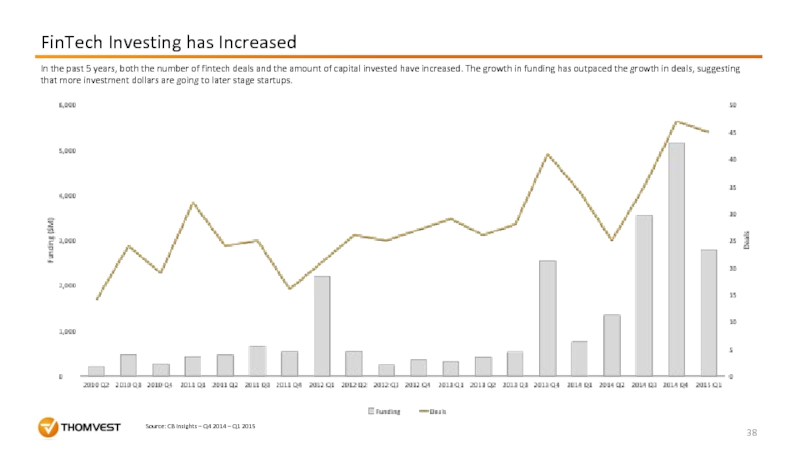
- 38. FinTech Investing has Increased Source: CB Insights
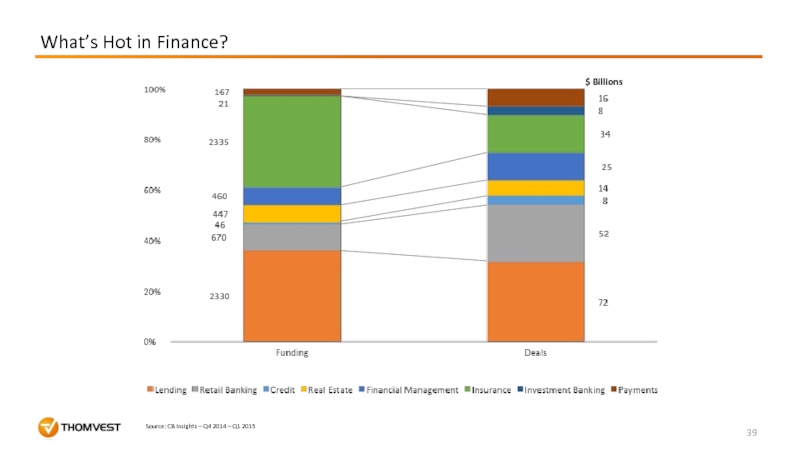
- 39. What’s Hot in Finance? Source: CB Insights – Q4 2014 – Q1 2015 $ Billions
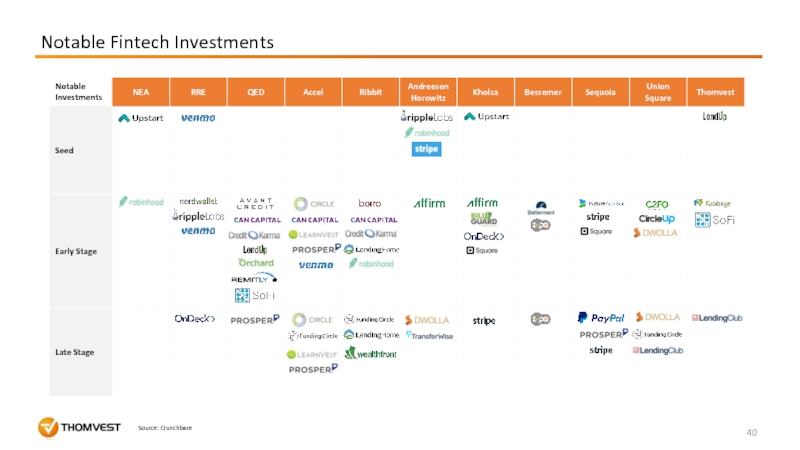
- 40. Notable Fintech Investments Source: Crunchbase
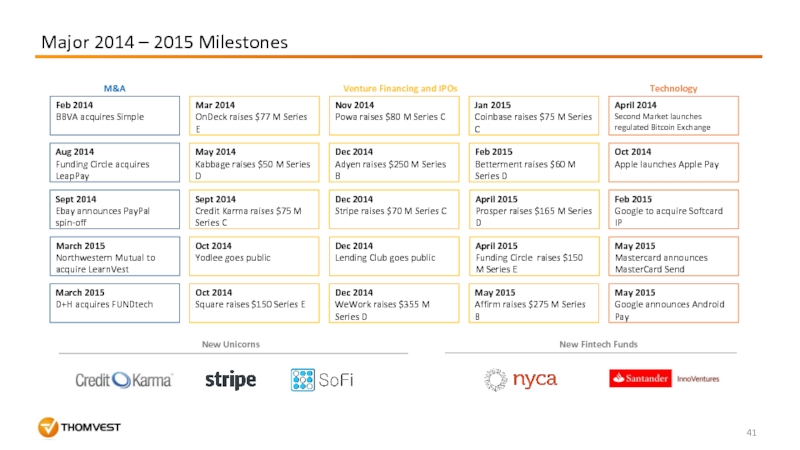
- 41. Major 2014 – 2015 Milestones New Unicorns New Fintech Funds
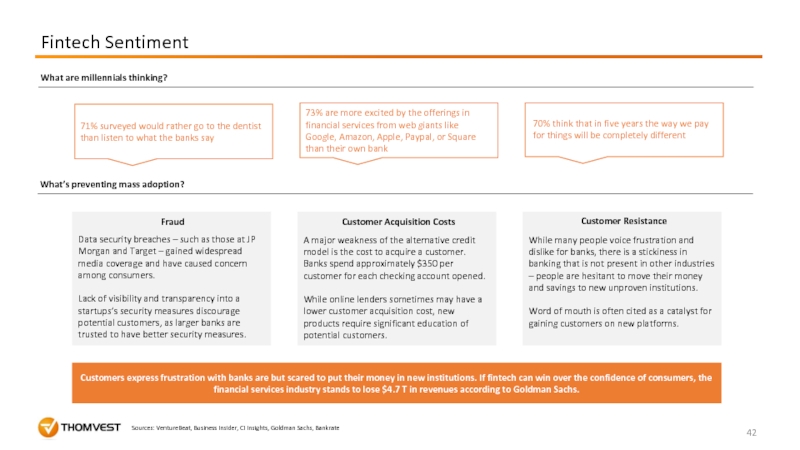
- 42. Fintech Sentiment 70% think that in
- 43. Sources (1/3) "The Top 50 U.S. Banks
- 44. Sources (2/3) “Overview of Recent Developments in
- 45. Sources (3/3) “Trends in Student Aid 2014.”
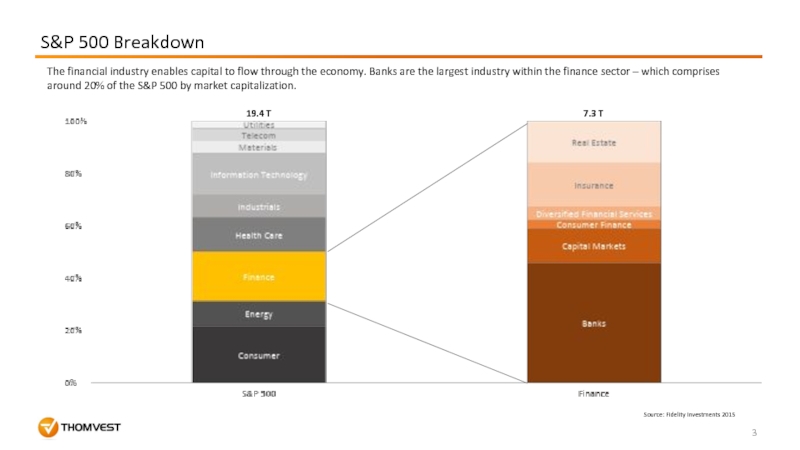
Слайд 3S&P 500 Breakdown
19.4 T
7.3 T
Source: Fidelity Investments 2015
The financial industry enables
Слайд 4
Role of Banks
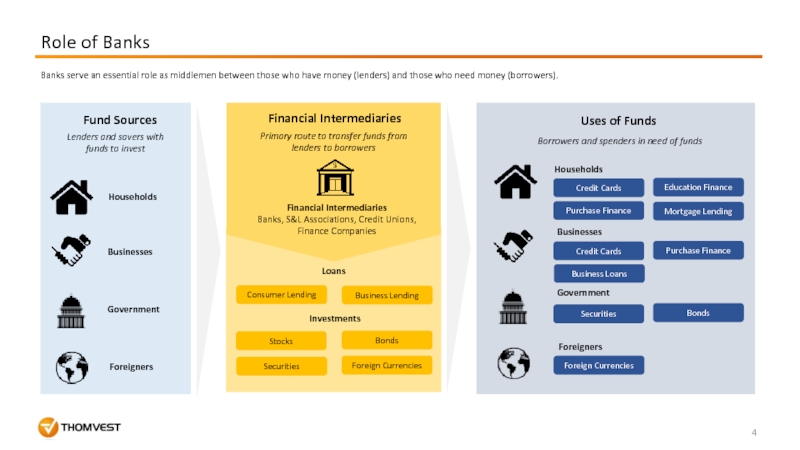
Banks serve an essential role as middlemen between those
Fund Sources
Lenders and savers with funds to invest
Businesses
Households
Government
Foreigners
Uses of Funds
Businesses
Households
Government
Foreigners
Borrowers and spenders in need of funds
Primary route to transfer funds from lenders to borrowers
Financial Intermediaries
Financial Intermediaries
Banks, S&L Associations, Credit Unions, Finance Companies
Loans
Investments
Consumer Lending
Business Lending
Stocks
Bonds
Securities
Foreign Currencies
Credit Cards
Education Finance
Mortgage Lending
Purchase Finance
Foreign Currencies
Bonds
Securities
Credit Cards
Purchase Finance
Business Loans
Слайд 5Categories of Banks
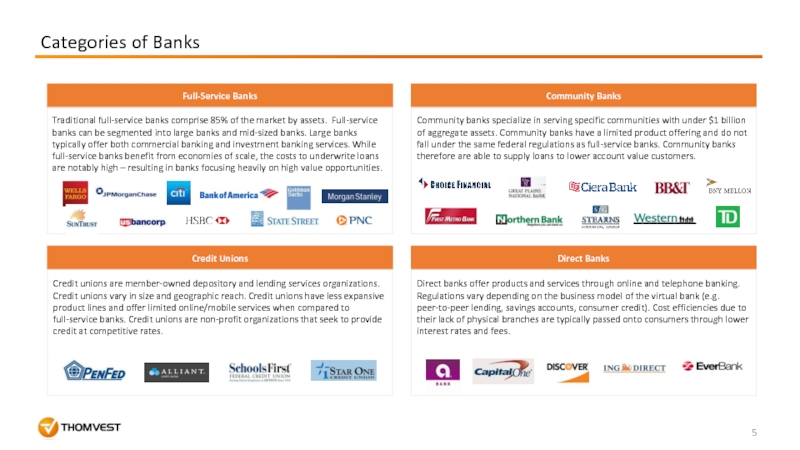
Full-Service Banks
Community Banks
Direct Banks
Community banks specialize in serving specific
Direct banks offer products and services through online and telephone banking. Regulations vary depending on the business model of the virtual bank (e.g. peer-to-peer lending, savings accounts, consumer credit). Cost efficiencies due to their lack of physical branches are typically passed onto consumers through lower interest rates and fees.
Credit Unions
Traditional full-service banks comprise 85% of the market by assets. Full-service banks can be segmented into large banks and mid-sized banks. Large banks typically offer both commercial banking and investment banking services. While full-service banks benefit from economies of scale, the costs to underwrite loans are notably high – resulting in banks focusing heavily on high value opportunities.
Credit unions are member-owned depository and lending services organizations. Credit unions vary in size and geographic reach. Credit unions have less expansive product lines and offer limited online/mobile services when compared to full-service banks. Credit unions are non-profit organizations that seek to provide credit at competitive rates.
Слайд 6Banking Landscape – Banks by Size
Assets ($B)
Deposits ($B)
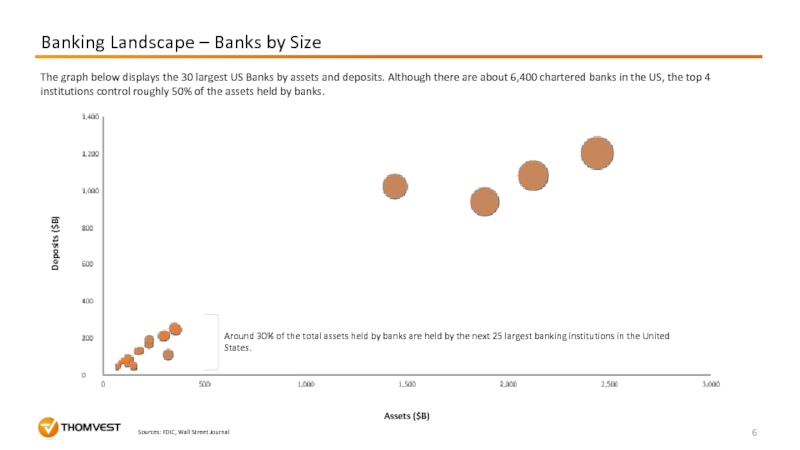
The graph below displays
Around 30% of the total assets held by banks are held by the next 25 largest banking institutions in the United States.
Sources: FDIC, Wall Street Journal
Слайд 7JP Morgan Chase
1991
Manufacturers Hanover Corp. merged with Chemical Banking Corp
1995
First
1996
The Chase Manhattan Corp. merged with Chemical Banking Corp.
1998
Banc One Corp. merged with First Chicago NBD
2000
J.P. Morgan & Co. merged with The Chase Manhattan Corp.
2004
Bank One Corp. merged with J.P. Morgan Chase & Co
2008
JPMorgan Chase & Co. acquired The Bear Stearns Companies Inc.
2008
JPMorgan Chase & Co. acquired the deposits, assets and certain liabilities of Washington Mutual's banking operations
2010
J.P. Morgan acquired full ownership of its U.K. joint venture, J.P. Morgan Cazenove
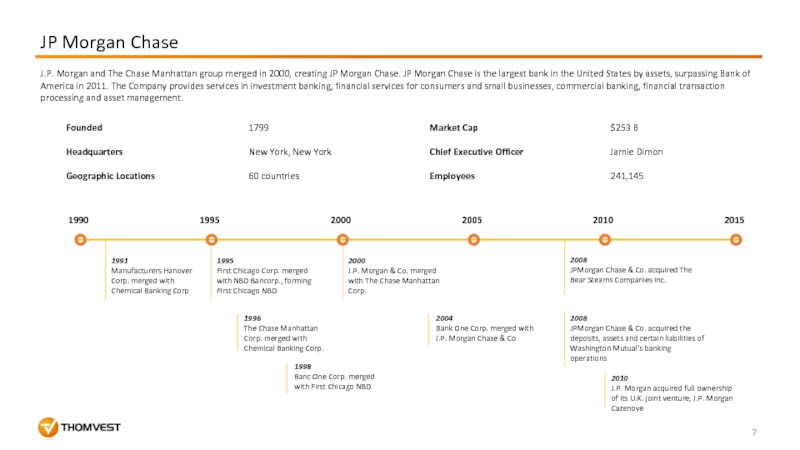
J.P. Morgan and The Chase Manhattan group merged in 2000, creating JP Morgan Chase. JP Morgan Chase is the largest bank in the United States by assets, surpassing Bank of America in 2011. The Company provides services in investment banking, financial services for consumers and small businesses, commercial banking, financial transaction processing and asset management.
Слайд 8Bank of America
1992
BankAmerica acquires Security Pacific Corporation
1994
BankAmerica acquires Continental Illinois
1997
BankAmerica acquires Robertson Stephens
1997
NationsBank purchases BankAmerica; merged bank takes name of Bank of America
2004
Bank of America purchases FleetBoston Financial
2005
Bank of America purchases MBNA
2006
Bank of America acquires The United States Trust Company
2007
Bank of America acquires LaSalle Bank
2008
Bank of America purchases Countrywide Financial
2009
Bank of America purchases Merrill Lynch
2014
Bank of America sells 2 dozen branches to Huntington Bancshares and begins downsizing retail banking branches
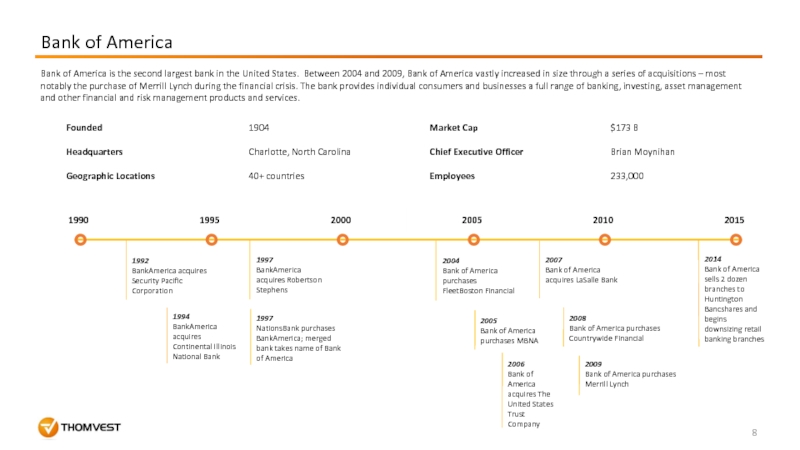
Bank of America is the second largest bank in the United States. Between 2004 and 2009, Bank of America vastly increased in size through a series of acquisitions – most notably the purchase of Merrill Lynch during the financial crisis. The bank provides individual consumers and businesses a full range of banking, investing, asset management and other financial and risk management products and services.
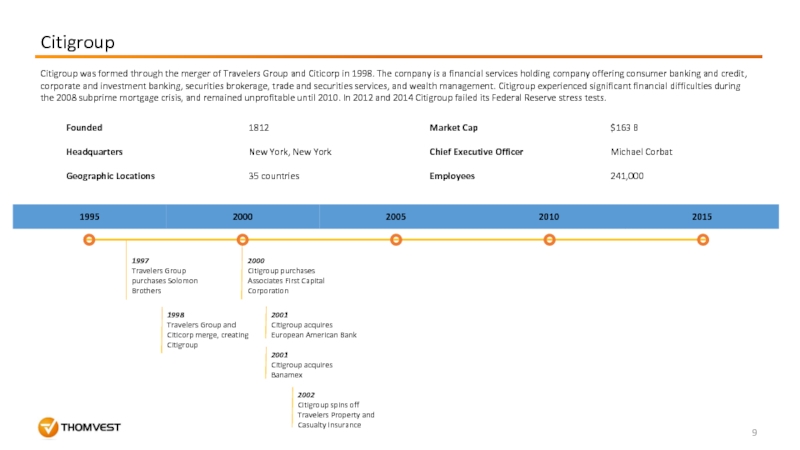
Слайд 9Citigroup
1997
Travelers Group purchases Solomon Brothers
1998
Travelers Group and Citicorp merge, creating
2000
Citigroup purchases Associates First Capital Corporation
2001
Citigroup acquires European American Bank
2001
Citigroup acquires Banamex
2002
Citigroup spins off Travelers Property and Casualty Insurance
Citigroup was formed through the merger of Travelers Group and Citicorp in 1998. The company is a financial services holding company offering consumer banking and credit, corporate and investment banking, securities brokerage, trade and securities services, and wealth management. Citigroup experienced significant financial difficulties during the 2008 subprime mortgage crisis, and remained unprofitable until 2010. In 2012 and 2014 Citigroup failed its Federal Reserve stress tests.
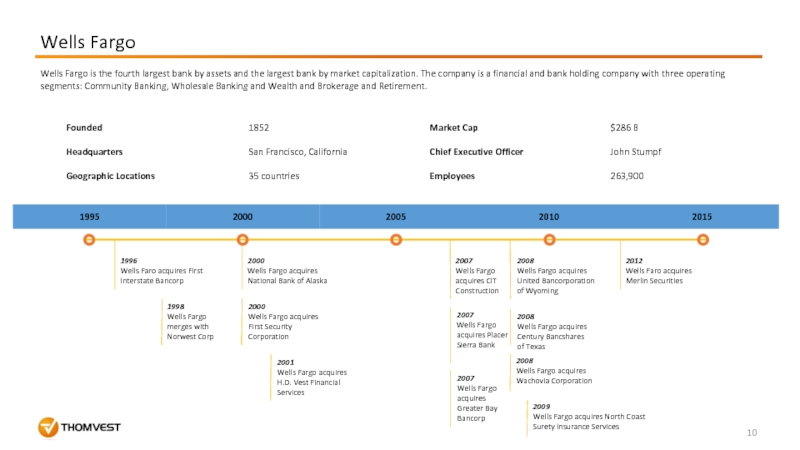
Слайд 10Wells Fargo
1996
Wells Faro acquires First Interstate Bancorp
1998
Wells Fargo merges with
2000
Wells Fargo acquires National Bank of Alaska
2000
Wells Fargo acquires First Security Corporation
2001
Wells Fargo acquires H.D. Vest Financial Services
2007
Wells Fargo acquires CIT Construction
2007
Wells Fargo acquires Placer Sierra Bank
2007
Wells Fargo acquires Greater Bay Bancorp
2008
Wells Fargo acquires United Bancorporation of Wyoming
2008
Wells Fargo acquires Century Bancshares of Texas
2008
Wells Fargo acquires Wachovia Corporation
2009
Wells Fargo acquires North Coast Surety Insurance Services
2012
Wells Faro acquires Merlin Securities
Wells Fargo is the fourth largest bank by assets and the largest bank by market capitalization. The company is a financial and bank holding company with three operating segments: Community Banking, Wholesale Banking and Wealth and Brokerage and Retirement.
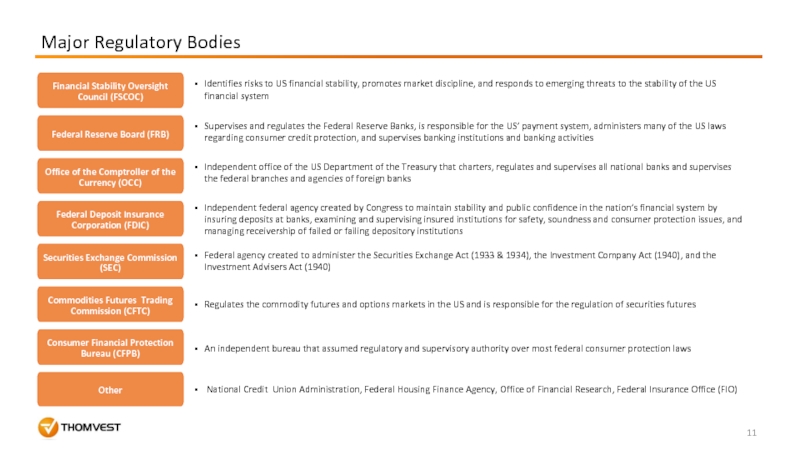
Слайд 11Financial Stability Oversight Council (FSCOC)
Federal Reserve Board (FRB)
Office of the Comptroller
Federal Deposit Insurance Corporation (FDIC)
Securities Exchange Commission (SEC)
Commodities Futures Trading Commission (CFTC)
Consumer Financial Protection Bureau (CFPB)
Other
Supervises and regulates the Federal Reserve Banks, is responsible for the US’ payment system, administers many of the US laws regarding consumer credit protection, and supervises banking institutions and banking activities
Major Regulatory Bodies
Identifies risks to US financial stability, promotes market discipline, and responds to emerging threats to the stability of the US financial system
Independent office of the US Department of the Treasury that charters, regulates and supervises all national banks and supervises the federal branches and agencies of foreign banks
Independent federal agency created by Congress to maintain stability and public confidence in the nation’s financial system by insuring deposits at banks, examining and supervising insured institutions for safety, soundness and consumer protection issues, and managing receivership of failed or failing depository institutions
Federal agency created to administer the Securities Exchange Act (1933 & 1934), the Investment Company Act (1940), and the Investment Advisers Act (1940)
Regulates the commodity futures and options markets in the US and is responsible for the regulation of securities futures
An independent bureau that assumed regulatory and supervisory authority over most federal consumer protection laws
National Credit Union Administration, Federal Housing Finance Agency, Office of Financial Research, Federal Insurance Office (FIO)
Слайд 12
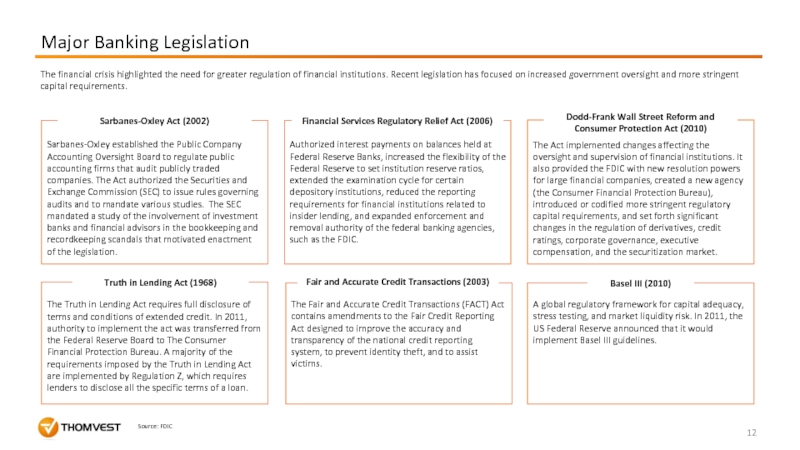
Major Banking Legislation
Dodd-Frank Wall Street Reform and Consumer Protection Act (2010)
The
Sarbanes-Oxley Act (2002)
Sarbanes-Oxley established the Public Company Accounting Oversight Board to regulate public accounting firms that audit publicly traded companies. The Act authorized the Securities and Exchange Commission (SEC) to issue rules governing audits and to mandate various studies. The SEC mandated a study of the involvement of investment banks and financial advisors in the bookkeeping and recordkeeping scandals that motivated enactment of the legislation.
Financial Services Regulatory Relief Act (2006)
Authorized interest payments on balances held at Federal Reserve Banks, increased the flexibility of the Federal Reserve to set institution reserve ratios, extended the examination cycle for certain depository institutions, reduced the reporting requirements for financial institutions related to insider lending, and expanded enforcement and removal authority of the federal banking agencies, such as the FDIC.
Fair and Accurate Credit Transactions (2003)
The Fair and Accurate Credit Transactions (FACT) Act contains amendments to the Fair Credit Reporting Act designed to improve the accuracy and transparency of the national credit reporting system, to prevent identity theft, and to assist victims.
Truth in Lending Act (1968)
The Truth in Lending Act requires full disclosure of terms and conditions of extended credit. In 2011, authority to implement the act was transferred from the Federal Reserve Board to The Consumer Financial Protection Bureau. A majority of the requirements imposed by the Truth in Lending Act are implemented by Regulation Z, which requires lenders to disclose all the specific terms of a loan.
Basel III (2010)
A global regulatory framework for capital adequacy, stress testing, and market liquidity risk. In 2011, the US Federal Reserve announced that it would implement Basel III guidelines.
The financial crisis highlighted the need for greater regulation of financial institutions. Recent legislation has focused on increased government oversight and more stringent capital requirements.
Source: FDIC
Слайд 13Drivers of Change in the Banking Industry
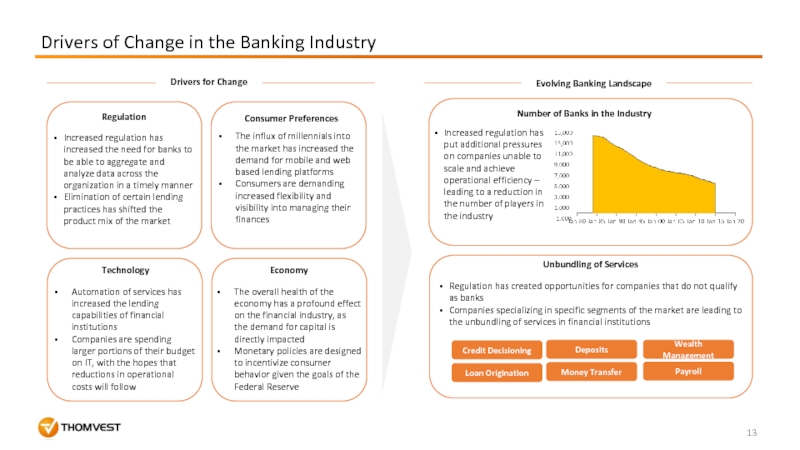
Regulation
Consumer Preferences
Technology
Economy
Automation of services has
Companies are spending larger portions of their budget on IT, with the hopes that reductions in operational costs will follow
The overall health of the economy has a profound effect on the financial industry, as the demand for capital is directly impacted
Monetary policies are designed to incentivize consumer behavior given the goals of the Federal Reserve
Increased regulation has increased the need for banks to be able to aggregate and analyze data across the organization in a timely manner
Elimination of certain lending practices has shifted the product mix of the market
The influx of millennials into the market has increased the demand for mobile and web based lending platforms
Consumers are demanding increased flexibility and visibility into managing their finances
Drivers for Change
Evolving Banking Landscape
Number of Banks in the Industry
Unbundling of Services
Increased regulation has put additional pressures on companies unable to scale and achieve operational efficiency – leading to a reduction in the number of players in the industry
Regulation has created opportunities for companies that do not qualify as banks
Companies specializing in specific segments of the market are leading to the unbundling of services in financial institutions
Deposits
Money Transfer
Wealth Management
Payroll
Credit Decisioning
Loan Origination
Слайд 14SMB Credit
Education Finance
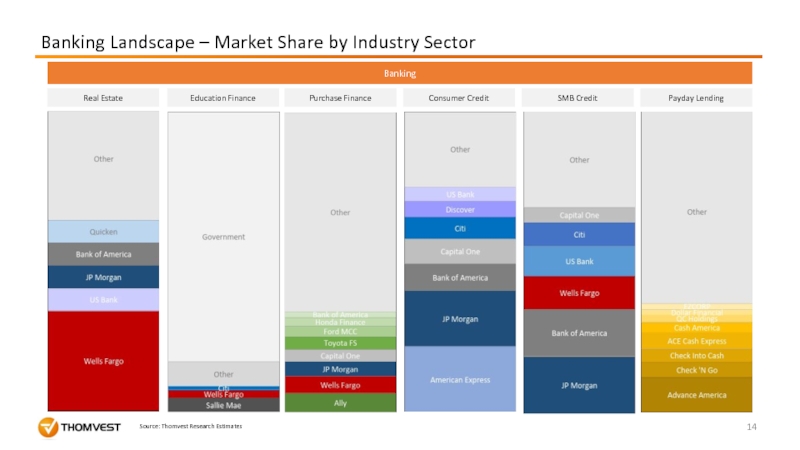
Banking Landscape – Market Share by Industry Sector
Consumer Credit
Real
Purchase Finance
Payday Lending
Banking
Source: Thomvest Research Estimates
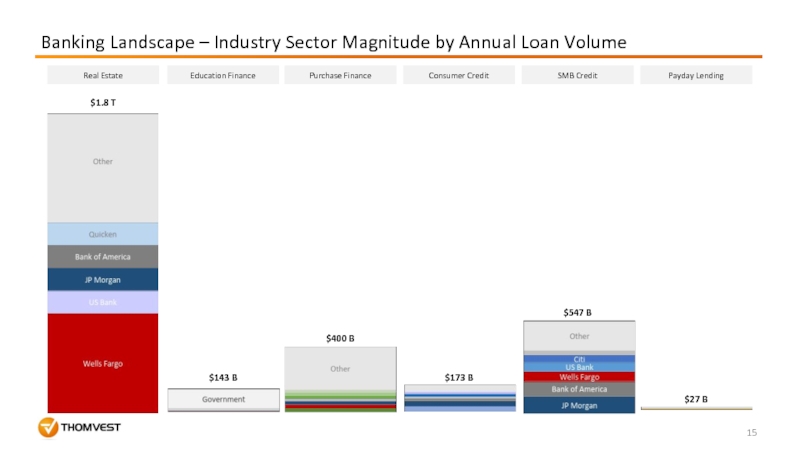
Слайд 15Banking Landscape – Industry Sector Magnitude by Annual Loan Volume
SMB Credit
Education
Consumer Credit
Real Estate
Purchase Finance
Payday Lending
$1.8 T
$143 B
$400 B
$173 B
$547 B
$27 B
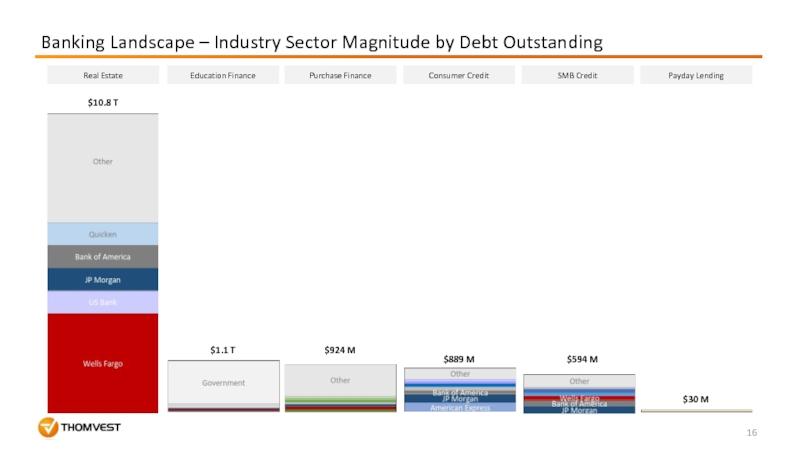
Слайд 16Banking Landscape – Industry Sector Magnitude by Debt Outstanding
SMB Credit
Education Finance
Consumer
Real Estate
Purchase Finance
Payday Lending
$10.8 T
$1.1 T
$924 M
$889 M
$594 M
$30 M
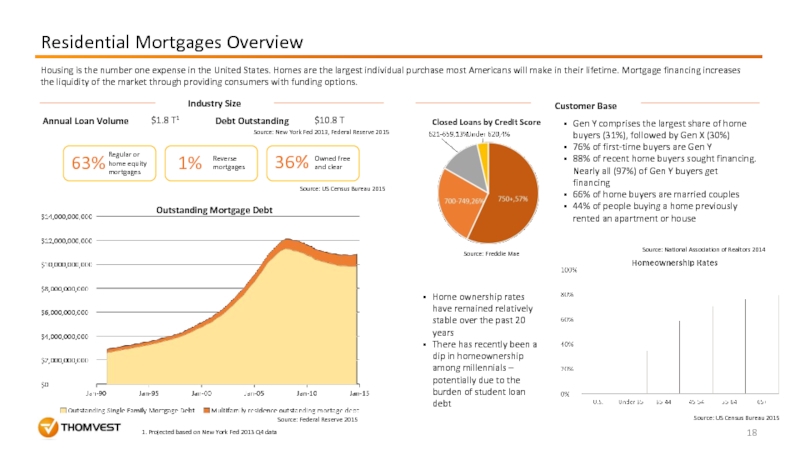
Слайд 18Residential Mortgages Overview
Annual Loan Volume
Outstanding Mortgage Debt
Debt Outstanding
$10.8 T
63%
Regular or home
Reverse mortgages
1%
36%
Owned free and clear
Customer Base
Closed Loans by Credit Score
Home ownership rates have remained relatively stable over the past 20 years
There has recently been a dip in homeownership among millennials – potentially due to the burden of student loan debt
Gen Y comprises the largest share of home buyers (31%), followed by Gen X (30%)
76% of first-time buyers are Gen Y
88% of recent home buyers sought financing. Nearly all (97%) of Gen Y buyers get financing
66% of home buyers are married couples
44% of people buying a home previously rented an apartment or house
Source: US Census Bureau 2015
Source: Freddie Mae
Source: National Association of Realtors 2014
Source: US Census Bureau 2015
Source: Federal Reserve 2015
$1.8 T1
1. Projected based on New York Fed 2013 Q4 data
Source: New York Fed 2013, Federal Reserve 2015
Industry Size
Housing is the number one expense in the United States. Homes are the largest individual purchase most Americans will make in their lifetime. Mortgage financing increases the liquidity of the market through providing consumers with funding options.
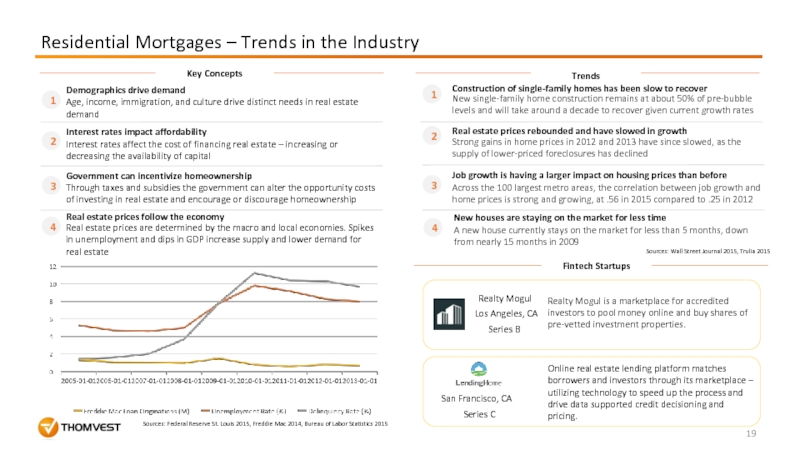
Слайд 19Residential Mortgages – Trends in the Industry
1
2
3
4
Fintech Startups
1
2
3
4
Demographics drive demand
Interest rates
Government can incentivize homeownership
Real estate prices follow the economy
Age, income, immigration, and culture drive distinct needs in real estate demand
Interest rates affect the cost of financing real estate – increasing or decreasing the availability of capital
Through taxes and subsidies the government can alter the opportunity costs of investing in real estate and encourage or discourage homeownership
Real estate prices are determined by the macro and local economies. Spikes in unemployment and dips in GDP increase supply and lower demand for real estate
Job growth is having a larger impact on housing prices than before
Real estate prices rebounded and have slowed in growth
Construction of single-family homes has been slow to recover
New houses are staying on the market for less time
Across the 100 largest metro areas, the correlation between job growth and home prices is strong and growing, at .56 in 2015 compared to .25 in 2012
New single-family home construction remains at about 50% of pre-bubble levels and will take around a decade to recover given current growth rates
Strong gains in home prices in 2012 and 2013 have since slowed, as the supply of lower-priced foreclosures has declined
A new house currently stays on the market for less than 5 months, down from nearly 15 months in 2009
San Francisco, CA
Series C
Online real estate lending platform matches borrowers and investors through its marketplace – utilizing technology to speed up the process and drive data supported credit decisioning and pricing.
Sources: Federal Reserve St. Louis 2015, Freddie Mac 2014, Bureau of Labor Statistics 2015
Sources: Wall Street Journal 2015, Trulia 2015
Trends
Key Concepts
Realty Mogul is a marketplace for accredited investors to pool money online and buy shares of pre-vetted investment properties.
Los Angeles, CA
Series B
Realty Mogul
Слайд 21Education Financing Overview
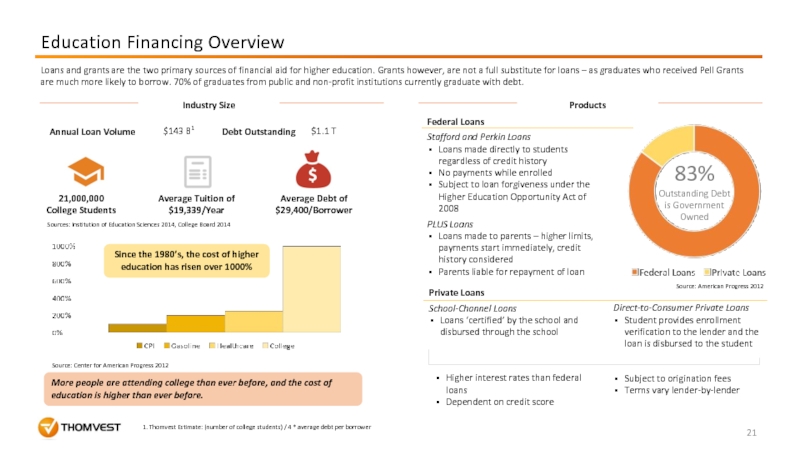
83%
Outstanding Debt is Government Owned
More people are attending college
21,000,000
College Students
Average Tuition of $19,339/Year
Average Debt of $29,400/Borrower
Federal Loans
Stafford and Perkin Loans
Loans made directly to students regardless of credit history
No payments while enrolled
Subject to loan forgiveness under the Higher Education Opportunity Act of 2008
PLUS Loans
Loans made to parents – higher limits, payments start immediately, credit history considered
Parents liable for repayment of loan
Private Loans
School-Channel Loans
Loans ‘certified’ by the school and disbursed through the school
Direct-to-Consumer Private Loans
Student provides enrollment verification to the lender and the loan is disbursed to the student
Higher interest rates than federal loans
Dependent on credit score
Subject to origination fees
Terms vary lender-by-lender
Loans and grants are the two primary sources of financial aid for higher education. Grants however, are not a full substitute for loans – as graduates who received Pell Grants are much more likely to borrow. 70% of graduates from public and non-profit institutions currently graduate with debt.
Industry Size
Annual Loan Volume
Debt Outstanding
Sources: Institution of Education Sciences 2014, College Board 2014
Source: Center for American Progress 2012
Source: American Progress 2012
$1.1 T
$143 B1
1. Thomvest Estimate: (number of college students) / 4 * average debt per borrower
Industry Size
Products
Слайд 22Private Education Financing – Trends in the Industry
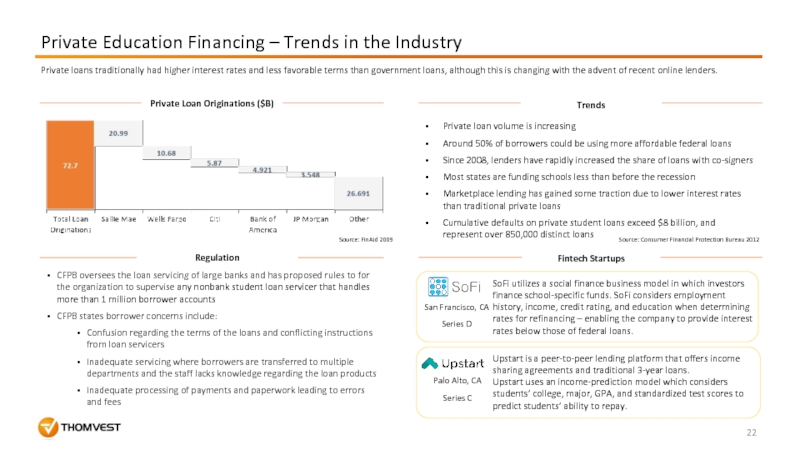
Private Loan Originations ($B)
Trends
Fintech
Private loan volume is increasing
Around 50% of borrowers could be using more affordable federal loans
Since 2008, lenders have rapidly increased the share of loans with co-signers
Most states are funding schools less than before the recession
Marketplace lending has gained some traction due to lower interest rates than traditional private loans
Cumulative defaults on private student loans exceed $8 billion, and represent over 850,000 distinct loans
SoFi utilizes a social finance business model in which investors finance school-specific funds. SoFi considers employment history, income, credit rating, and education when determining rates for refinancing – enabling the company to provide interest rates below those of federal loans.
Upstart is a peer-to-peer lending platform that offers income sharing agreements and traditional 3-year loans.
Upstart uses an income-prediction model which considers students’ college, major, GPA, and standardized test scores to predict students’ ability to repay.
Regulation
CFPB oversees the loan servicing of large banks and has proposed rules to for the organization to supervise any nonbank student loan servicer that handles more than 1 million borrower accounts
CFPB states borrower concerns include:
Confusion regarding the terms of the loans and conflicting instructions from loan servicers
Inadequate servicing where borrowers are transferred to multiple departments and the staff lacks knowledge regarding the loan products
Inadequate processing of payments and paperwork leading to errors and fees
San Francisco, CA
Series D
Palo Alto, CA
Series C
Private loans traditionally had higher interest rates and less favorable terms than government loans, although this is changing with the advent of recent online lenders.
Source: Consumer Financial Protection Bureau 2012
Source: FinAid 2009
Слайд 24Auto Loan Overview
Industry Size
Customer Base
$924 B
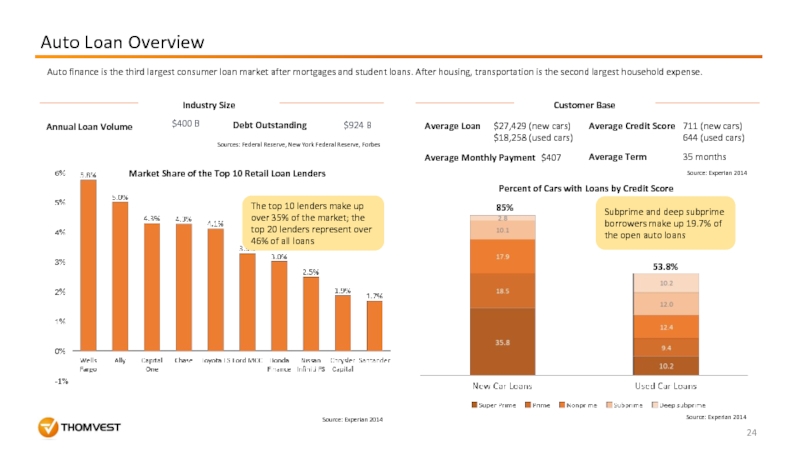
The top 10 lenders make up
Market Share of the Top 10 Retail Loan Lenders
$400 B
Source: Experian 2014
Sources: Federal Reserve, New York Federal Reserve, Forbes
Annual Loan Volume
Debt Outstanding
Average Monthly Payment
85%
53.8%
Percent of Cars with Loans by Credit Score
Subprime and deep subprime borrowers make up 19.7% of the open auto loans
Average Credit Score
711 (new cars)
644 (used cars)
$407
Average Loan
$27,429 (new cars)
$18,258 (used cars)
Average Term
35 months
Source: Experian 2014
Source: Experian 2014
Auto finance is the third largest consumer loan market after mortgages and student loans. After housing, transportation is the second largest household expense.
Слайд 25Auto Loans – Trends in the Industry
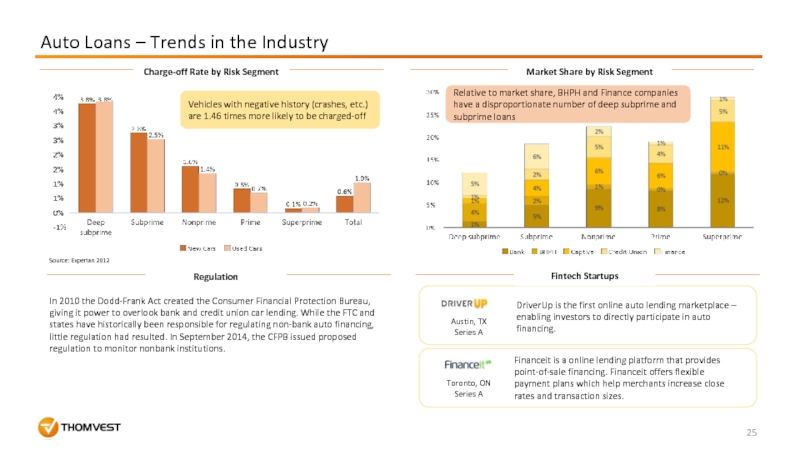
Charge-off Rate by Risk Segment
Vehicles
Source: Experian 2012
Relative to market share, BHPH and Finance companies have a disproportionate number of deep subprime and subprime loans
Market Share by Risk Segment
Regulation
Toronto, ON
Series A
Austin, TX
Series A
DriverUp is the first online auto lending marketplace – enabling investors to directly participate in auto financing.
Financeit is a online lending platform that provides point-of-sale financing. Financeit offers flexible payment plans which help merchants increase close rates and transaction sizes.
Fintech Startups
In 2010 the Dodd-Frank Act created the Consumer Financial Protection Bureau, giving it power to overlook bank and credit union car lending. While the FTC and states have historically been responsible for regulating non-bank auto financing, little regulation had resulted. In September 2014, the CFPB issued proposed regulation to monitor nonbank institutions.
Слайд 27
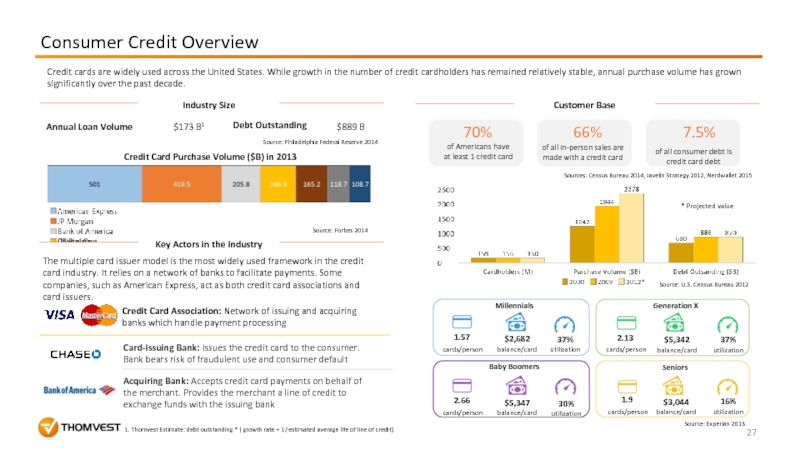
Consumer Credit Overview
Industry Size
Credit cards are widely used across the United
Card-Issuing Bank: Issues the credit card to the consumer. Bank bears risk of fraudulent use and consumer default
Acquiring Bank: Accepts credit card payments on behalf of the merchant. Provides the merchant a line of credit to exchange funds with the issuing bank
Credit Card Association: Network of issuing and acquiring banks which handle payment processing
Credit Card Purchase Volume ($B) in 2013
$889 B
of Americans have at least 1 credit card
70%
Millennials
Generation X
Baby Boomers
Seniors
1.57
cards/person
$2,682 balance/card
37%
utilization
66%
of all in-person sales are made with a credit card
7.5%
of all consumer debt is credit card debt
2.66
cards/person
$5,347 balance/card
30%
utilization
1.9
cards/person
$3,044 balance/card
16%
utilization
2.13
cards/person
$5,342
balance/card
37%
utilization
Source: Experian 2013
Source: Forbes 2014
Source: U.S. Census Bureau 2012
Sources: Census Bureau 2014, Javelin Strategy 2012, Nerdwallet 2015
1. Thomvest Estimate: debt outstanding * ( growth rate + 1/ estimated average life of line of credit)
$173 B1
* Projected value
Annual Loan Volume
Debt Outstanding
Source: Philadelphia Federal Reserve 2014
Key Actors in the Industry
The multiple card issuer model is the most widely used framework in the credit card industry. It relies on a network of banks to facilitate payments. Some companies, such as American Express, act as both credit card associations and card issuers.
Customer Base
Слайд 28Consumer Credit – Trends in the Industry
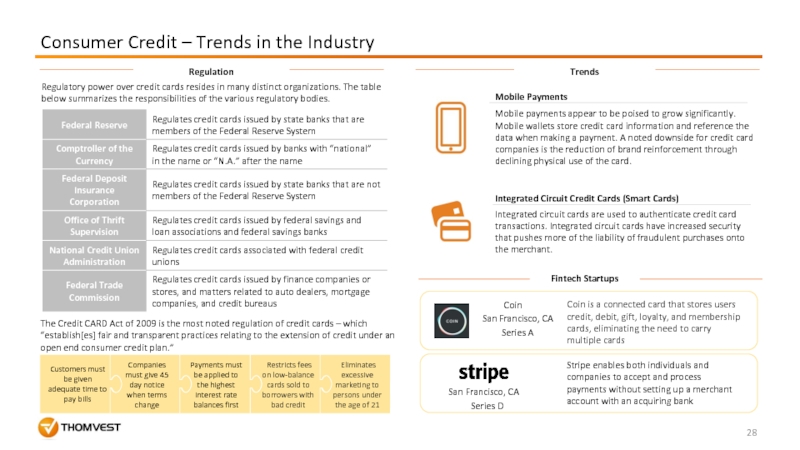
Regulatory power over credit cards
The Credit CARD Act of 2009 is the most noted regulation of credit cards – which “establish[es] fair and transparent practices relating to the extension of credit under an open end consumer credit plan.”
Customers must be given adequate time to pay bills
Companies must give 45 day notice when terms change
Payments must be applied to the highest interest rate balances first
Restricts fees on low-balance cards sold to borrowers with bad credit
Eliminates excessive marketing to persons under the age of 21
Mobile Payments
Integrated Circuit Credit Cards (Smart Cards)
Mobile payments appear to be poised to grow significantly. Mobile wallets store credit card information and reference the data when making a payment. A noted downside for credit card companies is the reduction of brand reinforcement through declining physical use of the card.
Integrated circuit cards are used to authenticate credit card transactions. Integrated circuit cards have increased security that pushes more of the liability of fraudulent purchases onto the merchant.
Fintech Startups
Coin
San Francisco, CA
Series A
Coin is a connected card that stores users credit, debit, gift, loyalty, and membership cards, eliminating the need to carry multiple cards
San Francisco, CA
Series D
Stripe enables both individuals and companies to accept and process payments without setting up a merchant account with an acquiring bank
Regulation
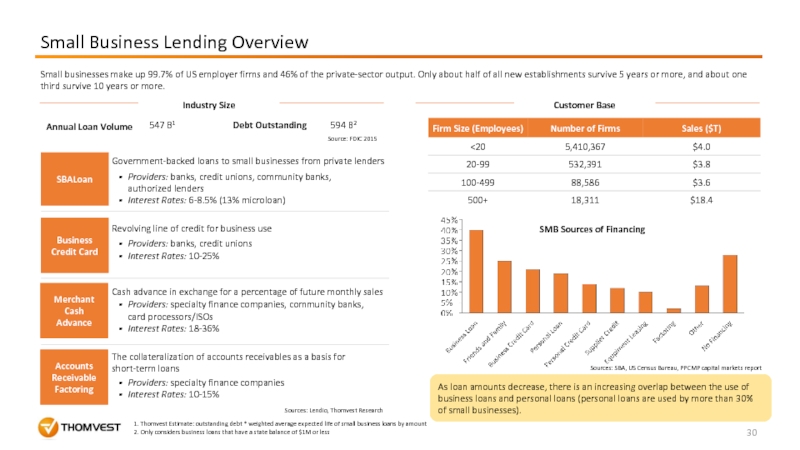
Trends
Слайд 30Small Business Lending Overview
Industry Size
Customer Base
Annual Loan Volume
Debt Outstanding
SBALoan
Business Credit Card
Merchant
Government-backed loans to small businesses from private lenders
Revolving line of credit for business use
Cash advance in exchange for a percentage of future monthly sales
Providers: banks, credit unions, community banks, authorized lenders
Interest Rates: 6-8.5% (13% microloan)
Providers: banks, credit unions
Interest Rates: 10-25%
Providers: specialty finance companies, community banks, card processors/ISOs
Interest Rates: 18-36%
Sources: Lendio, Thomvest Research
Accounts Receivable Factoring
The collateralization of accounts receivables as a basis for short-term loans
Providers: specialty finance companies
Interest Rates: 10-15%
1. Thomvest Estimate: outstanding debt * weighted average expected life of small business loans by amount
2. Only considers business loans that have a state balance of $1M or less
594 B2
Source: FDIC 2015
547 B1
As loan amounts decrease, there is an increasing overlap between the use of business loans and personal loans (personal loans are used by more than 30% of small businesses).
SMB Sources of Financing
Sources: SBA, US Census Bureau, PPCMP capital markets report
Small businesses make up 99.7% of US employer firms and 46% of the private-sector output. Only about half of all new establishments survive 5 years or more, and about one third survive 10 years or more.
Слайд 31SMB Lending – Trends in the Industry
Regulation
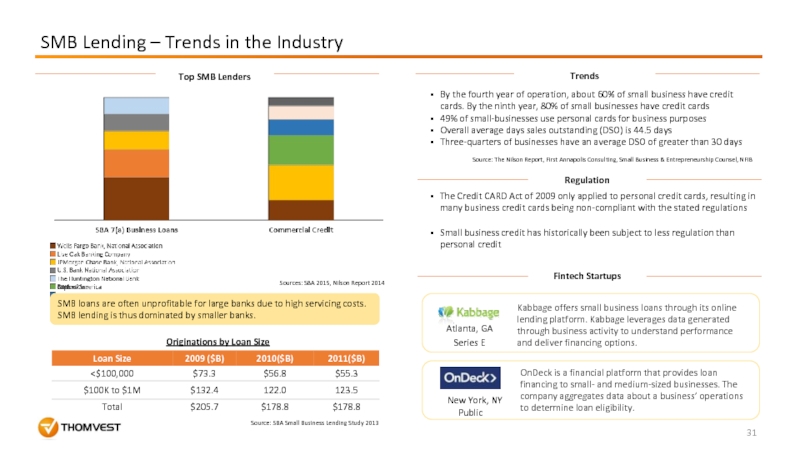
SMB loans are often unprofitable
Originations by Loan Size
Fintech Startups
The Credit CARD Act of 2009 only applied to personal credit cards, resulting in many business credit cards being non-compliant with the stated regulations
Small business credit has historically been subject to less regulation than personal credit
Atlanta, GA
Series E
Kabbage offers small business loans through its online lending platform. Kabbage leverages data generated through business activity to understand performance and deliver financing options.
OnDeck is a financial platform that provides loan financing to small- and medium-sized businesses. The company aggregates data about a business’ operations to determine loan eligibility.
New York, NY
Public
Source: SBA Small Business Lending Study 2013
Sources: SBA 2015, Nilson Report 2014
By the fourth year of operation, about 60% of small business have credit cards. By the ninth year, 80% of small businesses have credit cards
49% of small-businesses use personal cards for business purposes
Overall average days sales outstanding (DSO) is 44.5 days
Three-quarters of businesses have an average DSO of greater than 30 days
Source: The Nilson Report, First Annapolis Consulting, Small Business & Entrepreneurship Counsel, NFIB
Top SMB Lenders
Trends
Слайд 33Industry Size
Customer Base
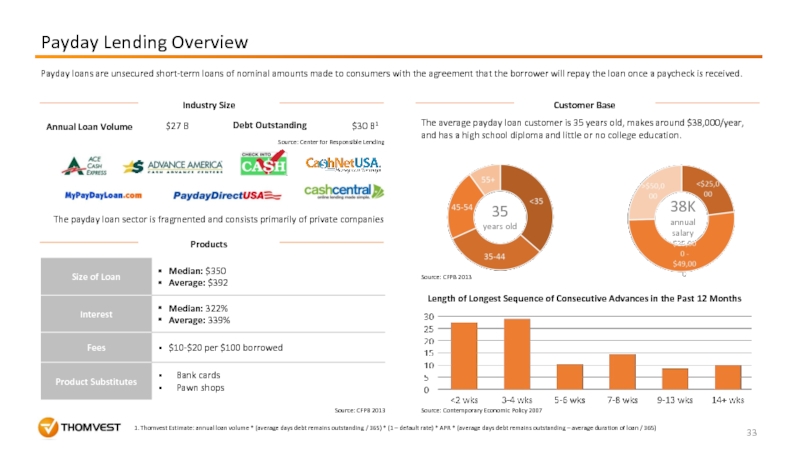
The average payday loan customer is 35 years old,
38K
annual salary
35 years old
Length of Longest Sequence of Consecutive Advances in the Past 12 Months
Source: CFPB 2013
Source: Contemporary Economic Policy 2007
Payday Lending Overview
1. Thomvest Estimate: annual loan volume * (average days debt remains outstanding / 365) * (1 – default rate) * APR * (average days debt remains outstanding – average duration of loan / 365)
Annual Loan Volume
$27 B
The payday loan sector is fragmented and consists primarily of private companies
Debt Outstanding
Source: CFPB 2013
$30 B1
Source: Center for Responsible Lending
Products
Payday loans are unsecured short-term loans of nominal amounts made to consumers with the agreement that the borrower will repay the loan once a paycheck is received.
Слайд 34Trends
Payday Loans – Trends in the Industry
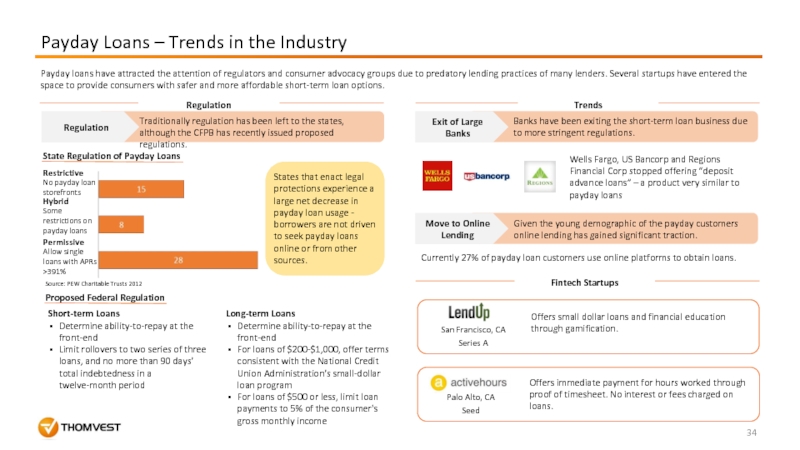
Payday loans have attracted the
Regulation
Regulation
Traditionally regulation has been left to the states, although the CFPB has recently issued proposed regulations.
No payday loan storefronts
Restrictive
Hybrid
Some restrictions on payday loans
Permissive
Allow single loans with APRs >391%
State Regulation of Payday Loans
States that enact legal protections experience a large net decrease in payday loan usage - borrowers are not driven to seek payday loans online or from other sources.
Proposed Federal Regulation
Exit of Large Banks
Short-term Loans
Determine ability-to-repay at the front-end
Limit rollovers to two series of three loans, and no more than 90 days' total indebtedness in a twelve-month period
Long-term Loans
Determine ability-to-repay at the front-end
For loans of $200-$1,000, offer terms consistent with the National Credit Union Administration's small-dollar loan program
For loans of $500 or less, limit loan payments to 5% of the consumer's gross monthly income
Banks have been exiting the short-term loan business due to more stringent regulations.
Wells Fargo, US Bancorp and Regions Financial Corp stopped offering “deposit advance loans” – a product very similar to payday loans
Source: PEW Charitable Trusts 2012
Offers immediate payment for hours worked through proof of timesheet. No interest or fees charged on loans.
Palo Alto, CA
Seed
Move to Online Lending
Given the young demographic of the payday customers online lending has gained significant traction.
Fintech Startups
San Francisco, CA
Series A
Offers small dollar loans and financial education through gamification.
Currently 27% of payday loan customers use online platforms to obtain loans.
Слайд 36Venture Capital Activity
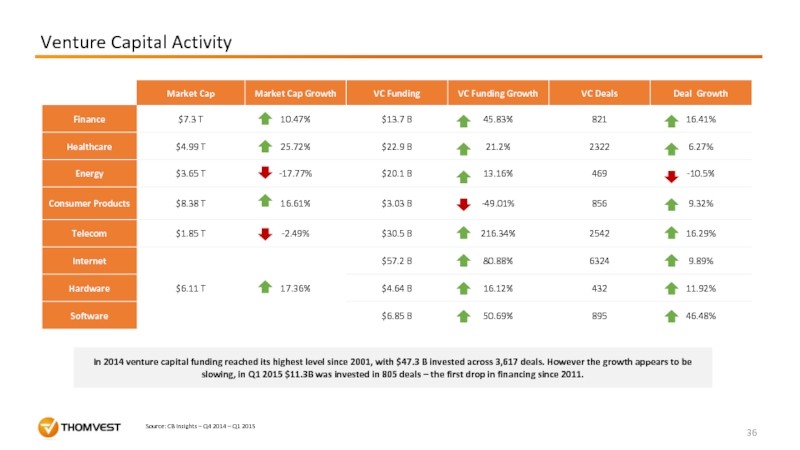
In 2014 venture capital funding reached its highest level
Source: CB Insights – Q4 2014 – Q1 2015
Слайд 37What Sectors are Hot?
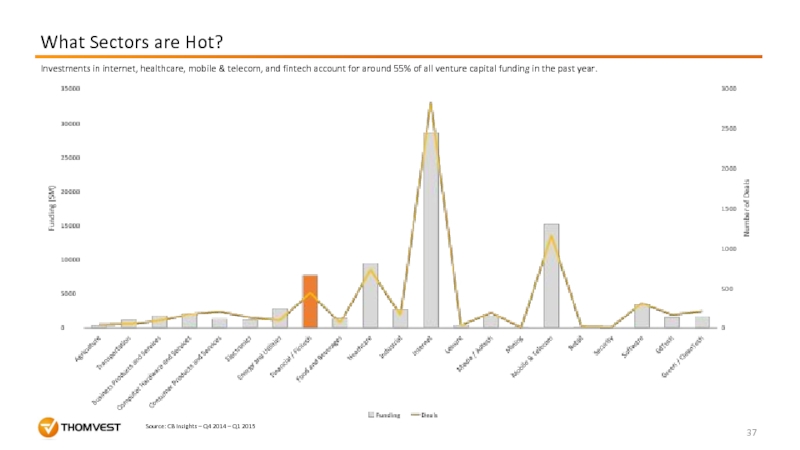
Source: CB Insights – Q4 2014 – Q1
Investments in internet, healthcare, mobile & telecom, and fintech account for around 55% of all venture capital funding in the past year.
Слайд 38FinTech Investing has Increased
Source: CB Insights – Q4 2014 – Q1
In the past 5 years, both the number of fintech deals and the amount of capital invested have increased. The growth in funding has outpaced the growth in deals, suggesting that more investment dollars are going to later stage startups.
Слайд 42
Fintech Sentiment
70% think that in five years the way we pay
71% surveyed would rather go to the dentist than listen to what the banks say
73% are more excited by the offerings in financial services from web giants like Google, Amazon, Apple, Paypal, or Square than their own bank
What are millennials thinking?
What’s preventing mass adoption?
Customers express frustration with banks are but scared to put their money in new institutions. If fintech can win over the confidence of consumers, the financial services industry stands to lose $4.7 T in revenues according to Goldman Sachs.
Sources: VentureBeat, Business Insider, CI Insights, Goldman Sachs, Bankrate
Fraud
Customer Acquisition Costs
Customer Resistance
Data security breaches – such as those at JP Morgan and Target – gained widespread media coverage and have caused concern among consumers.
Lack of visibility and transparency into a startups’s security measures discourage potential customers, as larger banks are trusted to have better security measures.
A major weakness of the alternative credit model is the cost to acquire a customer. Banks spend approximately $350 per customer for each checking account opened.
While online lenders sometimes may have a lower customer acquisition cost, new products require significant education of potential customers.
While many people voice frustration and dislike for banks, there is a stickiness in banking that is not present in other industries – people are hesitant to move their money and savings to new unproven institutions.
Word of mouth is often cited as a catalyst for gaining customers on new platforms.
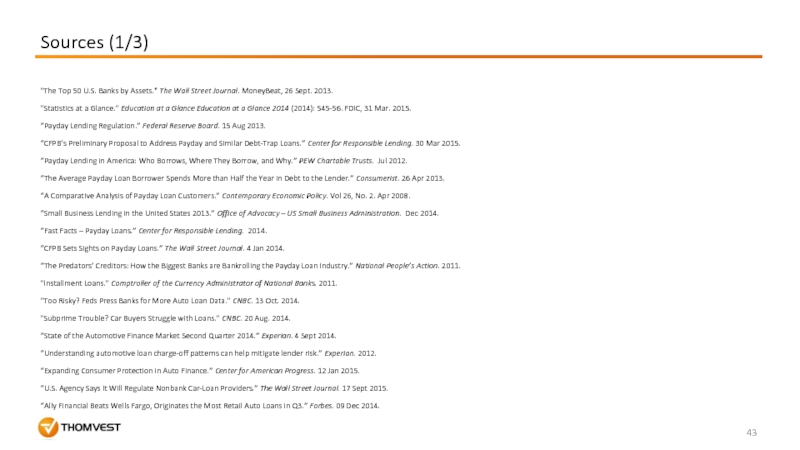
Слайд 43Sources (1/3)
"The Top 50 U.S. Banks by Assets." The Wall Street
"Statistics at a Glance." Education at a Glance Education at a Glance 2014 (2014): 545-56. FDIC, 31 Mar. 2015.
“Payday Lending Regulation.” Federal Reserve Board. 15 Aug 2013.
“CFPB’s Preliminary Proposal to Address Payday and Similar Debt-Trap Loans.” Center for Responsible Lending. 30 Mar 2015.
“Payday Lending in America: Who Borrows, Where They Borrow, and Why.” PEW Chartable Trusts. Jul 2012.
“The Average Payday Loan Borrower Spends More than Half the Year in Debt to the Lender.” Consumerist. 26 Apr 2013.
“A Comparative Analysis of Payday Loan Customers.” Contemporary Economic Policy. Vol 26, No. 2. Apr 2008.
“Small Business Lending in the United States 2013.” Office of Advocacy – US Small Business Administration. Dec 2014.
“Fast Facts – Payday Loans.” Center for Responsible Lending. 2014.
“CFPB Sets Sights on Payday Loans.” The Wall Street Journal. 4 Jan 2014.
“The Predators’ Creditors: How the Biggest Banks are Bankrolling the Payday Loan Industry.” National People’s Action. 2011.
"Installment Loans." Comptroller of the Currency Administrator of National Banks. 2011.
"Too Risky? Feds Press Banks for More Auto Loan Data." CNBC. 13 Oct. 2014.
"Subprime Trouble? Car Buyers Struggle with Loans." CNBC. 20 Aug. 2014.
“State of the Automotive Finance Market Second Quarter 2014.” Experian. 4 Sept 2014.
“Understanding automotive loan charge-off patterns can help mitigate lender risk.” Experian. 2012.
“Expanding Consumer Protection in Auto Finance.” Center for American Progress. 12 Jan 2015.
“U.S. Agency Says It Will Regulate Nonbank Car-Loan Providers.” The Wall Street Journal. 17 Sept 2015.
“Ally Financial Beats Wells Fargo, Originates the Most Retail Auto Loans in Q3.” Forbes. 09 Dec 2014.
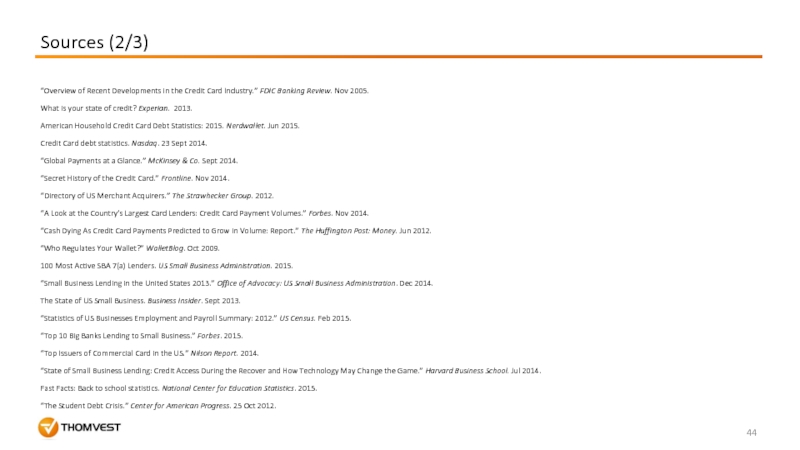
Слайд 44Sources (2/3)
“Overview of Recent Developments in the Credit Card Industry.” FDIC
What is your state of credit? Experian. 2013.
American Household Credit Card Debt Statistics: 2015. Nerdwallet. Jun 2015.
Credit Card debt statistics. Nasdaq. 23 Sept 2014.
“Global Payments at a Glance.” McKinsey & Co. Sept 2014.
“Secret History of the Credit Card.” Frontline. Nov 2014.
“Directory of US Merchant Acquirers.” The Strawhecker Group. 2012.
“A Look at the Country’s Largest Card Lenders: Credit Card Payment Volumes.” Forbes. Nov 2014.
“Cash Dying As Credit Card Payments Predicted to Grow in Volume: Report.” The Huffington Post: Money. Jun 2012.
“Who Regulates Your Wallet?” WalletBlog. Oct 2009.
100 Most Active SBA 7(a) Lenders. US Small Business Administration. 2015.
“Small Business Lending in the United States 2013.” Office of Advocacy: US Small Business Administration. Dec 2014.
The State of US Small Business. Business Insider. Sept 2013.
“Statistics of US Businesses Employment and Payroll Summary: 2012.” US Census. Feb 2015.
“Top 10 Big Banks Lending to Small Business.” Forbes. 2015.
“Top Issuers of Commercial Card in the US.” Nilson Report. 2014.
“State of Small Business Lending: Credit Access During the Recover and How Technology May Change the Game.” Harvard Business School. Jul 2014.
Fast Facts: Back to school statistics. National Center for Education Statistics. 2015.
“The Student Debt Crisis.” Center for American Progress. 25 Oct 2012.
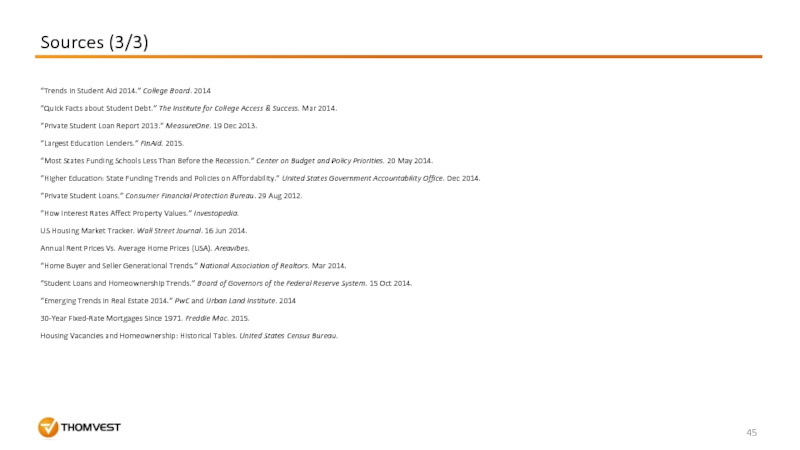
Слайд 45Sources (3/3)
“Trends in Student Aid 2014.” College Board. 2014
“Quick Facts about
“Private Student Loan Report 2013.” MeasureOne. 19 Dec 2013.
“Largest Education Lenders.” FinAid. 2015.
“Most States Funding Schools Less Than Before the Recession.” Center on Budget and Policy Priorities. 20 May 2014.
“Higher Education: State Funding Trends and Policies on Affordability.” United States Government Accountability Office. Dec 2014.
“Private Student Loans.” Consumer Financial Protection Bureau. 29 Aug 2012.
“How Interest Rates Affect Property Values.” Investopedia.
US Housing Market Tracker. Wall Street Journal. 16 Jun 2014.
Annual Rent Prices Vs. Average Home Prices (USA). Areavibes.
“Home Buyer and Seller Generational Trends.” National Association of Realtors. Mar 2014.
“Student Loans and Homeownership Trends.” Board of Governors of the Federal Reserve System. 15 Oct 2014.
“Emerging Trends in Real Estate 2014.” PwC and Urban Land Institute. 2014
30-Year Fixed-Rate Mortgages Since 1971. Freddie Mac. 2015.
Housing Vacancies and Homeownership: Historical Tables. United States Census Bureau.
