- Главная
- Разное
- Дизайн
- Бизнес и предпринимательство
- Аналитика
- Образование
- Развлечения
- Красота и здоровье
- Финансы
- Государство
- Путешествия
- Спорт
- Недвижимость
- Армия
- Графика
- Культурология
- Еда и кулинария
- Лингвистика
- Английский язык
- Астрономия
- Алгебра
- Биология
- География
- Детские презентации
- Информатика
- История
- Литература
- Маркетинг
- Математика
- Медицина
- Менеджмент
- Музыка
- МХК
- Немецкий язык
- ОБЖ
- Обществознание
- Окружающий мир
- Педагогика
- Русский язык
- Технология
- Физика
- Философия
- Химия
- Шаблоны, картинки для презентаций
- Экология
- Экономика
- Юриспруденция
Accounts Receivable and Inventory Management презентация
Содержание
- 1. Accounts Receivable and Inventory Management
- 2. After studying Chapter 10, you should be
- 3. Accounts Receivable and Inventory Management Credit and
- 4. Credit and Collection
- 5. Credit Standards The financial manager should continually
- 6. Credit Standards A larger credit department Additional
- 7. Example of Relaxing Credit Standards Basket Wonders
- 8. Example of Relaxing Credit Standards Additional
- 9. Example of Relaxing Credit Standards Profitability of
- 10. Credit and Collection
- 11. Credit Terms Credit Period -- The total
- 12. Example of Relaxing the Credit Period
- 13. Example of Relaxing the Credit Period
- 14. Example of Relaxing the Credit Period Profitability
- 15. Example of Relaxing the Credit Period New
- 16. Credit and Collection
- 17. Credit Terms Cash Discount -- A percent
- 18. Example of Introducing a Cash Discount
- 19. The before-tax opportunity cost for each
- 20. Example of Using the Cash Discount Receivable
- 21. Pre-tax cost of .02 x .3 x
- 22. Inventory Management and Control
- 23. Inventory Management and Control
- 24. Appropriate Level of Inventories Employ a
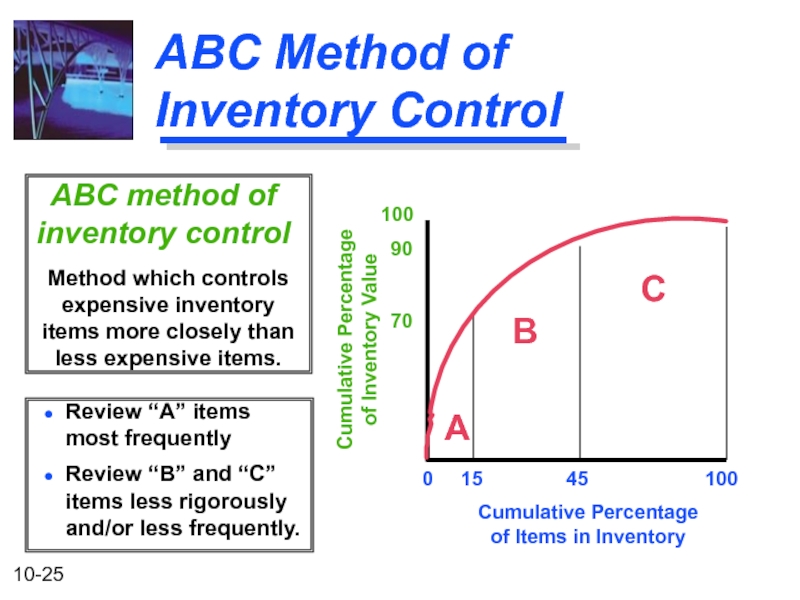
- 25. ABC Method of Inventory Control Method
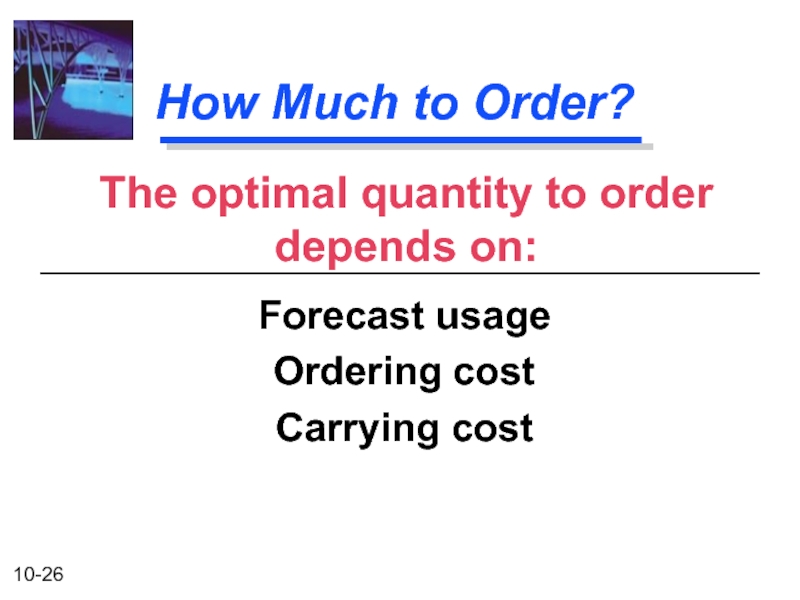
- 26. How Much to Order? Forecast usage
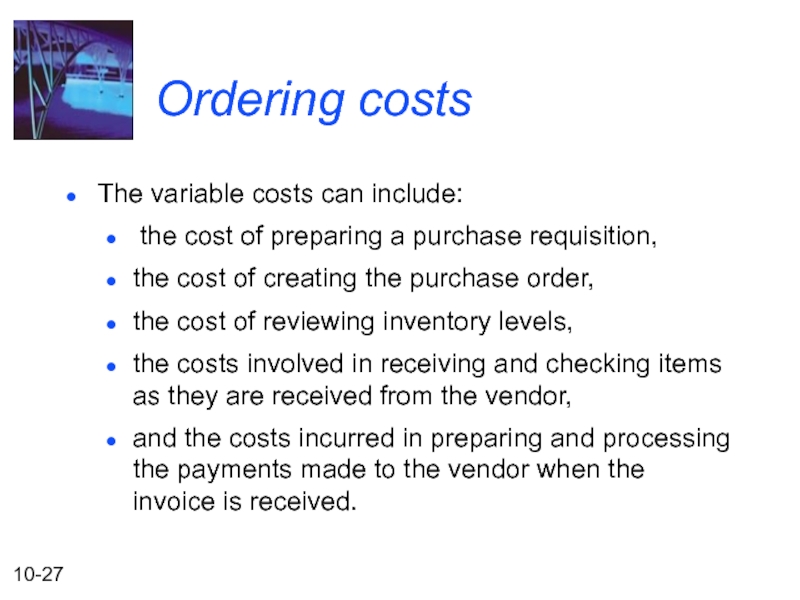
- 27. Ordering costs The variable costs can include:
- 28. Total Inventory Costs C: Carrying costs
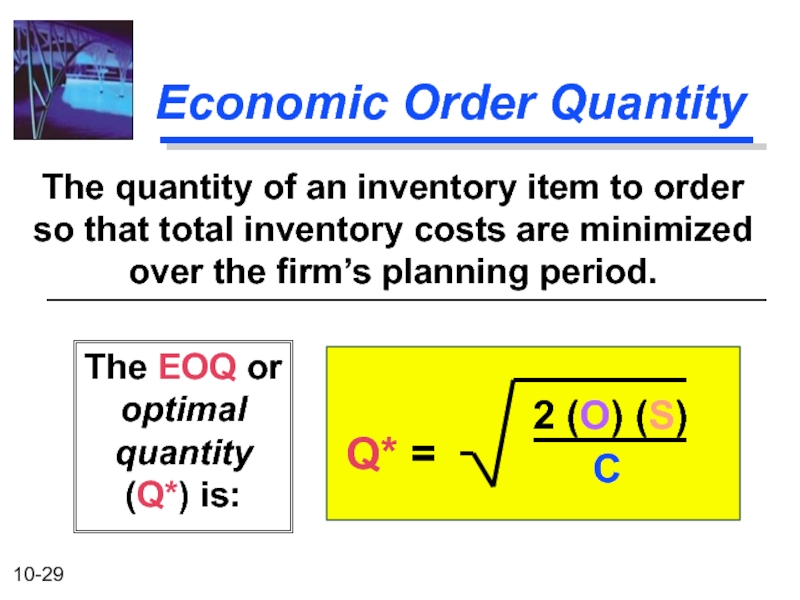
- 29. Economic Order Quantity The EOQ or
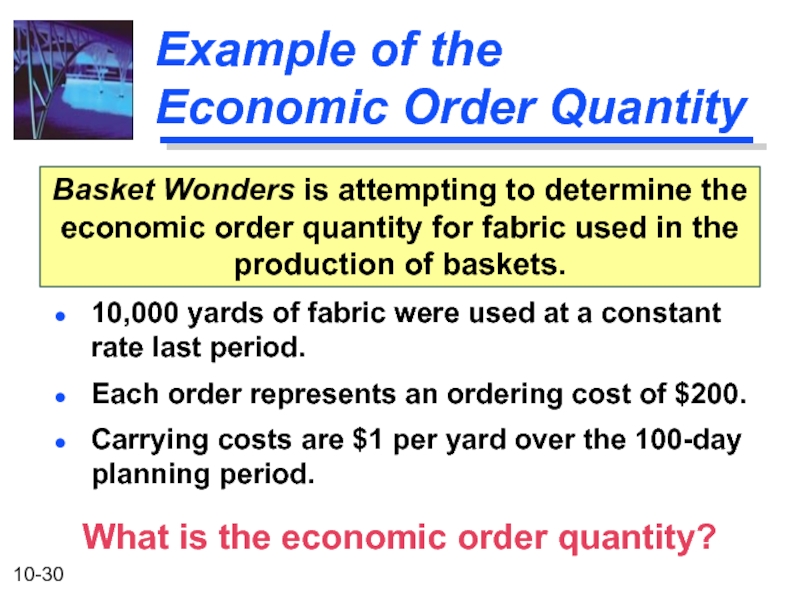
- 30. Example of the Economic Order
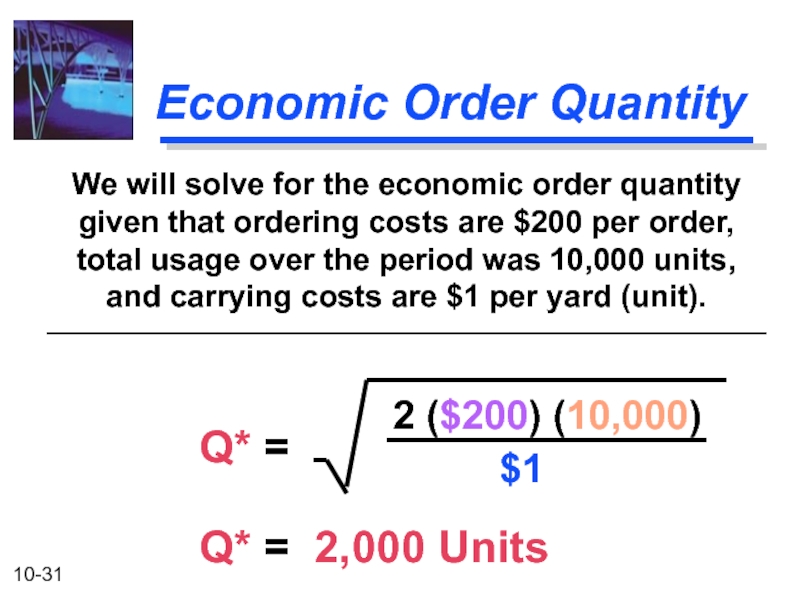
- 31. Economic Order Quantity We will solve for
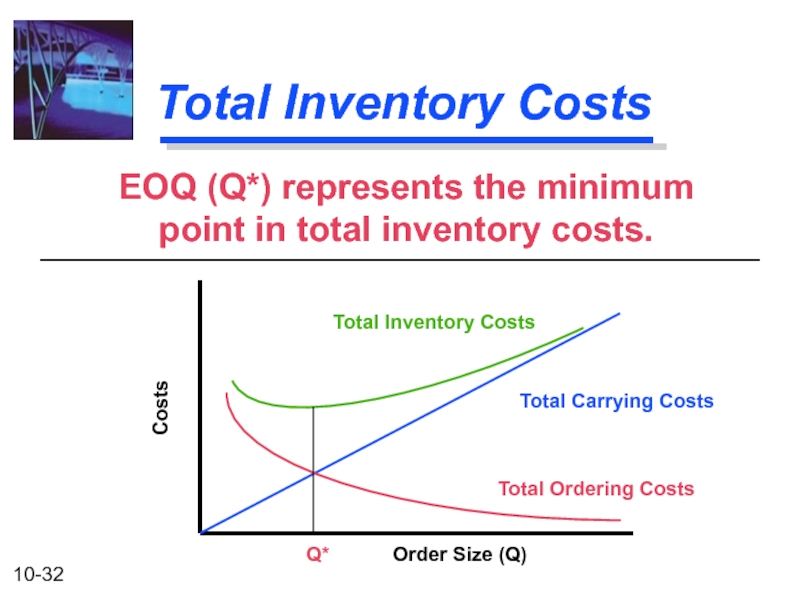
- 32. Total Inventory Costs EOQ (Q*) represents
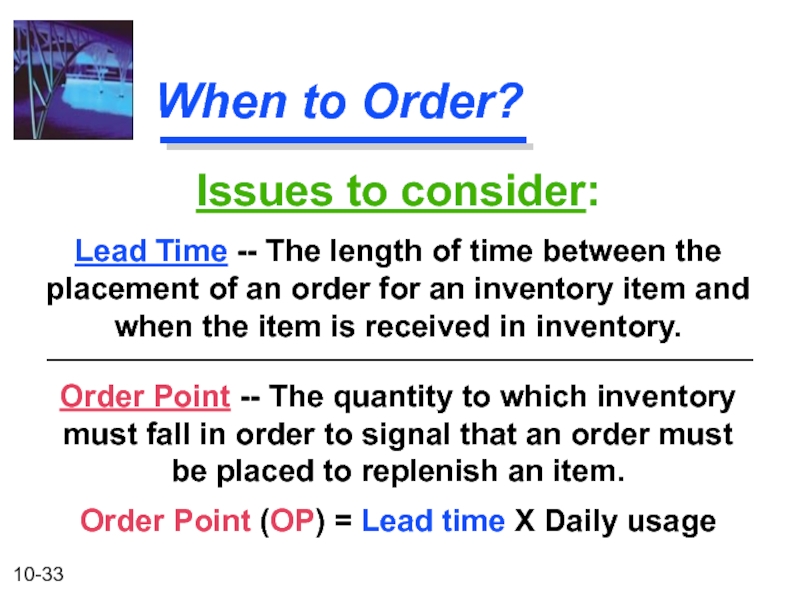
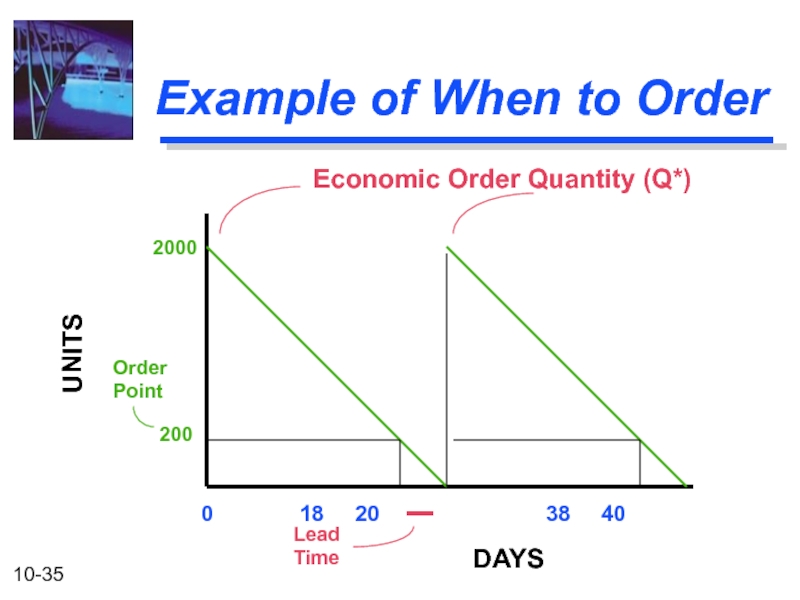
- 33. When to Order? Order Point -- The
- 34. Example of When to Order Julie
- 35. Example of When to Order 0
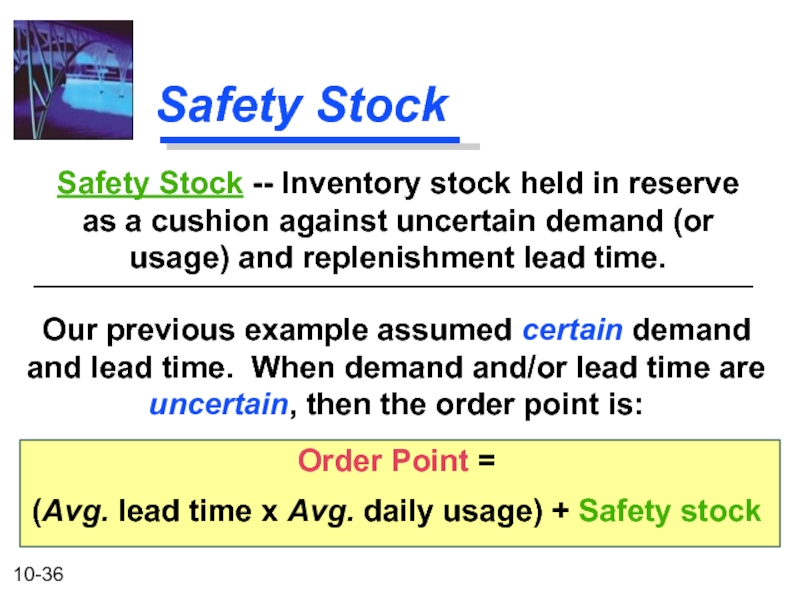
- 36. Safety Stock Our previous example assumed
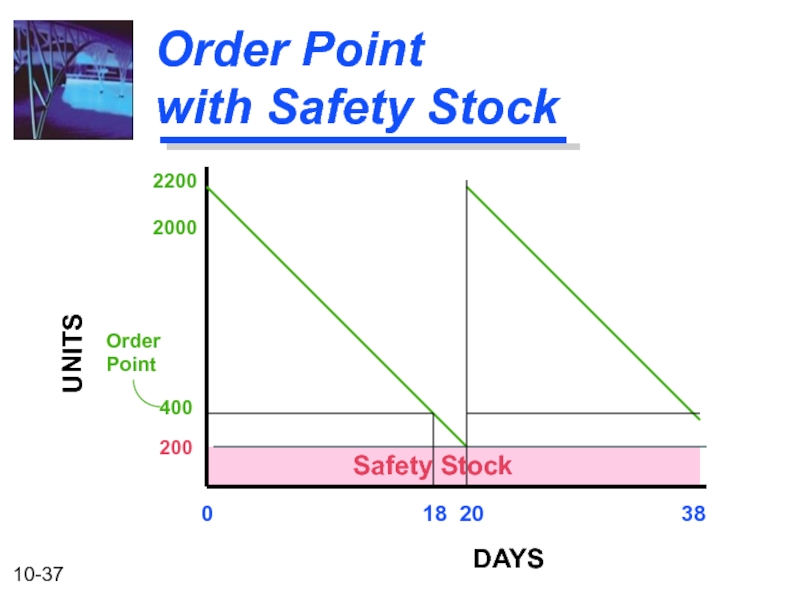
- 37. Order Point with Safety Stock
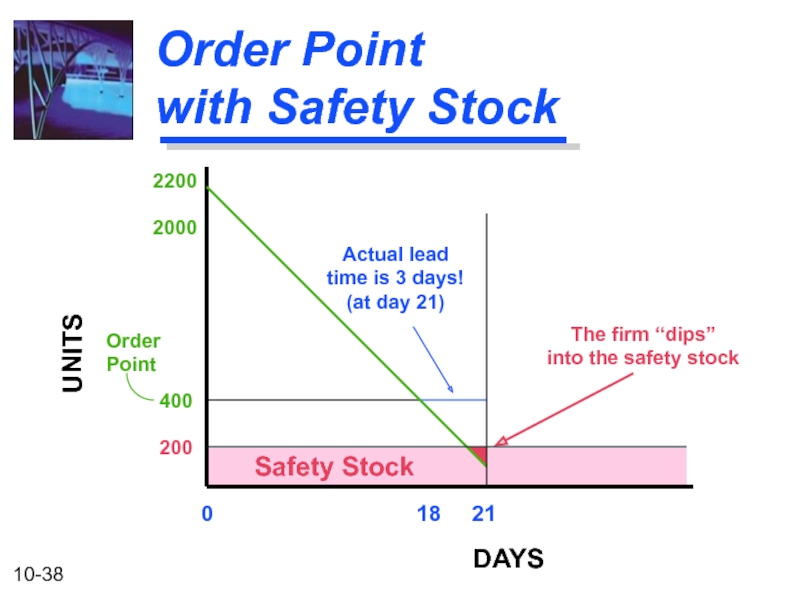
- 38. Order Point with Safety Stock
- 39. How Much Safety Stock? Amount of uncertainty
- 40. Just-in-Time A very accurate production and inventory
- 41. Supply Chain Management JIT inventory control is
Слайд 2After studying Chapter 10, you should be able to:
List the key
Understand how the level of investment in accounts receivable is affected by the firm's credit policies.
Critically evaluate proposed changes in credit policy, including changes in credit standards, credit period, and cash discount.
Describe possible sources of information on credit applicants and how you might use the information to analyze a credit applicant.
Identify the various types of inventories and discuss the advantages and disadvantages of increasing/decreasing inventories.
Describe, explain, and illustrate the key concepts and calculations necessary for effective inventory management and control, including classification, economic order quantity (EOQ), order point, safety stock, and just-in-time (JIT).
Слайд 3Accounts Receivable and Inventory Management
Credit and Collection Policies
Analyzing the Credit Applicant
Inventory
Слайд 4
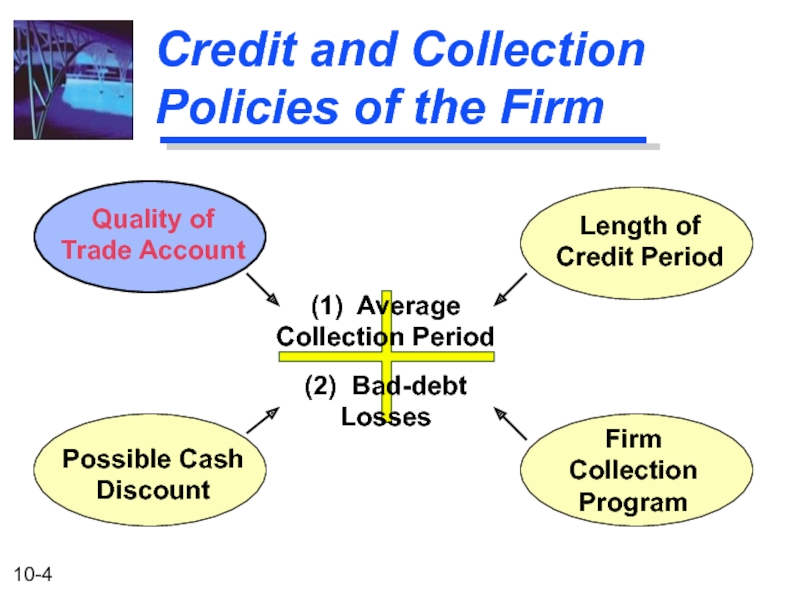
Credit and Collection Policies of the Firm
(1) Average
Collection Period
(2) Bad-debt
Losses
Quality
Trade Account
Length of
Credit Period
Possible Cash
Discount
Firm
Collection
Program
Слайд 5Credit Standards
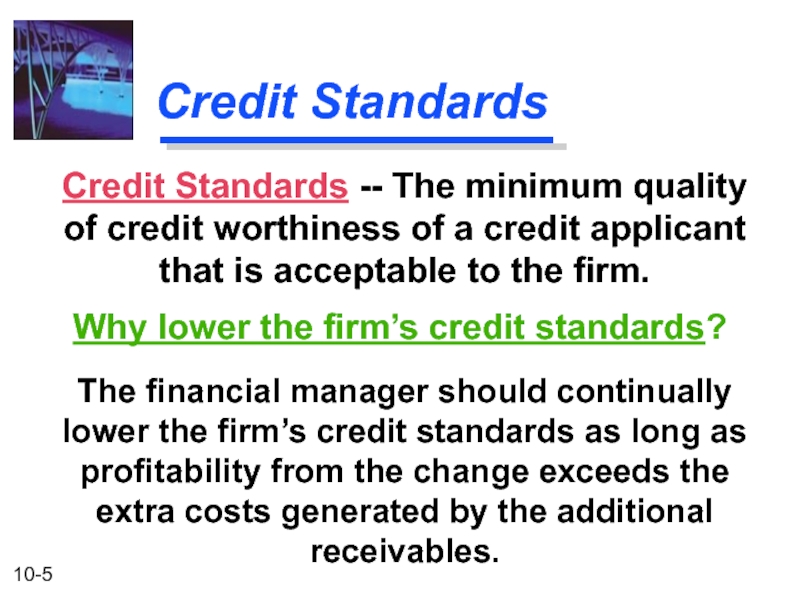
The financial manager should continually lower the firm’s credit standards
Credit Standards -- The minimum quality of credit worthiness of a credit applicant that is acceptable to the firm.
Why lower the firm’s credit standards?
Слайд 6Credit Standards
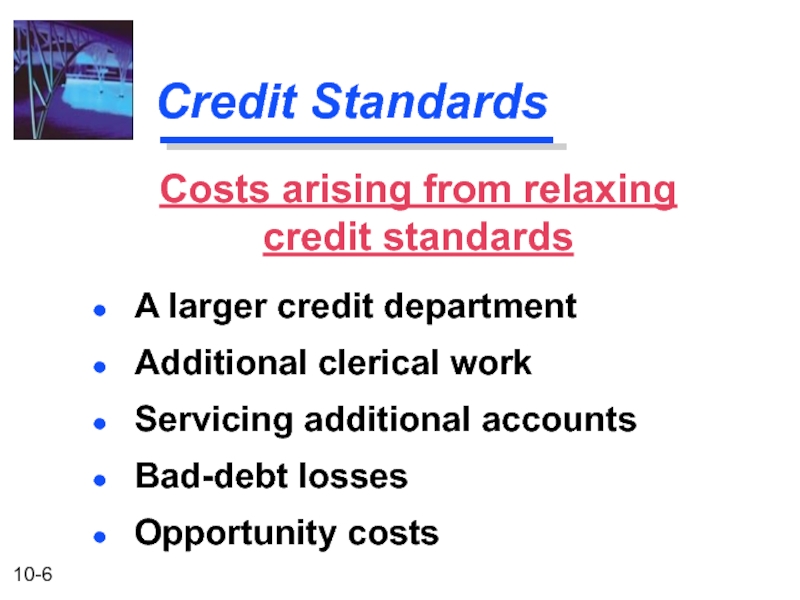
A larger credit department
Additional clerical work
Servicing additional accounts
Bad-debt losses
Opportunity costs
Costs
Слайд 7Example of Relaxing Credit Standards
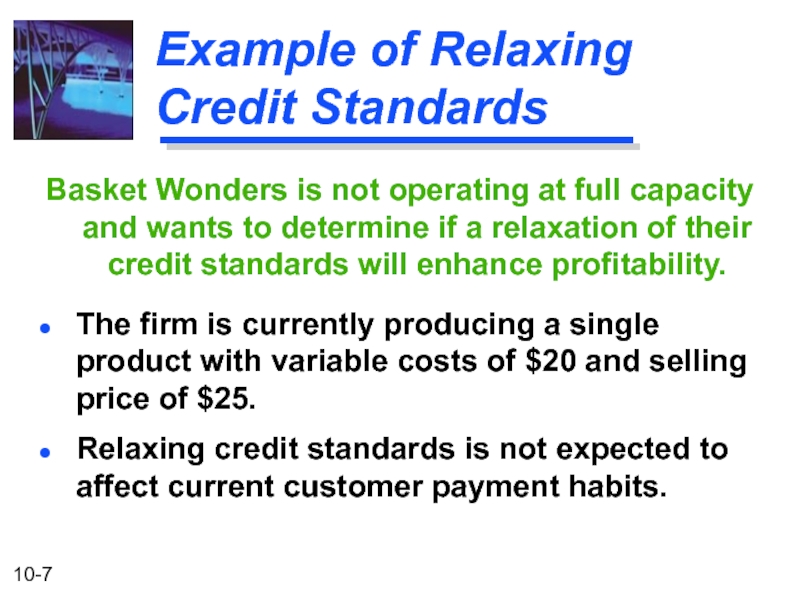
Basket Wonders is not operating at full
The firm is currently producing a single product with variable costs of $20 and selling price of $25.
Relaxing credit standards is not expected to affect current customer payment habits.
Слайд 8
Example of Relaxing Credit Standards
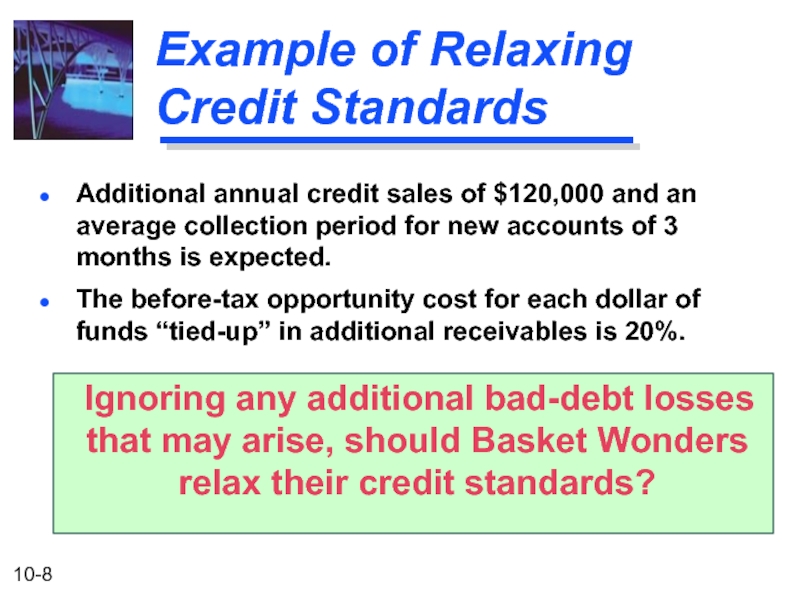
Additional annual credit sales of $120,000 and
The before-tax opportunity cost for each dollar of funds “tied-up” in additional receivables is 20%.
Ignoring any additional bad-debt losses that may arise, should Basket Wonders relax their credit standards?
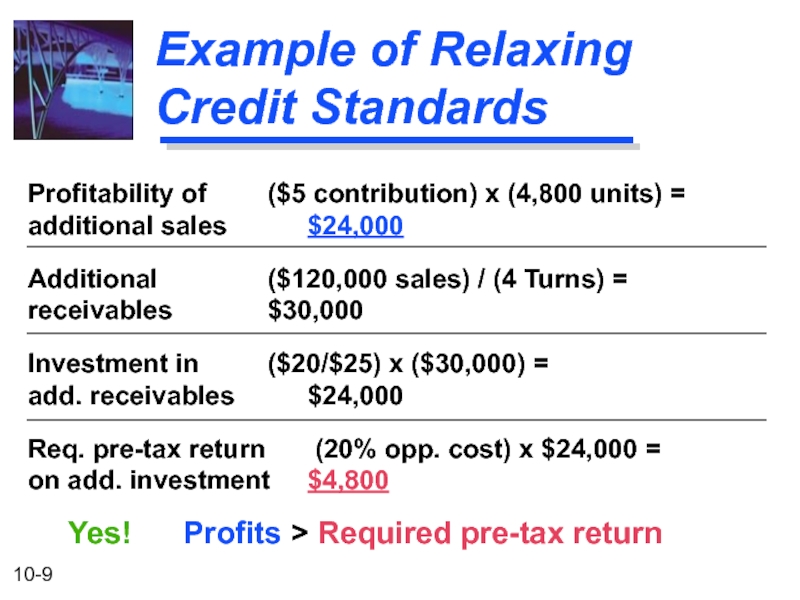
Слайд 9Example of Relaxing Credit Standards
Profitability of ($5 contribution) x (4,800 units)
additional sales $24,000
Additional ($120,000 sales) / (4 Turns) =
receivables $30,000
Investment in ($20/$25) x ($30,000) =
add. receivables $24,000
Req. pre-tax return (20% opp. cost) x $24,000 =
on add. investment $4,800
Yes! Profits > Required pre-tax return
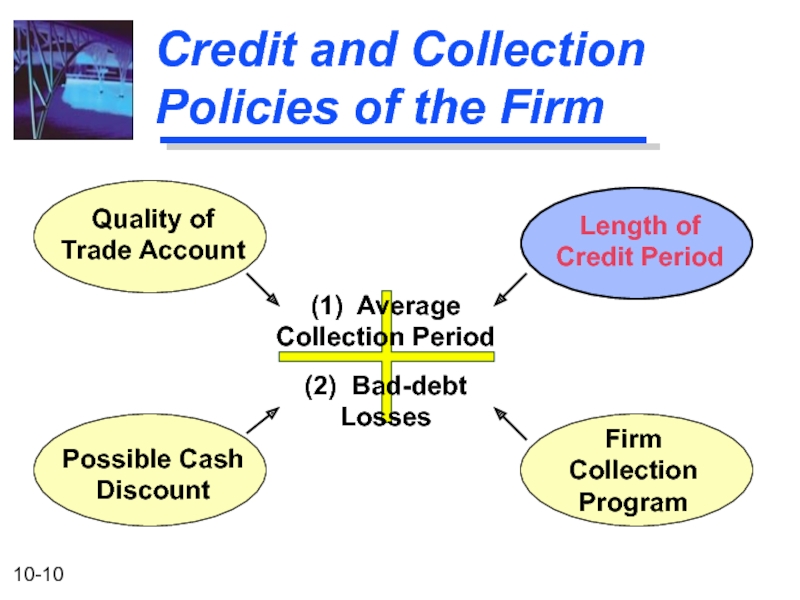
Слайд 10
Credit and Collection Policies of the Firm
(1) Average
Collection Period
(2) Bad-debt
Losses
Quality
Trade Account
Length of
Credit Period
Possible Cash
Discount
Firm
Collection
Program
Слайд 11Credit Terms
Credit Period -- The total length of time over which
Credit Terms -- Specify the length of time over which credit is extended to a customer and the discount, if any, given for early payment. For example, “2/10, net 30.”
Слайд 12
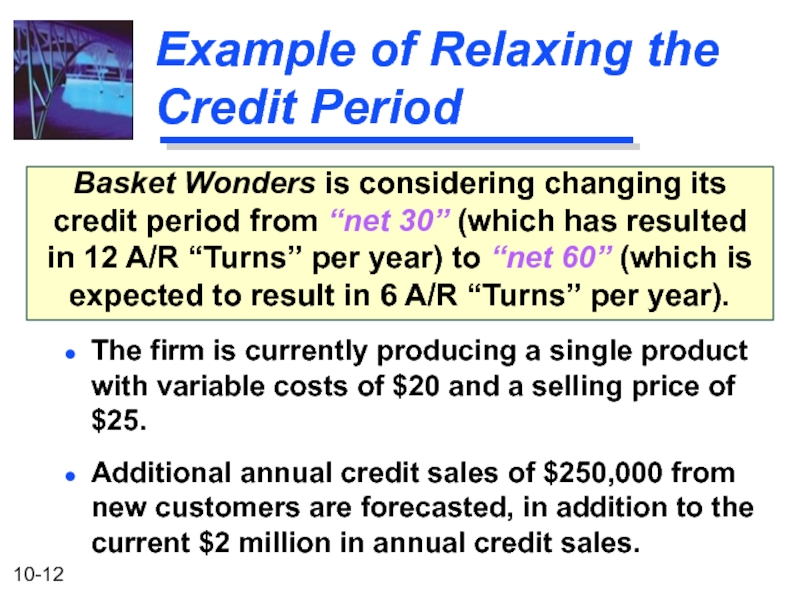
Example of Relaxing the Credit Period
Basket Wonders is considering changing its
The firm is currently producing a single product with variable costs of $20 and a selling price of $25.
Additional annual credit sales of $250,000 from new customers are forecasted, in addition to the current $2 million in annual credit sales.
Слайд 13
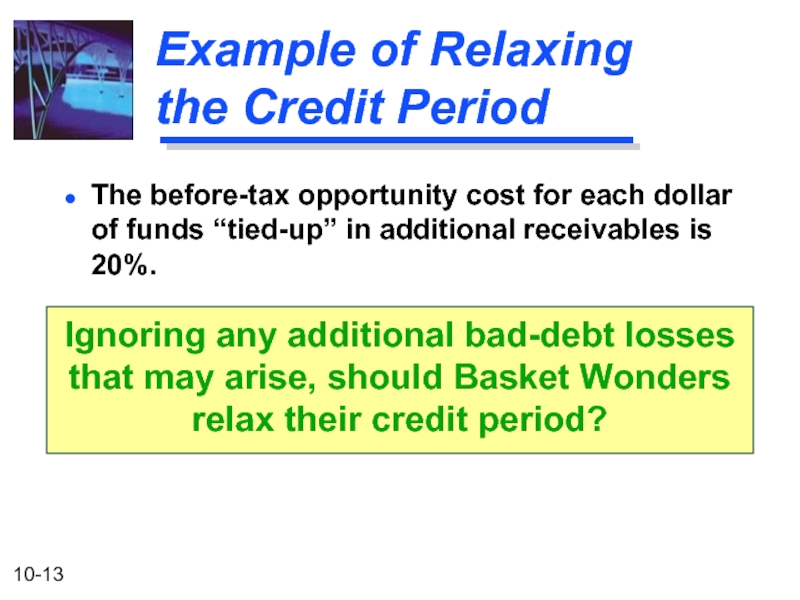
Example of Relaxing the Credit Period
The before-tax opportunity cost for each
Ignoring any additional bad-debt losses that may arise, should Basket Wonders relax their credit period?
Слайд 14Example of Relaxing the Credit Period
Profitability of ($5 contribution)x(10,000 units) =
additional
Additional ($250,000 sales) / (6 Turns) =
receivables $41,667
Investment in add. ($20/$25) x ($41,667) =
receivables (new sales) $33,334
Previous ($2,000,000 sales) / (12 Turns) =
receivable level $166,667
Слайд 15Example of Relaxing the Credit Period
New ($2,000,000 sales) / (6 Turns)
receivable level $333,333
Investment in $333,333 - $166,667 =
add. receivables $166,666
(original sales)
Total investment in $33,334 + $166,666 =
add. receivables $200,000
Req. pre-tax return (20% opp. cost) x $200,000 =
on add. investment $40,000
Yes! Profits > Required pre-tax return
Слайд 16
Credit and Collection Policies of the Firm
(1) Average
Collection Period
(2) Bad-debt
Losses
Quality
Trade Account
Length of
Credit Period
Possible Cash
Discount
Firm
Collection
Program
Слайд 17Credit Terms
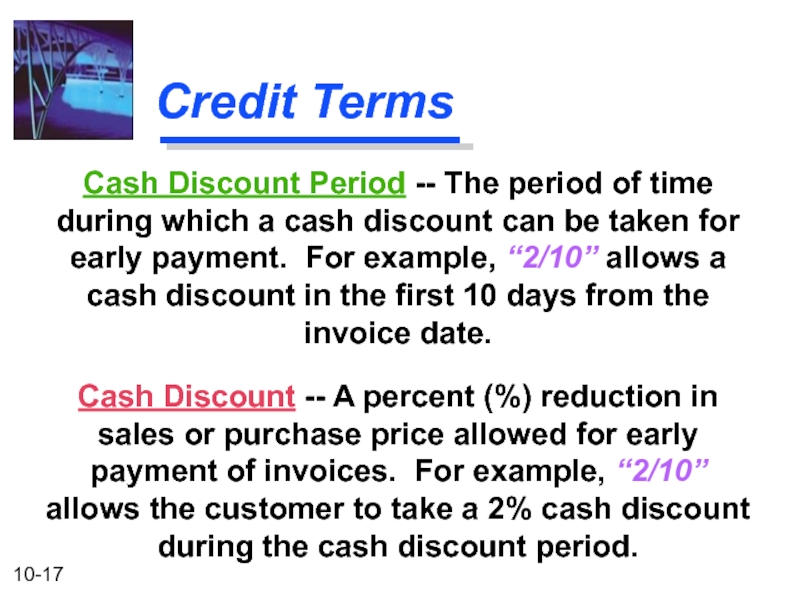
Cash Discount -- A percent (%) reduction in sales or
Cash Discount Period -- The period of time during which a cash discount can be taken for early payment. For example, “2/10” allows a cash discount in the first 10 days from the invoice date.
Слайд 18
Example of Introducing a Cash Discount
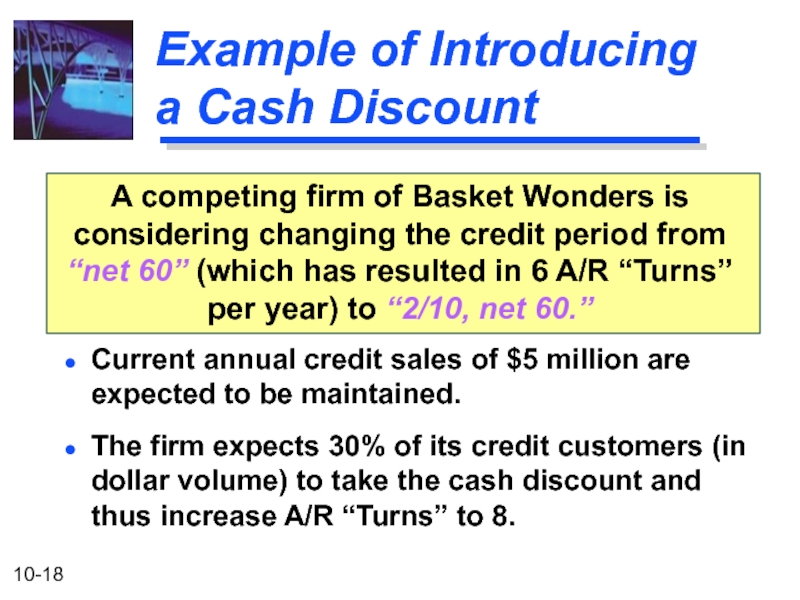
A competing firm of Basket Wonders
Current annual credit sales of $5 million are expected to be maintained.
The firm expects 30% of its credit customers (in dollar volume) to take the cash discount and thus increase A/R “Turns” to 8.
Слайд 19
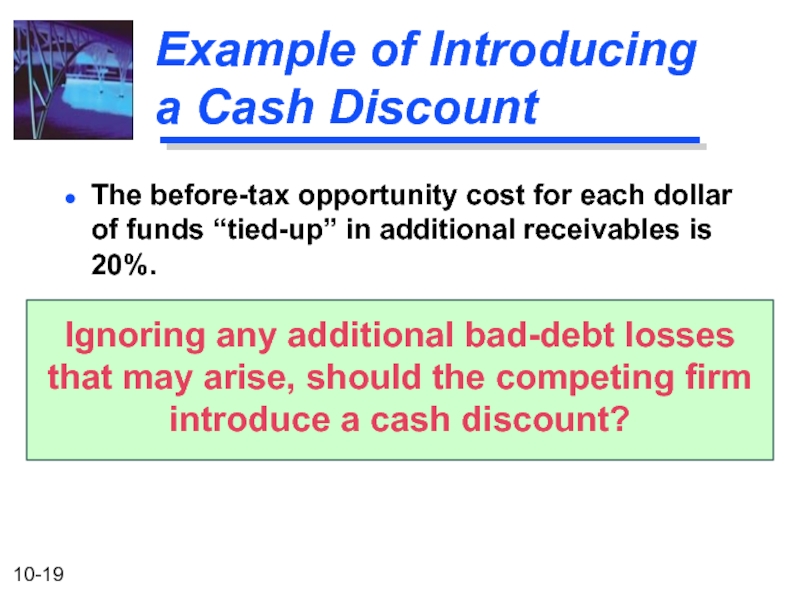
The before-tax opportunity cost for each dollar of funds “tied-up” in
Ignoring any additional bad-debt losses that may arise, should the competing firm introduce a cash discount?
Example of Introducing a Cash Discount
Слайд 20Example of Using the Cash Discount
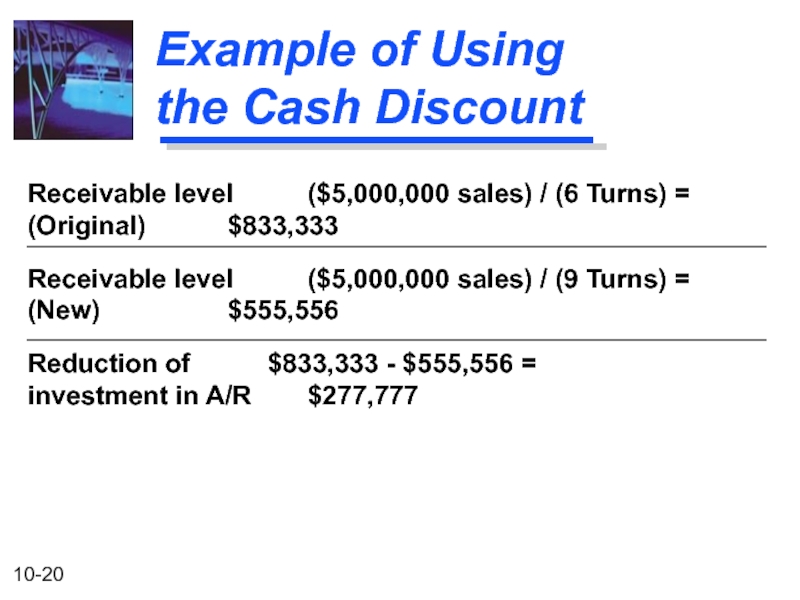
Receivable level ($5,000,000 sales) / (6
(Original) $833,333
Receivable level ($5,000,000 sales) / (9 Turns) =
(New) $555,556
Reduction of $833,333 - $555,556 =
investment in A/R $277,777
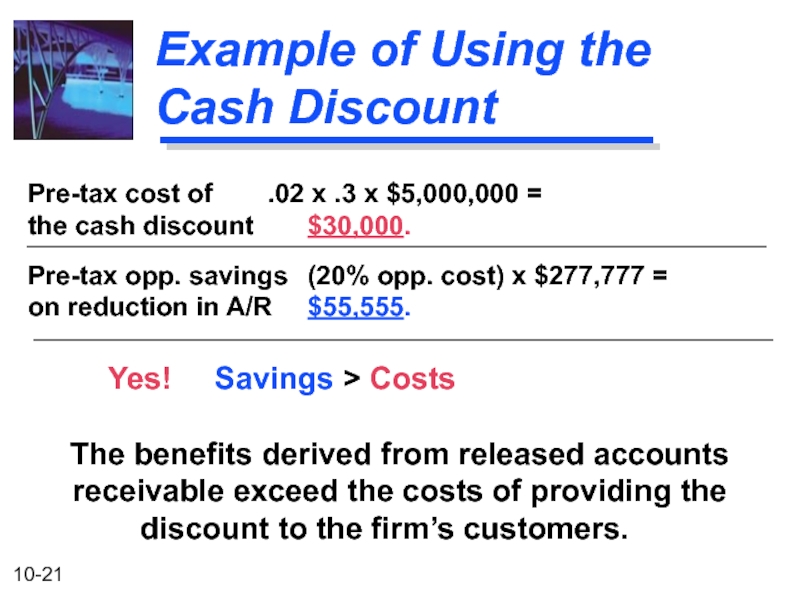
Слайд 21Pre-tax cost of .02 x .3 x $5,000,000 =
the cash discount
Pre-tax opp. savings (20% opp. cost) x $277,777 =
on reduction in A/R $55,555.
Yes! Savings > Costs
The benefits derived from released accounts receivable exceed the costs of providing the discount to the firm’s customers.
Example of Using the Cash Discount
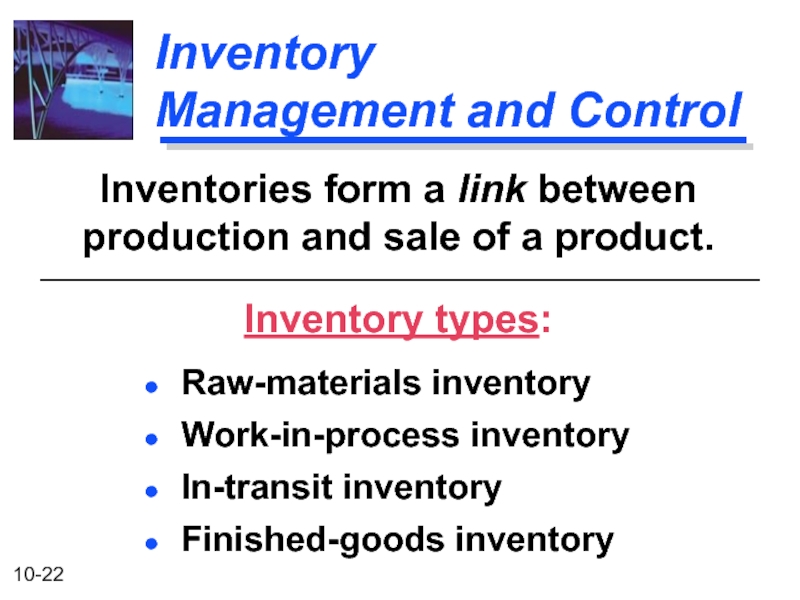
Слайд 22Inventory Management and Control
Raw-materials inventory
Work-in-process inventory
In-transit inventory
Finished-goods inventory
Inventories
Inventory types:
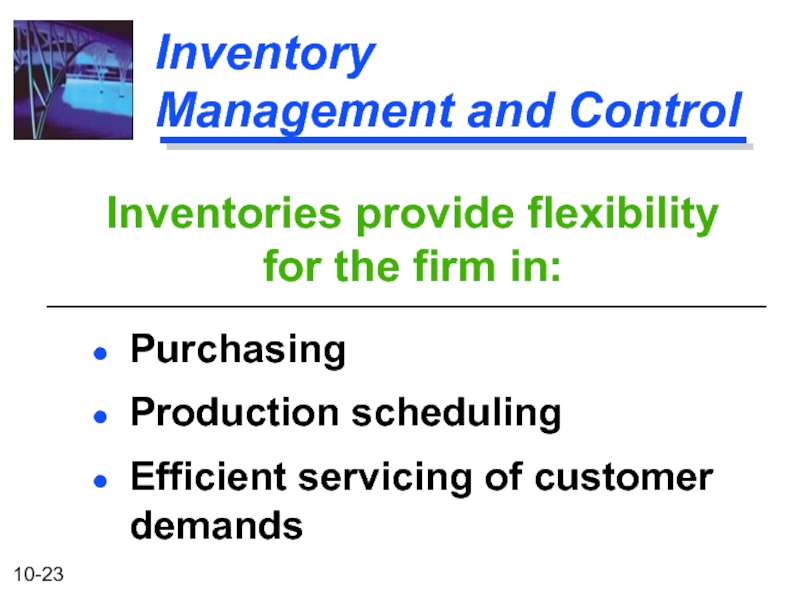
Слайд 23Inventory Management and Control
Purchasing
Production scheduling
Efficient servicing of customer
Inventories provide flexibility for the firm in:
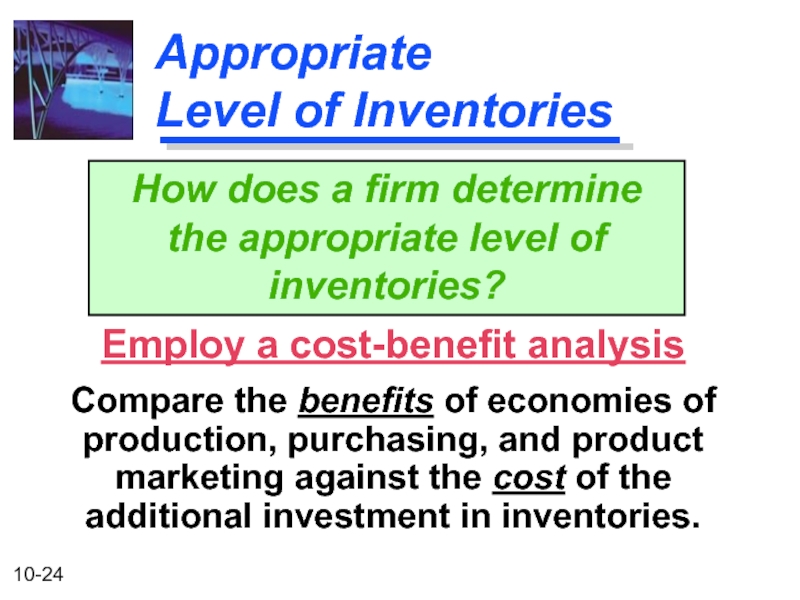
Слайд 24Appropriate
Level of Inventories
Employ a cost-benefit analysis
Compare the benefits of economies
How does a firm determine the appropriate level of inventories?
Слайд 25
ABC Method of Inventory Control
Method which controls expensive inventory items more
Review “A” items most frequently
Review “B” and “C” items less rigorously and/or less frequently.
ABC method of inventory control
0 15 45 100
Cumulative Percentage
of Items in Inventory
70
90
100
Cumulative Percentage
of Inventory Value
A
B
C
Слайд 26How Much to Order?
Forecast usage
Ordering cost
Carrying cost
The optimal
Слайд 27Ordering costs
The variable costs can include:
the cost of preparing a
the cost of creating the purchase order,
the cost of reviewing inventory levels,
the costs involved in receiving and checking items as they are received from the vendor,
and the costs incurred in preparing and processing the payments made to the vendor when the invoice is received.
Слайд 28
Total Inventory Costs
C: Carrying costs per unit per period
O: Ordering costs
S: Total usage during the period
Total inventory costs (T) =
C (Q / 2) + O (S / Q)
TIME
Q / 2
Q
Average
Inventory
INVENTORY
(in units)
Слайд 29
Economic Order Quantity
The EOQ or optimal quantity (Q*) is:
The quantity of
Q* =
2 (O) (S)
C
Слайд 30
Example of the
Economic Order Quantity
Basket Wonders is attempting to determine
10,000 yards of fabric were used at a constant rate last period.
Each order represents an ordering cost of $200.
Carrying costs are $1 per yard over the 100-day planning period.
What is the economic order quantity?
Слайд 31Economic Order Quantity
We will solve for the economic order quantity given
Q* =
2 ($200) (10,000)
$1
Q* = 2,000 Units
Слайд 32Total Inventory Costs
EOQ (Q*) represents the minimum point in total inventory
Total Inventory Costs
Total Carrying Costs
Total Ordering Costs
Q*
Order Size (Q)
Costs
Слайд 33When to Order?
Order Point -- The quantity to which inventory must
Order Point (OP) = Lead time X Daily usage
Issues to consider:
Lead Time -- The length of time between the placement of an order for an inventory item and when the item is received in inventory.
Слайд 34
Example of When to Order
Julie Miller of Basket Wonders has determined
When should Julie order more fabric?
Lead time = 2 days
Daily usage = 10,000 yards / 100 days = 100 yards per day
Order Point = 2 days x 100 yards per day = 200 yards
Слайд 35Example of When to Order
0 18 20
Lead
Time
200
2000
Order
Point
UNITS
DAYS
Economic Order Quantity (Q*)
Слайд 36
Safety Stock
Our previous example assumed certain demand and lead time. When
Order Point =
(Avg. lead time x Avg. daily usage) + Safety stock
Safety Stock -- Inventory stock held in reserve as a cushion against uncertain demand (or usage) and replenishment lead time.
Слайд 38
Order Point
with Safety Stock
UNITS
DAYS
Safety Stock
Actual lead
time is 3 days!
(at day
2200
2000
Order
Point
400
200
0 18 21
The firm “dips”
into the safety stock
Слайд 39How Much Safety Stock?
Amount of uncertainty in inventory demand
Amount of uncertainty
Cost of running out of inventory
Cost of carrying inventory
What is the proper amount of safety stock?
Depends on the:
Слайд 40Just-in-Time
A very accurate production and inventory information system
Highly efficient purchasing
Reliable suppliers
Efficient
Just-in-Time -- An approach to inventory management and control in which inventories are acquired and inserted in production at the exact times they are needed.
Requirements of applying this approach:
Слайд 41Supply Chain Management
JIT inventory control is one link in SCM.
The internet
Competition through B2B auctions helps reduce firm costs – especially standardized items
Supply Chain Management (SCM) – Managing the process of moving goods, services, and information from suppliers to end customers.
