- Главная
- Разное
- Дизайн
- Бизнес и предпринимательство
- Аналитика
- Образование
- Развлечения
- Красота и здоровье
- Финансы
- Государство
- Путешествия
- Спорт
- Недвижимость
- Армия
- Графика
- Культурология
- Еда и кулинария
- Лингвистика
- Английский язык
- Астрономия
- Алгебра
- Биология
- География
- Детские презентации
- Информатика
- История
- Литература
- Маркетинг
- Математика
- Медицина
- Менеджмент
- Музыка
- МХК
- Немецкий язык
- ОБЖ
- Обществознание
- Окружающий мир
- Педагогика
- Русский язык
- Технология
- Физика
- Философия
- Химия
- Шаблоны, картинки для презентаций
- Экология
- Экономика
- Юриспруденция
10 Metrics Dividend Investors Need to Know презентация
Содержание
- 1. 10 Metrics Dividend Investors Need to Know
- 2. There are hundreds of possible metrics you
- 3. 1. Payout ratio A stock’s payout ratio
- 4. As a general rule, I like to
- 5. 2. Dividend yield Surprisingly, dividend yield is
- 6. It’s also worth noting that, because dividend
- 7. 3. Dividend history and growth One of
- 8. Let’s look at two of my favorite
- 9. Wal-Mart has a dividend yield of 3.33%,
- 10. October 23, 2015
- 11. 4. Interest coverage Also known as “debt
- 12. Interest coverage tells us whether a company
- 13. 5. Total return A stock’s dividend is
- 14. Wal-Mart and Johnson & Johnson have produced
- 15. 6. EPS and revenue growth A strong
- 16. 7. P/E ratio Perhaps the most widely
- 17. 8. Share buybacks There are two main
- 18. Many investors actually prefer share buybacks to
- 19. 9. Beta When choosing dividend stocks for
- 20. Johnson & Johnson has a beta of
- 21. 10. Return on equity (ROE) Return on
- 22. Wal-Mart has a ROE (TTM) of 19.78%,
- 23. The simple trick that can add $15,978
Слайд 2There are hundreds of possible metrics you can use to evaluate
But, some are more important than others.
For dividend stocks, here are 10 of the most important metrics you can use to make informed investment decisions.
Слайд 31. Payout ratio
A stock’s payout ratio is a measurement of its
A relatively low payout ratio indicates that the company has lots of room to increase its dividend in the future.
It also shows a stock’s ability to continue its dividend payments if times get tough.
October 23, 2015
Слайд 4As a general rule, I like to see payout ratios that
For example, real estate investment trusts (REITs) are required to pay out at least 90% of their income, so a high payout ratio isn’t a sign of trouble in this case.
October 23, 2015
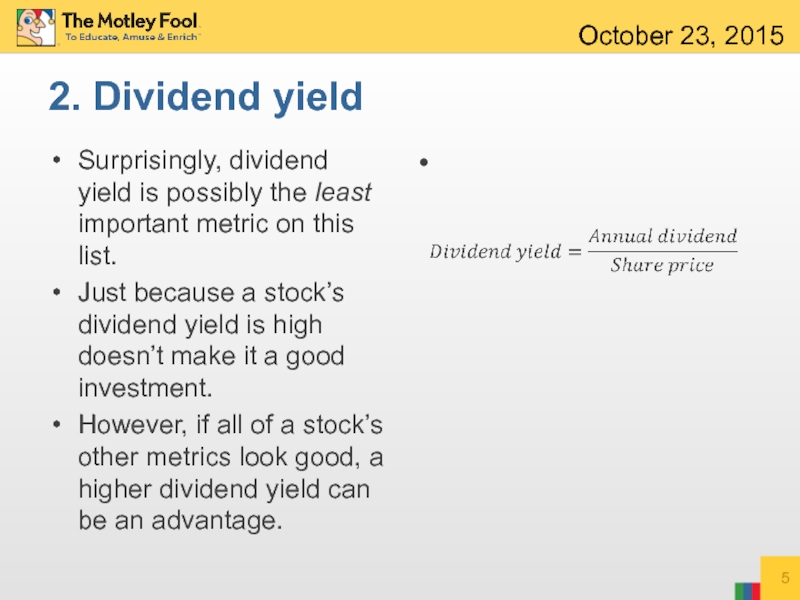
Слайд 52. Dividend yield
Surprisingly, dividend yield is possibly the least important metric
Just because a stock’s dividend yield is high doesn’t make it a good investment.
However, if all of a stock’s other metrics look good, a higher dividend yield can be an advantage.
October 23, 2015
Слайд 6It’s also worth noting that, because dividend yield depends on the
So, in corrections and market crashes, it may be a good time to lock in higher yields on your favorite dividend stocks.
October 23, 2015
Слайд 73. Dividend history and growth
One of the most important factors when
Does the stock pay a dividend every year without fail?
Does the stock have a strong history of increasing its dividend?
While past performance doesn’t guarantee future results, a strong history is likely to continue.
October 23, 2015
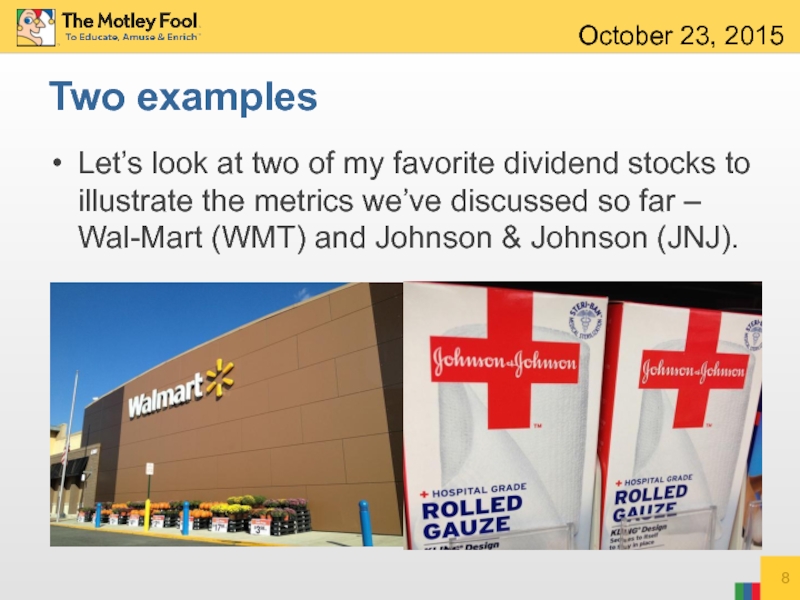
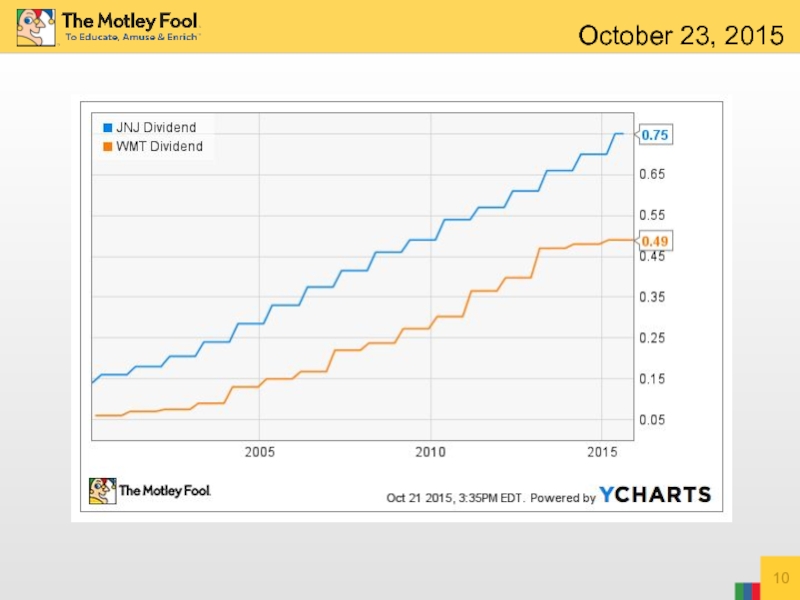
Слайд 8Let’s look at two of my favorite dividend stocks to illustrate
October 23, 2015
Two examples
Слайд 9Wal-Mart has a dividend yield of 3.33%, and a strong 41%
Johnson & Johnson pays a slightly lower 3.05% yield and has a 57% payout ratio – and has increased its dividend for 52 consecutive years. In other words, the last time Johnson & Johnson shareholders didn’t get a dividend increase was in the early 1960s!
October 23, 2015
Two examples
Слайд 114. Interest coverage
Also known as “debt coverage,” this metric tells us
For example, an interest coverage ratio of 4.0:1 means that for every $1 in interest owed, the company earns $4.
October 23, 2015
Слайд 12Interest coverage tells us whether a company will be able to
For example, Wal-Mart has interest coverage of 11.2:1, meaning that only a small percentage of its profits are used for paying debts, so the company could absorb a large profit decline relatively easily.
October 23, 2015
Слайд 135. Total return
A stock’s dividend is only one part of an
Total return incorporates both dividend yield and share price appreciation.
For example, if a stock pays a 4% dividend and its share price rises by 10%, its total return is 14%.
A stock with a high total return can build incredible wealth over long periods of time.
October 23, 2015
Слайд 14Wal-Mart and Johnson & Johnson have produced average annual total returns
To put this in perspective, if you had invested $10,000 in each of these stocks in 1995, you would have nearly $125,000 today!
October 23, 2015
Слайд 156. EPS and revenue growth
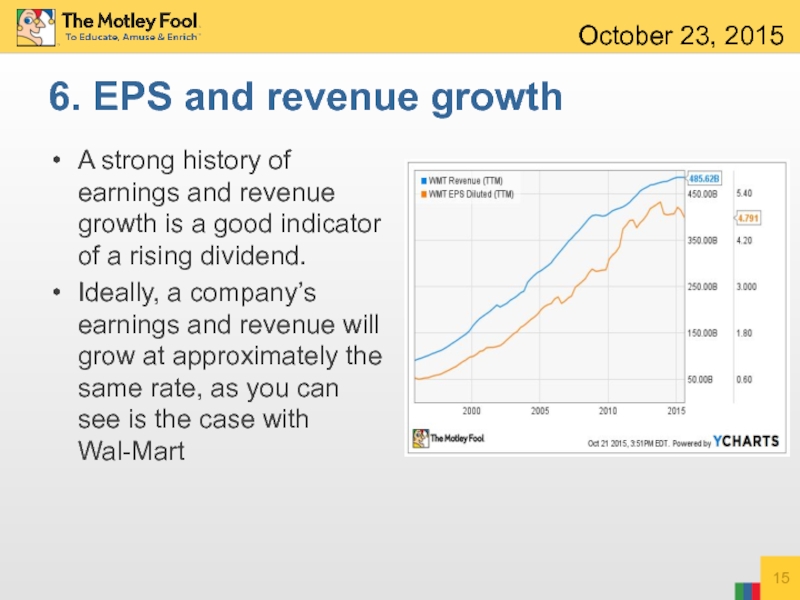
A strong history of earnings and revenue
Ideally, a company’s earnings and revenue will grow at approximately the same rate, as you can see is the case with Wal-Mart
October 23, 2015
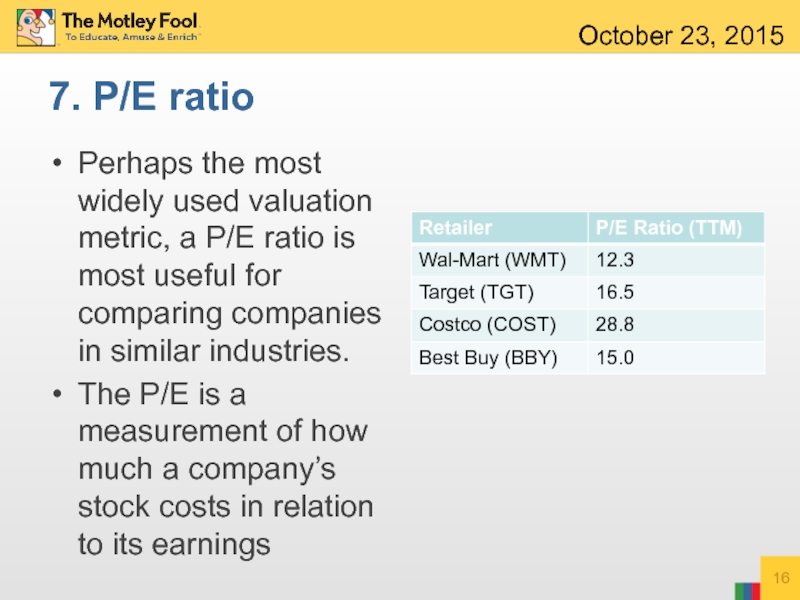
Слайд 167. P/E ratio
Perhaps the most widely used valuation metric, a P/E
The P/E is a measurement of how much a company’s stock costs in relation to its earnings
October 23, 2015
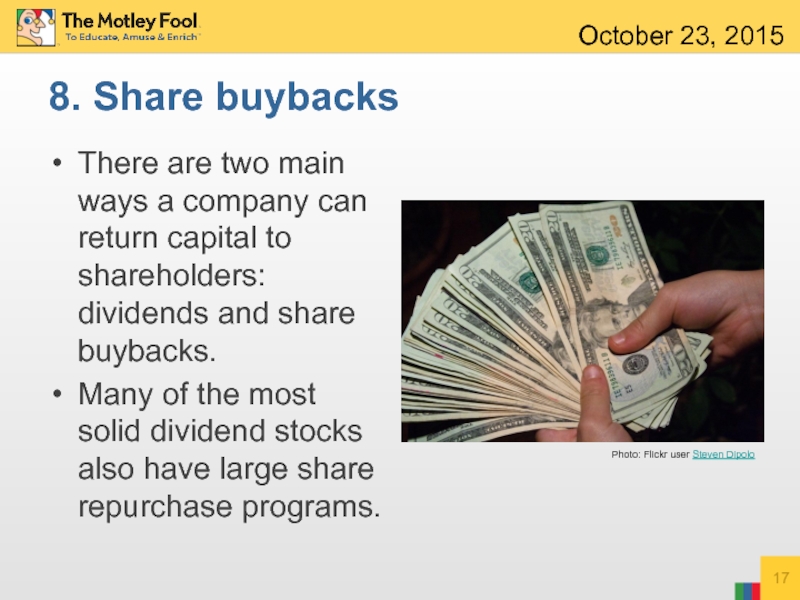
Слайд 178. Share buybacks
There are two main ways a company can return
Many of the most solid dividend stocks also have large share repurchase programs.
October 23, 2015
Photo: Flickr user Steven Dipolo
Слайд 18Many investors actually prefer share buybacks to dividends.
Dividends paid to investors
Plus, most long-term investors reinvest their dividends anyway.
October 23, 2015
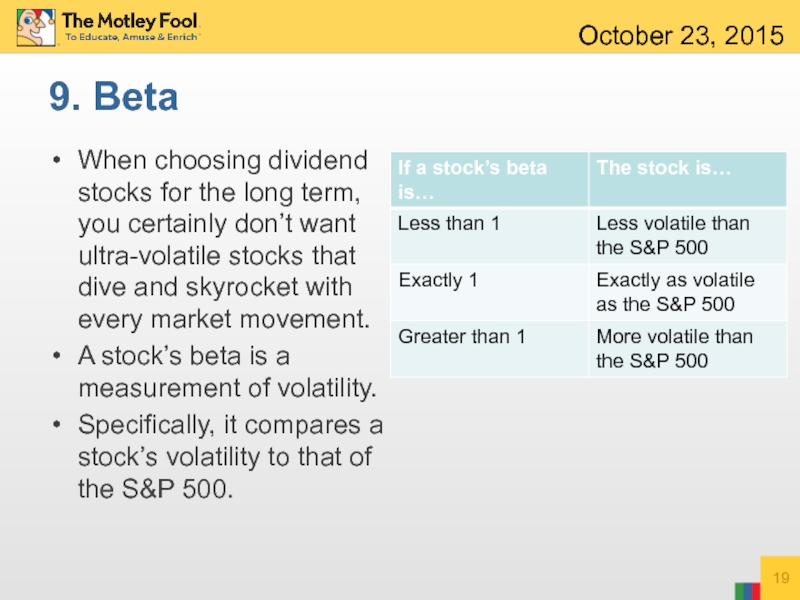
Слайд 199. Beta
When choosing dividend stocks for the long term, you certainly
A stock’s beta is a measurement of volatility.
Specifically, it compares a stock’s volatility to that of the S&P 500.
October 23, 2015
Слайд 20Johnson & Johnson has a beta of 0.6, meaning it is
So, if the S&P drops by 10%, your shares of Johnson & Johnson can be expected to fall by approximately 6%
October 23, 2015
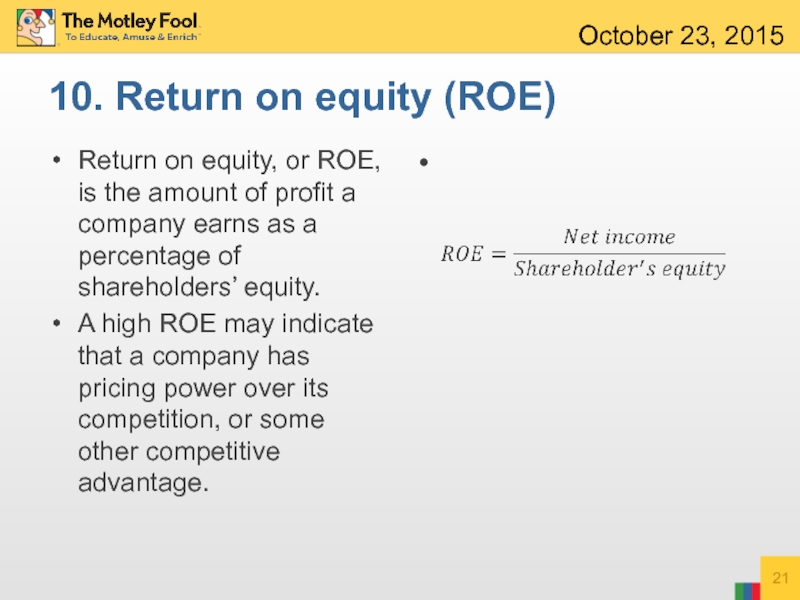
Слайд 2110. Return on equity (ROE)
Return on equity, or ROE, is the
A high ROE may indicate that a company has pricing power over its competition, or some other competitive advantage.
October 23, 2015
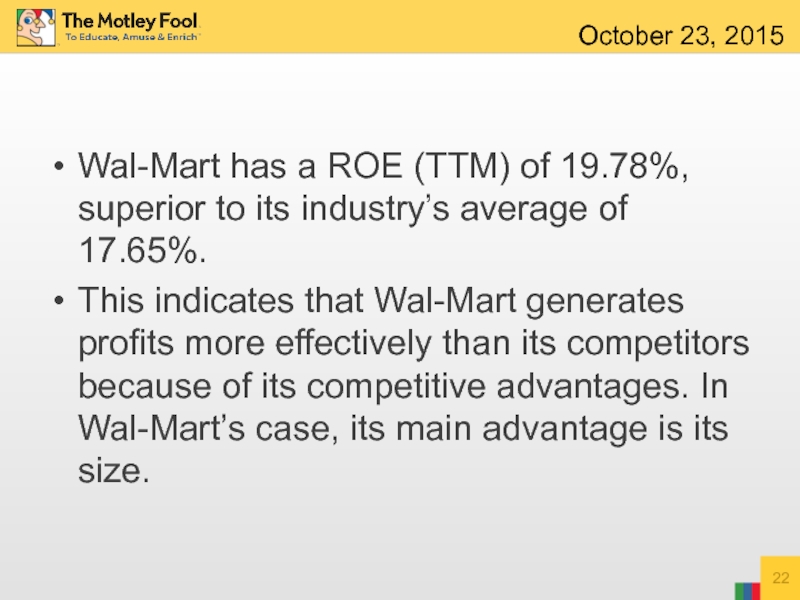
Слайд 22Wal-Mart has a ROE (TTM) of 19.78%, superior to its industry’s
This indicates that Wal-Mart generates profits more effectively than its competitors because of its competitive advantages. In Wal-Mart’s case, its main advantage is its size.
October 23, 2015
