- Главная
- Разное
- Дизайн
- Бизнес и предпринимательство
- Аналитика
- Образование
- Развлечения
- Красота и здоровье
- Финансы
- Государство
- Путешествия
- Спорт
- Недвижимость
- Армия
- Графика
- Культурология
- Еда и кулинария
- Лингвистика
- Английский язык
- Астрономия
- Алгебра
- Биология
- География
- Детские презентации
- Информатика
- История
- Литература
- Маркетинг
- Математика
- Медицина
- Менеджмент
- Музыка
- МХК
- Немецкий язык
- ОБЖ
- Обществознание
- Окружающий мир
- Педагогика
- Русский язык
- Технология
- Физика
- Философия
- Химия
- Шаблоны, картинки для презентаций
- Экология
- Экономика
- Юриспруденция
Working Capital презентация
Содержание
- 1. Working Capital
- 2. Управление оборотным капиталом Вы кому-то дали деньги
- 3. Управление оборотным капиталом Собрать деньги, которые Вам
- 4. Working Capital Presentation description and
- 5. Working Capital overview Presentation description and
- 6. Working Capital -AR Presentation description and
- 7. Working Capital - Inventory Presentation description and
- 8. Working Capital - AP Presentation description and
- 9. Dividends Dividends for 2004-2006
- 12. WC -
- 13. WC
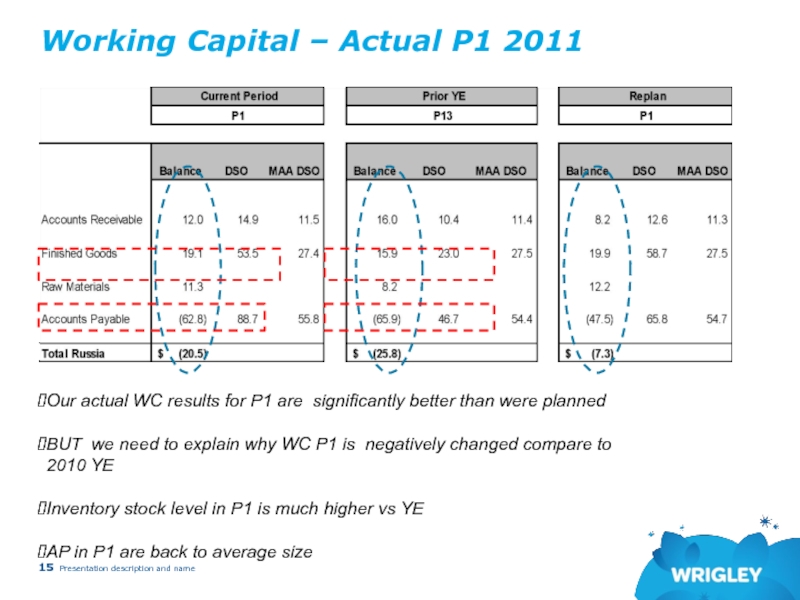
- 15. Working Capital – Actual P1 2011
Слайд 2Управление оборотным капиталом
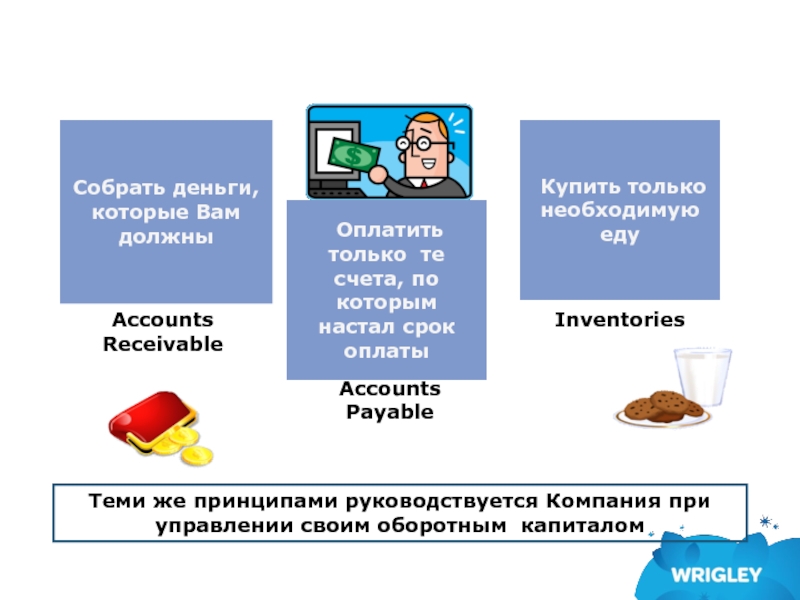
Вы кому-то дали деньги в долг
Вам надо оплатить
Вам надо купить еду
Что делать???
Слайд 3Управление оборотным капиталом
Собрать деньги, которые Вам должны
Оплатить только те счета,
Купить только необходимую еду
Теми же принципами руководствуется Компания при управлении своим оборотным капиталом
Accounts Receivable
Accounts Payable
Inventories
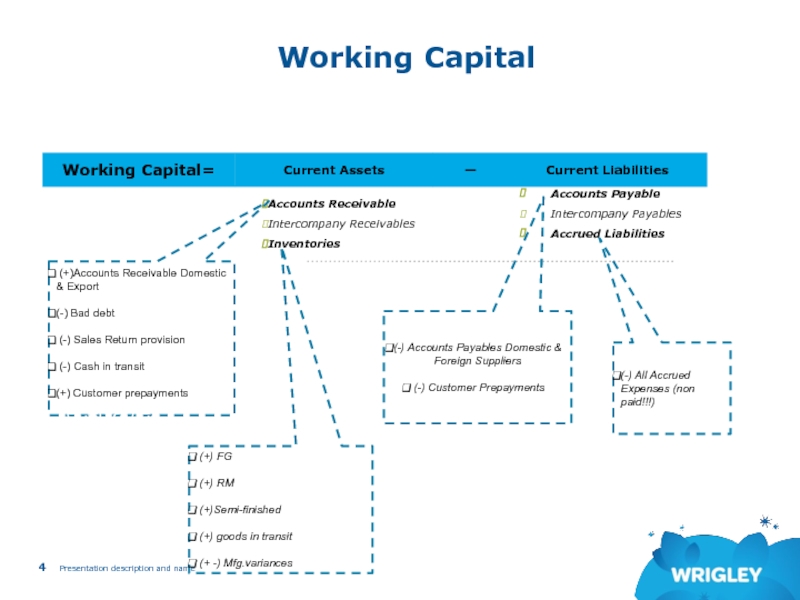
Слайд 4 Working Capital
Presentation description and name
Accounts Receivable
Intercompany Receivables
Inventories
Accounts Payable
Intercompany Payables
Accrued Liabilities
(-) Bad debt
(-) Sales Return provision
(-) Cash in transit
(+) Customer prepayments
receivables
(+) FG
(+) RM
(+)Semi-finished
(+) goods in transit
(+ -) Mfg.variances
(-) Accounts Payables Domestic & Foreign Suppliers
(-) Customer Prepayments
(-) All Accrued Expenses (non paid!!!)
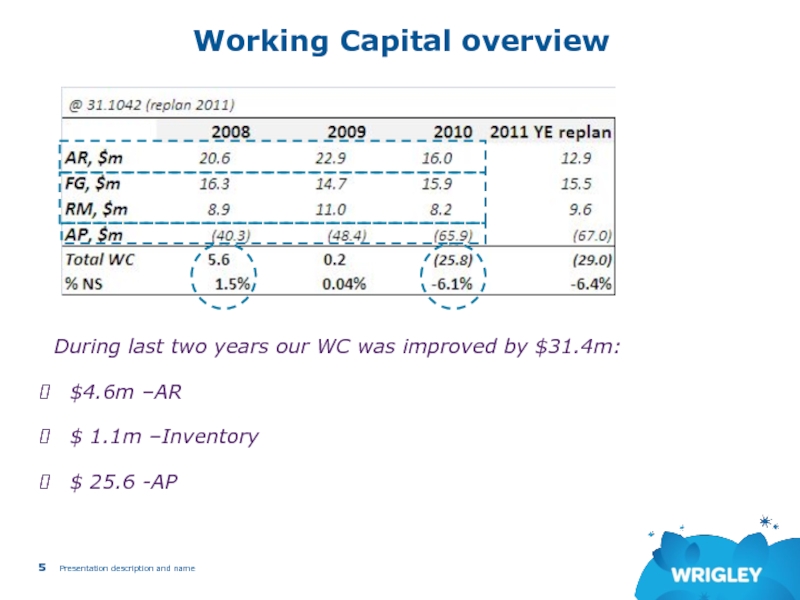
Слайд 5Working Capital overview
Presentation description and name
During last two years our
$4.6m –AR
$ 1.1m –Inventory
$ 25.6 -AP
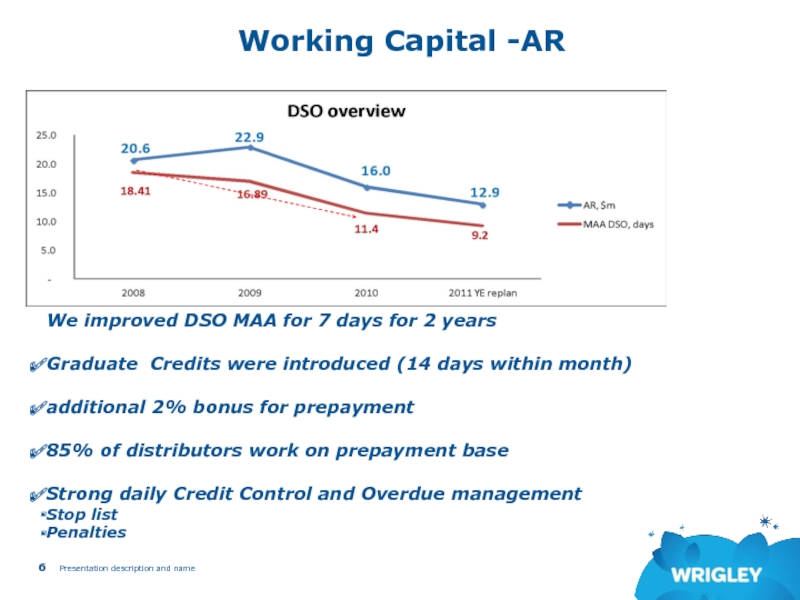
Слайд 6Working Capital -AR
Presentation description and name
We improved DSO MAA for 7
Graduate Credits were introduced (14 days within month)
additional 2% bonus for prepayment
85% of distributors work on prepayment base
Strong daily Credit Control and Overdue management
Stop list
Penalties
Слайд 7Working Capital - Inventory
Presentation description and name
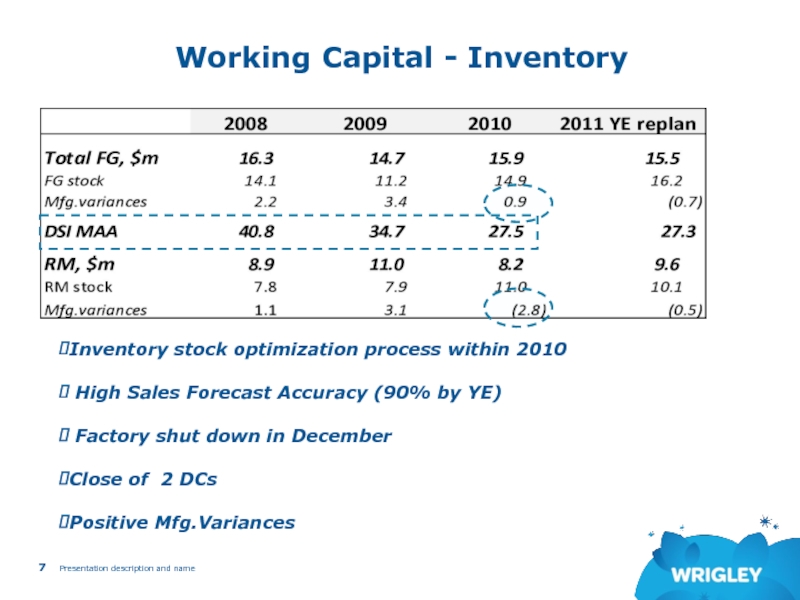
Inventory stock optimization process within
High Sales Forecast Accuracy (90% by YE)
Factory shut down in December
Close of 2 DCs
Positive Mfg.Variances
Слайд 8Working Capital - AP
Presentation description and name
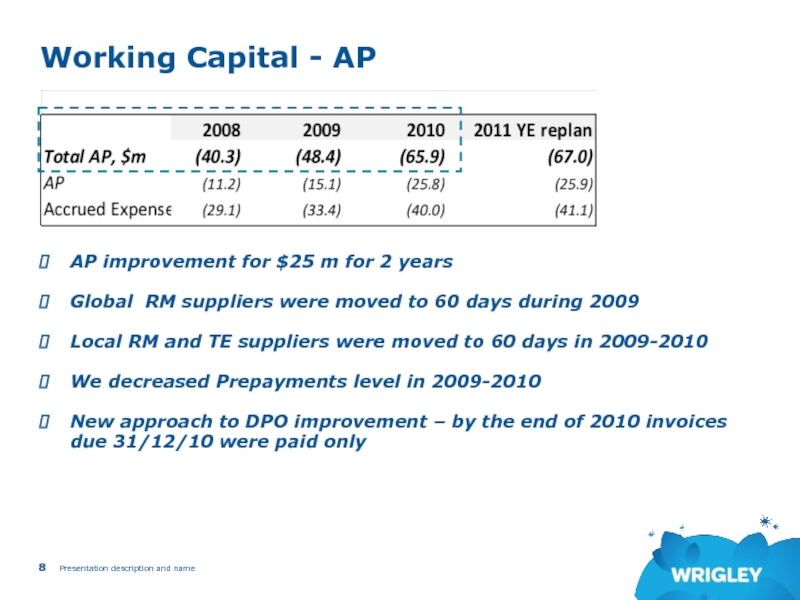
AP improvement for $25 m
Global RM suppliers were moved to 60 days during 2009
Local RM and TE suppliers were moved to 60 days in 2009-2010
We decreased Prepayments level in 2009-2010
New approach to DPO improvement – by the end of 2010 invoices due 31/12/10 were paid only
Слайд 9Dividends
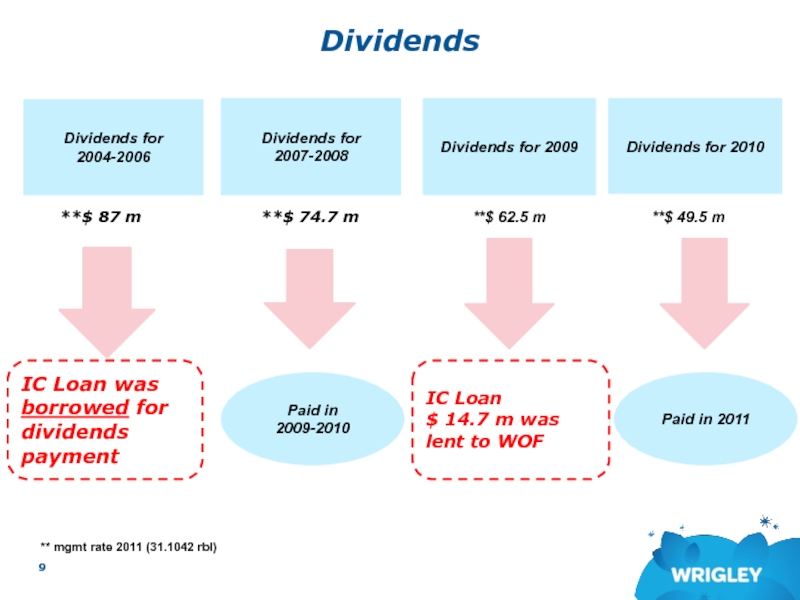
Dividends for 2004-2006
Paid in 2007
Dividends for 2007-2008
Paid in 2009-2010
Dividends
**$ 74.7 m
$47.1m paid in 2010;
$15.4 m paid in 2011
**$ 87 m
**$ 62.5 m
** mgmt rate 2011 (31.1042 rbl)
IC Loan was borrowed for dividends payment
IC Loan
$ 14.7 m was lent to WOF
Dividends for 2010
**$ 49.5 m
Paid in 2011
Слайд 10 Working Capital 2010
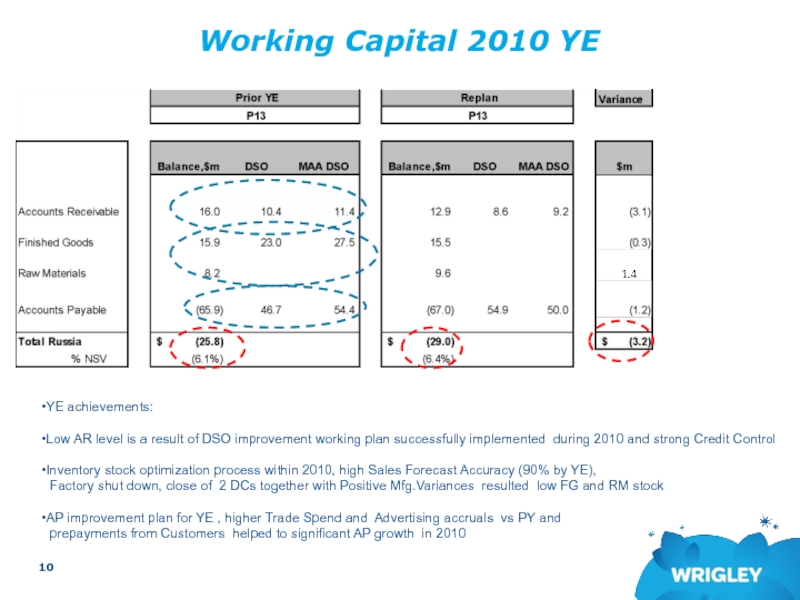
YE achievements:
Low AR level is a result of DSO improvement working plan successfully implemented during 2010 and strong Credit Control
Inventory stock optimization process within 2010, high Sales Forecast Accuracy (90% by YE),
Factory shut down, close of 2 DCs together with Positive Mfg.Variances resulted low FG and RM stock
AP improvement plan for YE , higher Trade Spend and Advertising accruals vs PY and
prepayments from Customers helped to significant AP growth in 2010
Слайд 11
Presentation description and name
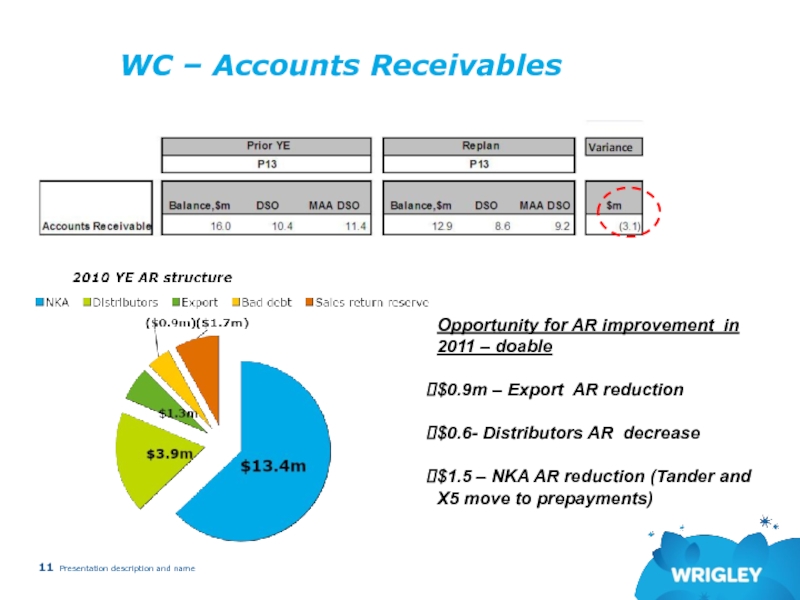
Opportunity for AR improvement in 2011 – doable
$0.9m – Export AR reduction
$0.6- Distributors AR decrease
$1.5 – NKA AR reduction (Tander and X5 move to prepayments)
Слайд 12 WC - Accounts Payables
Presentation description and
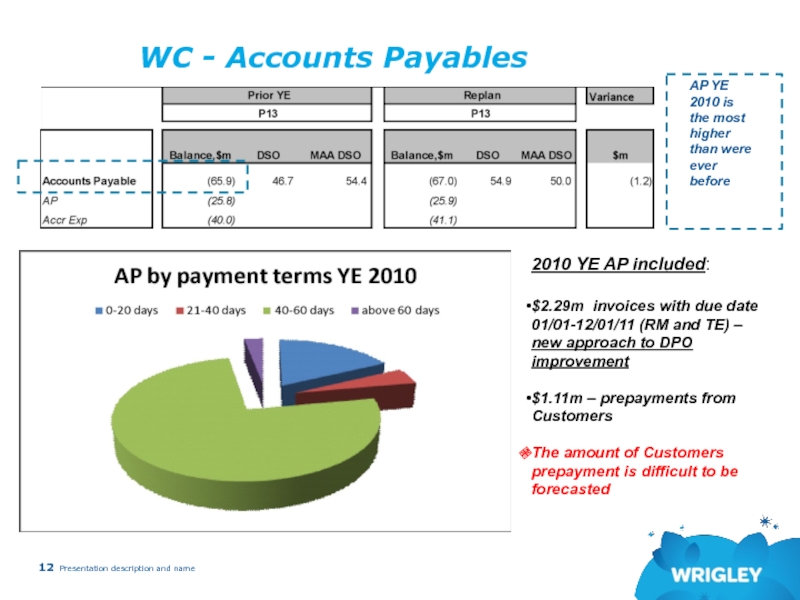
2010 YE AP included:
$2.29m invoices with due date 01/01-12/01/11 (RM and TE) – new approach to DPO improvement
$1.11m – prepayments from Customers
The amount of Customers prepayment is difficult to be forecasted
We a
AP YE 2010 is the most higher than were ever before
Слайд 13 WC - Accounts Payables
Presentation description and name
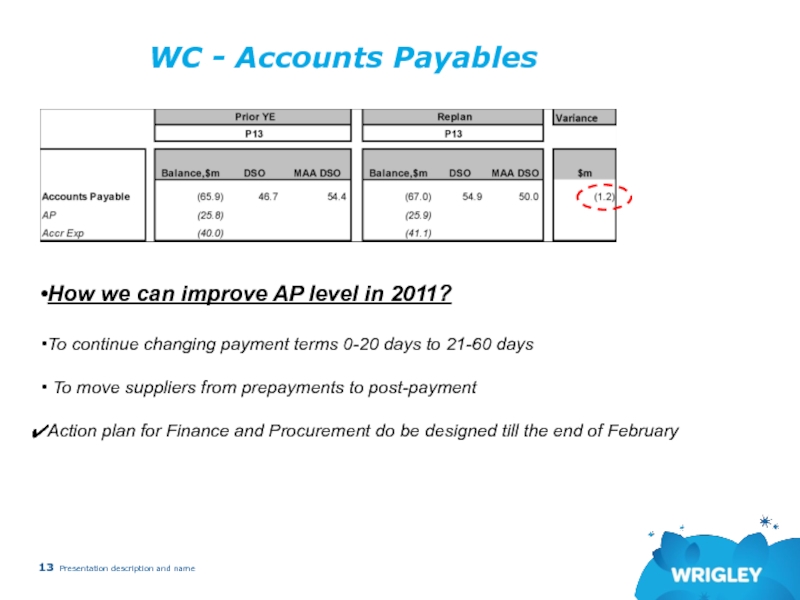
How we can improve AP level in 2011?
To continue changing payment terms 0-20 days to 21-60 days
To move suppliers from prepayments to post-payment
Action plan for Finance and Procurement do be designed till the end of February
Слайд 14 WC –
Presentation description and name
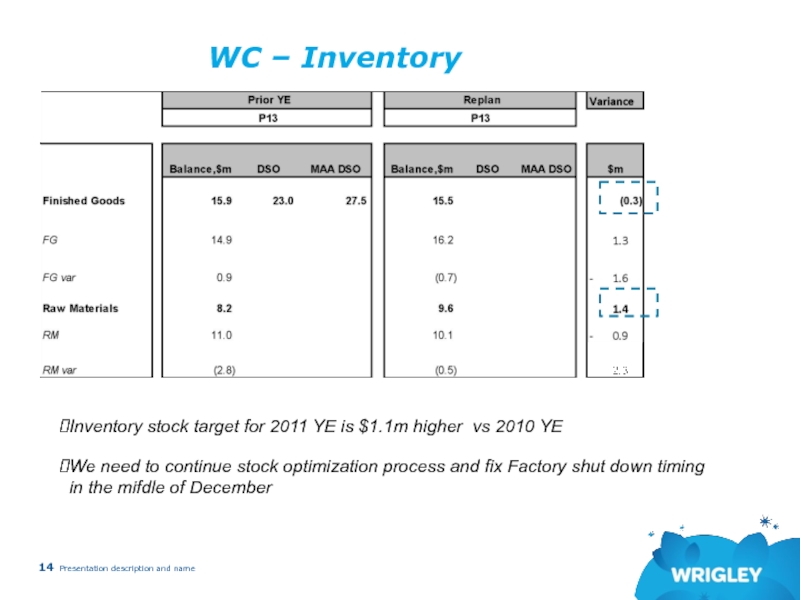
Inventory stock target for 2011 YE is $1.1m higher vs 2010 YE
We need to continue stock optimization process and fix Factory shut down timing
in the mifdle of December
Слайд 15Working Capital – Actual P1 2011
Presentation description and name
Our actual WC
BUT we need to explain why WC P1 is negatively changed compare to 2010 YE
Inventory stock level in P1 is much higher vs YE
AP in P1 are back to average size


