- Главная
- Разное
- Дизайн
- Бизнес и предпринимательство
- Аналитика
- Образование
- Развлечения
- Красота и здоровье
- Финансы
- Государство
- Путешествия
- Спорт
- Недвижимость
- Армия
- Графика
- Культурология
- Еда и кулинария
- Лингвистика
- Английский язык
- Астрономия
- Алгебра
- Биология
- География
- Детские презентации
- Информатика
- История
- Литература
- Маркетинг
- Математика
- Медицина
- Менеджмент
- Музыка
- МХК
- Немецкий язык
- ОБЖ
- Обществознание
- Окружающий мир
- Педагогика
- Русский язык
- Технология
- Физика
- Философия
- Химия
- Шаблоны, картинки для презентаций
- Экология
- Экономика
- Юриспруденция
The Labor Market презентация
Содержание
- 1. The Labor Market
- 2. 6-1 A Tour of the Labor Market
- 3. 6-1 A Tour of the Labor Market
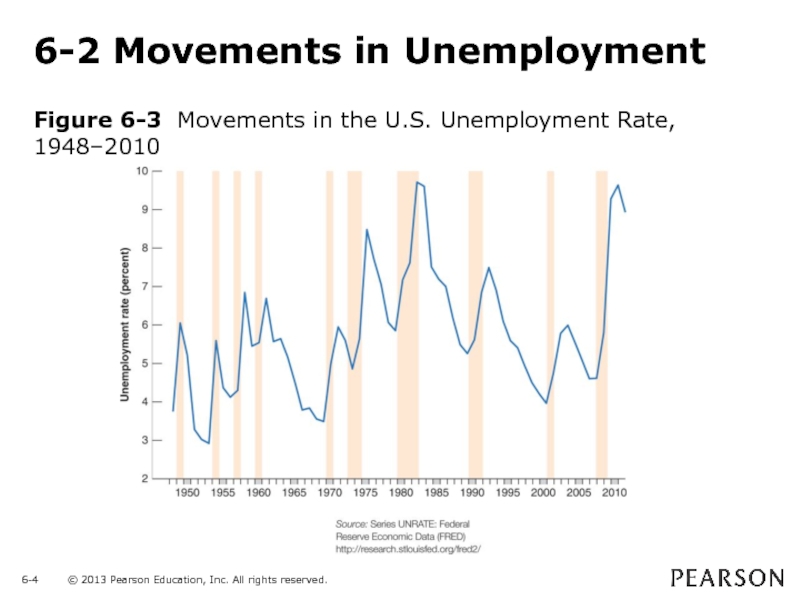
- 4. 6-2 Movements in Unemployment Figure 6-3 Movements in the U.S. Unemployment Rate, 1948–2010
- 5. 6-2 Movements in Unemployment Figure 6-4 The
- 6. 6-2 Movements in Unemployment Figure 6-5 The
- 7. Focus: Henry Ford and Efficiency Wages Table
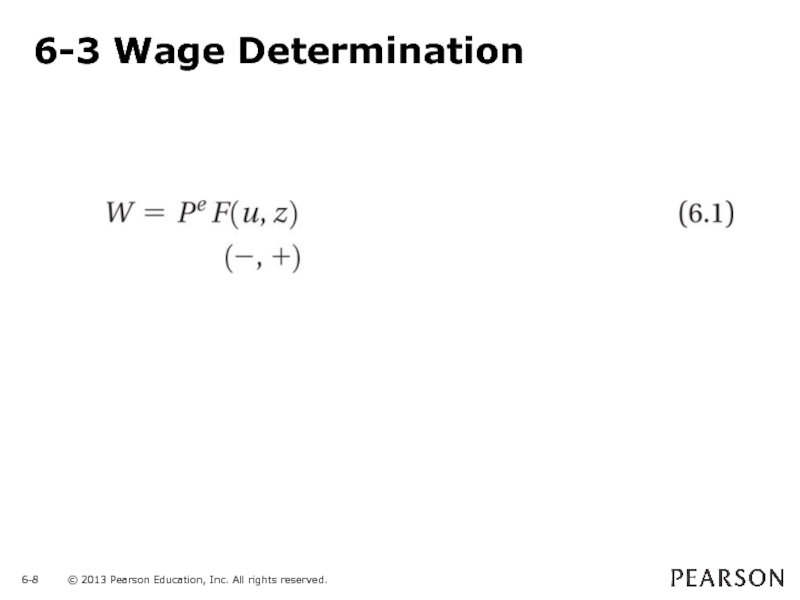
- 8. 6-3 Wage Determination
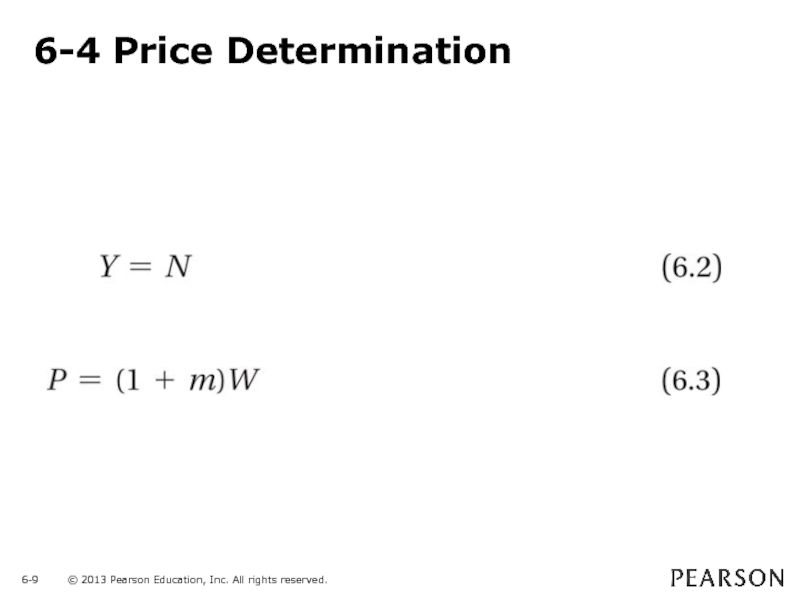
- 9. 6-4 Price Determination
- 10. 6-5 The Natural Rate of Unemployment
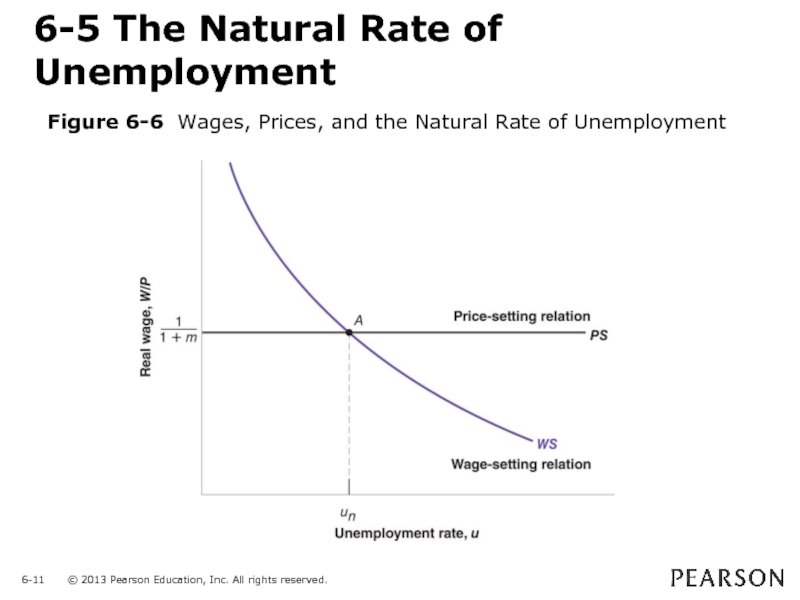
- 11. 6-5 The Natural Rate of Unemployment Figure
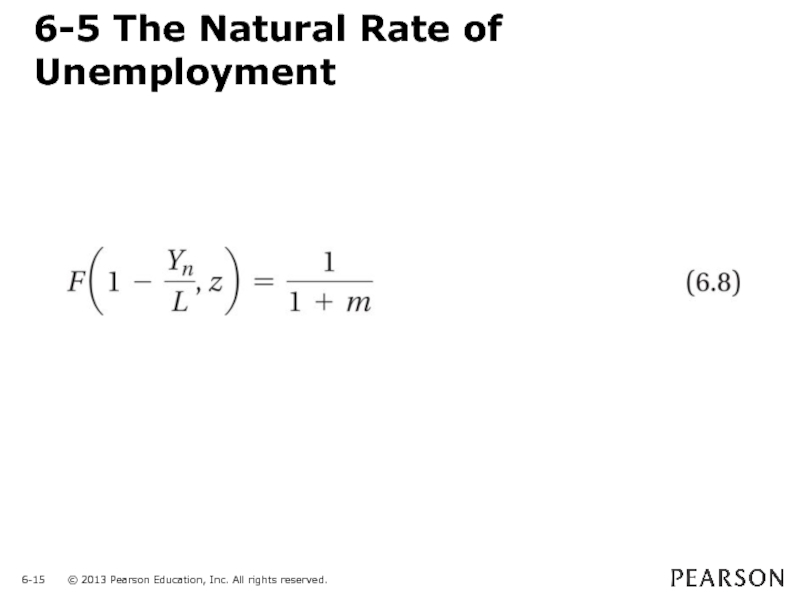
- 12. 6-5 The Natural Rate of Unemployment
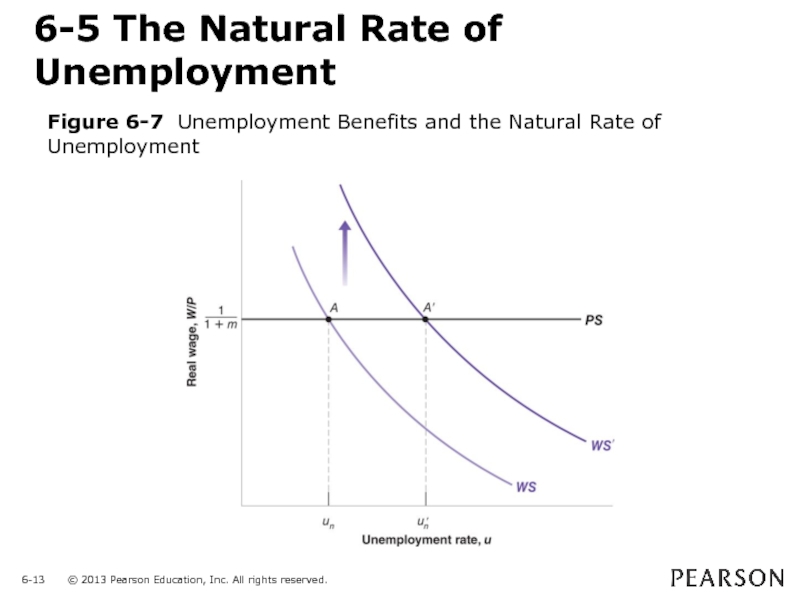
- 13. 6-5 The Natural Rate of Unemployment Figure
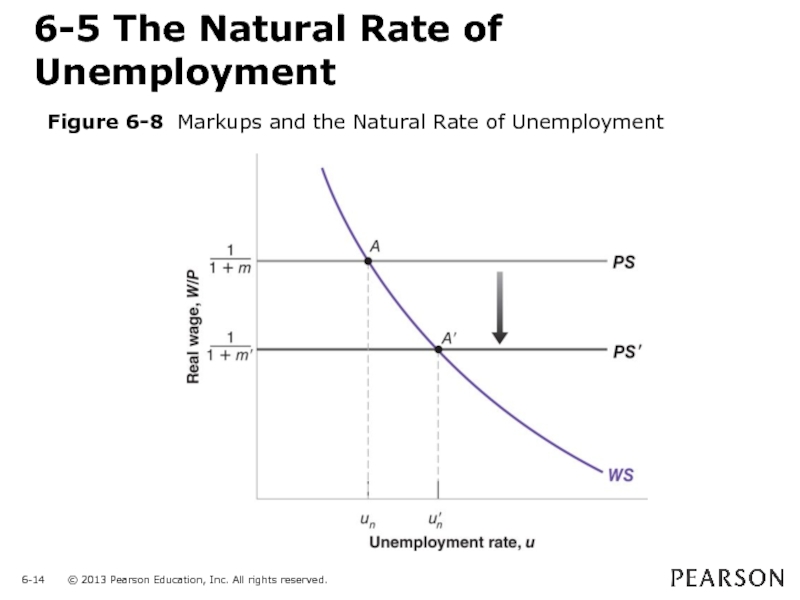
- 14. 6-5 The Natural Rate of Unemployment Figure 6-8 Markups and the Natural Rate of Unemployment
- 15. 6-5 The Natural Rate of Unemployment
- 16. Appendix: Wage- and Price-Setting Relations versus Labor
Слайд 26-1 A Tour of the Labor Market
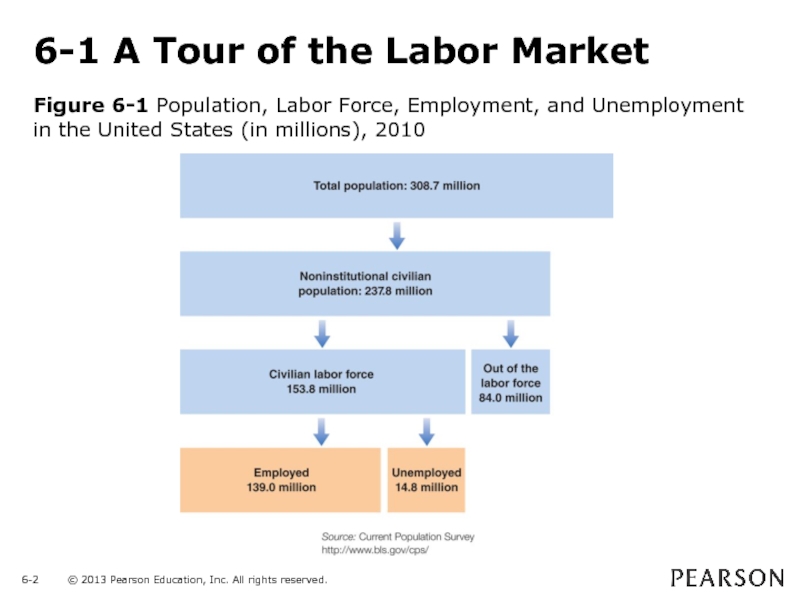
Figure 6-1 Population, Labor Force,
Employment, and Unemployment in the United States (in millions), 2010
Слайд 36-1 A Tour of the Labor Market
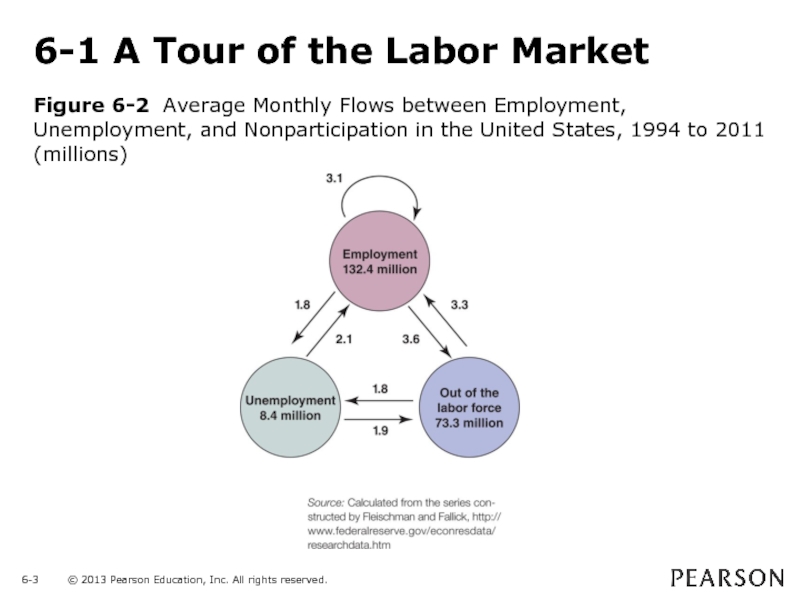
Figure 6-2 Average Monthly Flows
between Employment, Unemployment, and Nonparticipation in the United States, 1994 to 2011 (millions)
Слайд 56-2 Movements in Unemployment
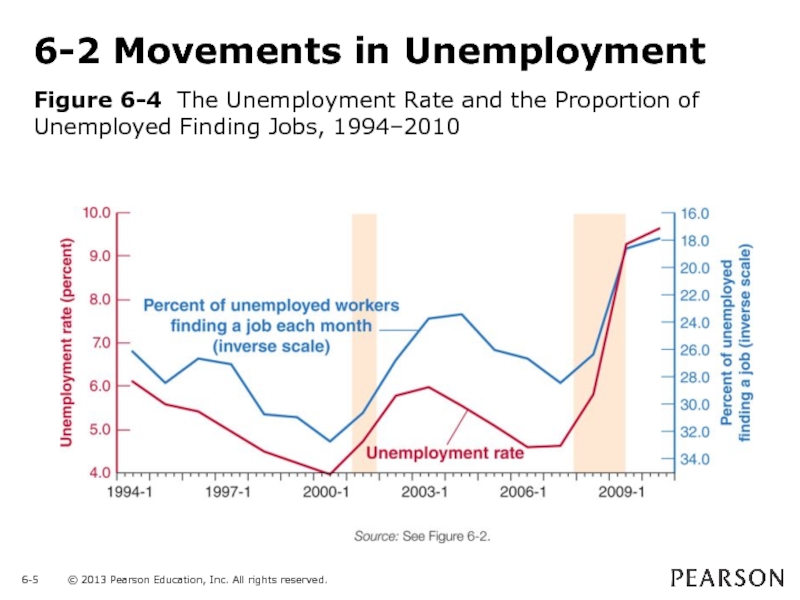
Figure 6-4 The Unemployment Rate and the Proportion
of Unemployed Finding Jobs, 1994–2010
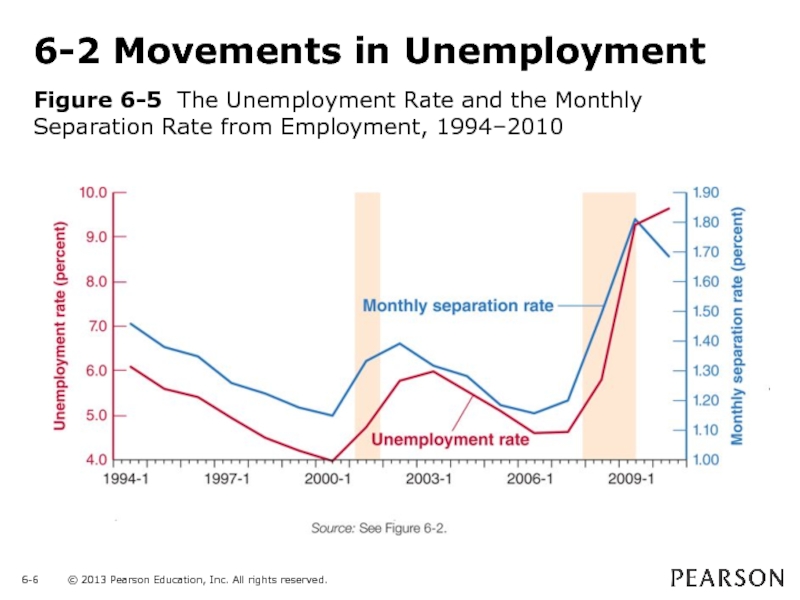
Слайд 66-2 Movements in Unemployment
Figure 6-5 The Unemployment Rate and the Monthly
Separation Rate from Employment, 1994–2010
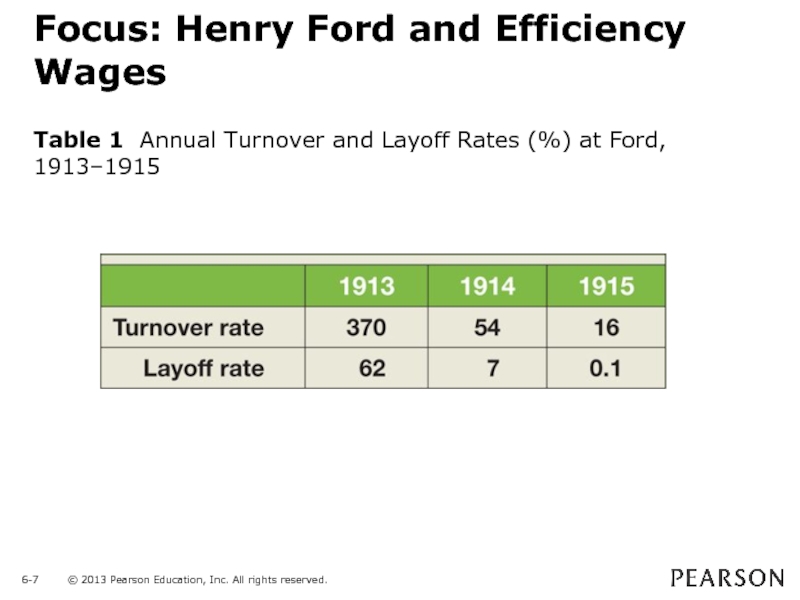
Слайд 7Focus: Henry Ford and Efficiency Wages
Table 1 Annual Turnover and Layoff
Rates (%) at Ford, 1913–1915
Слайд 116-5 The Natural Rate of Unemployment
Figure 6-6 Wages, Prices, and the
Natural Rate of Unemployment
Слайд 136-5 The Natural Rate of Unemployment
Figure 6-7 Unemployment Benefits and the
Natural Rate of Unemployment
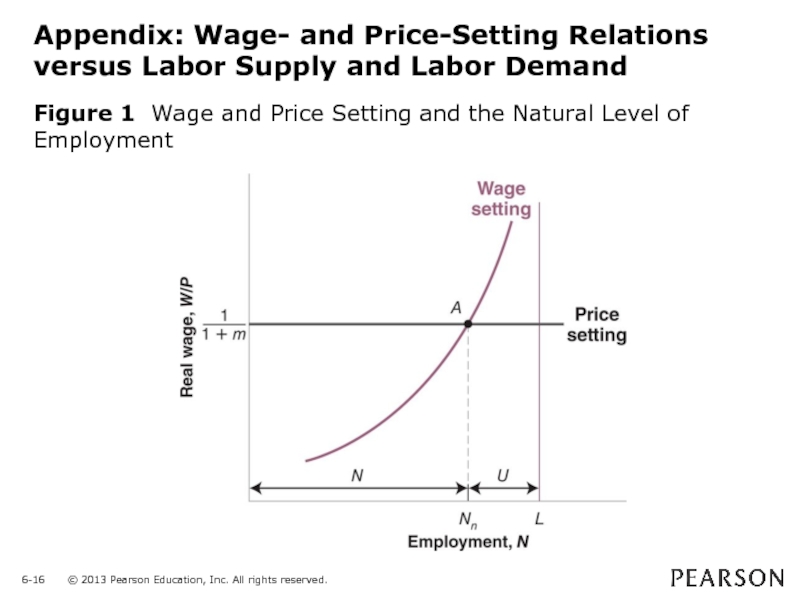
Слайд 16Appendix: Wage- and Price-Setting Relations versus Labor Supply and Labor Demand
Figure
1 Wage and Price Setting and the Natural Level of Employment

