- Главная
- Разное
- Дизайн
- Бизнес и предпринимательство
- Аналитика
- Образование
- Развлечения
- Красота и здоровье
- Финансы
- Государство
- Путешествия
- Спорт
- Недвижимость
- Армия
- Графика
- Культурология
- Еда и кулинария
- Лингвистика
- Английский язык
- Астрономия
- Алгебра
- Биология
- География
- Детские презентации
- Информатика
- История
- Литература
- Маркетинг
- Математика
- Медицина
- Менеджмент
- Музыка
- МХК
- Немецкий язык
- ОБЖ
- Обществознание
- Окружающий мир
- Педагогика
- Русский язык
- Технология
- Физика
- Философия
- Химия
- Шаблоны, картинки для презентаций
- Экология
- Экономика
- Юриспруденция
The data of macroeconomics презентация
Содержание
- 1. The data of macroeconomics
- 2. 2.1 Measuring the Value of Economic Activity:
- 3. 02. The Data of Macroeconomics It is
- 4. 2.1 Gross Domestic Product
- 5. 2.1 Gross Domestic Product There are
- 6. 2.1 Measuring the Value of Economic Activity:
- 7. A stock is a quantity measured at
- 8. A person’s wealth is a stock;
- 9. A person’s wealth is a stock;
- 10. GDP
- 11. Intermediate Goods and Value Added GDP is
- 12. Housing Services and Other Imputations Some G&S
- 14. The imperfections are most PROBLEMATIC
- 15. E X A M P L E
- 16. GDP deflator or implicit price deflator
- 17. Chain-weighted measures of real GDP, 1995
- 18. TWO ARITHMETIC TRICKS FOR WORKING
- 19. The national income accounts divide GDP into
- 20. WHAT IS INVESTMENT?
- 21. GDP AND ITS COMPONENTS
- 22. GNP Gross national product = GDP
- 23. NI national income ≈NNP They two differ
- 24. I - Workers 1 Compensation of employees
- 25. Personal Income = National
- 26. Most of the economic statistics reported in
- 27. The increase in the overall level of
- 28. The PRODUCER price index, a typical
- 29. GDP deflator measures the prices of All
- 30. The GDP Deflator and the CPI
- 31. 2-2 Measuring the Cost of Living: The
- 32. Why the CPI
- 33. Cavallo and Rigobon collect data on the
- 34. The unemployment rate is the statistic that
- 35. Who wants a job but has given
- 37. TRENDS IN LABOR-FORCE PARTICIPATION Labor-Force Participation. Over
- 38. 2-3 Measuring Joblessness: The Unemployment Rate The Household Survey The Establishment Survey
- 39. 2-4 Conclusion: From Economic Statistics to Economic

Слайд 22.1 Measuring the Value of Economic Activity: Gross Domestic Product
2-2
2-3 Measuring Joblessness: The Unemployment Rate
2-4 Conclusion: From Economic Statistics to
Economic Models
02. The Data of Macroeconomics
GDP
U
CPI

Слайд 302. The Data of Macroeconomics
It is a capital mistake to theorize
Sherlock Holmes
We focus on the three statistics:
GDP
tells us the nation’s total income and the total expenditure on its output of G&S.
CPI
measures the level of prices.
U
tells us the fraction of workers who are unemployed.
Policymakers use them to
monitor developments;
formulate policies.
Economists use statistics to
study the economy


Слайд 52.1 Gross Domestic Product
There are 2 ways to view GDP
Income must equal expenditure.
When Baurzhan paints Gaukhar’s house for $1,000, that $1,000 is
income to Baurzhan and
expenditure by Gaukhar.
To understand GDP more fully,
we turn to national income accounting:
the accounting system used to measure
GDP and
many related statistics.

Слайд 62.1 Measuring the Value of Economic Activity: Gross Domestic Product
Income,
Rules for Computing GDP
Real GDP Versus Nominal GDP;The GDP Deflator

Слайд 7A stock is a quantity measured at a given point in
A flow is a quantity measured per unit of time.
The bathtub contains 50 gallons of water
but that
Water is coming out of the faucet at 5 gallons per minute.
STOCKS AND FLOWS
We measure
stocks
and
flows
in
different units.

Слайд 8A person’s wealth is a stock;
his income and expenditure are
The number of unemployed people is a stock;
the number of people losing their jobs is a flow.
The amount of capital in the economy is a stock;
the amount of investment is a flow.
The government debt is a stock;
the government budget deficit is a flow.
Questions

Слайд 9A person’s wealth is a stock;
his income and expenditure are
The number of unemployed people is a stock;
the number of people losing their jobs is a flow.
The amount of capital in the economy is a stock;
the amount of investment is a flow.
The government debt is a stock;
the government budget deficit is a flow.
Answers

Слайд 10
GDP = (Price of Apples × Quantity of Apples)
+ (Price of
= ($0.50 × 4) + ($1.00 × 3) = $5.00.
Used Goods
GDP measures the value of currently produced G&S.
The Treatment of Inventories
If produced G&S spoil, it does not alter GDP.
If produced G&S is put into inventory, GDP rises.
2.1 Gross Domestic Product
Income, Expenditure, and the Circular Flow
Rules for Computing GDP
Real GDP Versus Nominal GDP;The GDP Deflator
GDP is
1) the market value of
2) all final G&S
3) produced within an economy
4) in a given period of time.
+ (Price of Oranges × Quantity of")
Слайд 11Intermediate Goods and Value Added
GDP is the total value of final
Examle
A cattle rancher sells meat to McDonald’s for $1, and then
McDonald’s sells you a hamburger for $3.
The value added of the rancher is $1, and
the value added of McDonald’s is $2 or $3 – $1,
Total value added is $1 + $2 = $3.
2.1 Measuring the Value of Economic Activity: Gross Domestic Product
Income, Expenditure, and the Circular Flow
Rules for Computing GDP
Real GDP Versus Nominal GDP;The GDP Deflator
GDP = $4 (1+3)
or
GDP = $3 ?
The value added of a firm equals (=)
the value of the firm’s OUTPUT less (-)
the value of the intermediate goods that the firm purchases

Слайд 12Housing Services and Other Imputations
Some G&S are
not sold in the
do not have market prices.
For GDP, we must use an estimate of their value.
Such an estimate is called an IMPUTED VALUE.
2.1 Measuring the Value of Economic Activity: Gross Domestic Product
Income, Expenditure, and the Circular Flow
Rules for Computing GDP
Real GDP Versus Nominal GDP;The GDP Deflator

Слайд 13
2.1 Measuring the Value of Economic Activity: Gross Domestic Product
Income,
Rules for Computing GDP
Real GDP Versus Nominal GDP;The GDP Deflator
Chain-Weighted Measures of Real GDP
The Components of Expenditure
Other Measures of Income; Seasonal Adjustment

Слайд 14
The imperfections are most PROBLEMATIC
when comparing standards of living across
The imperfections remains fairly constant over time =>
GDP is USEFUL for comparing economic activity from year to year.
2.1 Measuring the Value of Economic Activity: Gross Domestic Product
Income, Expenditure, and the Circular Flow
Rules for Computing GDP
Real GDP Versus Nominal GDP;The GDP Deflator
Chain-Weighted Measures of Real GDP
The Components of Expenditure
Other Measures of Income; Seasonal Adjustment

Слайд 15E X A M P L E
Real GDP in 2011
Real GDP = (2011 Price of Apples × 2011 Quantity of Apples)
+ (2011 Price of Oranges × 2011 Quantity of Oranges).
Real GDP in 2012 would be
Real GDP = (_______ Price of Apples × _____ Quantity of Apples)
+ (2011 Price of Oranges × 2012 Quantity of Oranges).
Real GDP in 2013 would be
Real GDP = (_____ Price of Apples × _________ Quantity of Apples)
+ (_______ Price of Oranges × _______ Quantity of Oranges).
2.1 Measuring the Value of Economic Activity: Gross Domestic Product
The value of G&S measured at current prices is nominal GDP.
Real GDP is the value of G&S measured using a constant set of prices.

Слайд 16GDP deflator or
implicit price deflator for GDP,
is the ratio
The GDP deflator measures
the price of output relative to
its price in the base year.
A new base year updates about every 5 years.
2.1 Gross Domestic Product
Income, Expenditure, and the Circular Flow
Rules for Computing GDP
Real GDP Versus Nominal GDP
The GDP Deflator

Слайд 17Chain-weighted measures of real GDP, 1995
The base year changes continuously
This CWM of RGDP is better than the more traditional measure because -
it ensures that the prices are never far out of date.
2.1 Measuring the Value of Economic Activity: Gross Domestic Product
Chain-Weighted Measures of Real GDP
The Components of Expenditure
Other Measures of Income
Seasonal AdjustmenCt
IN ESSENCE,
average prices in 2011 and 2012 are used to measure real
growth from 2011 to 2012,
average prices in 2012 and 2013 are used to measure real
growth from 2012 to 2013, and so on.


Слайд 19The national income accounts divide GDP into four broad categories
of spending:
2.1
This equation is
an national income accounts
identity.
Net exports are
the value of G&S sold to other countries (exports) minus
the value of G&S that foreigners sell us (imports).
Government purchases are
the G&S bought by federal, state, and local governments.
Investment consists of goods bought for future use:
business fixed investment,
residential fixed investment, and
inventory investment
Consumption consists of the G&S bought by
households -
nondurable goods,
durable goods, and
services


Слайд 22GNP
Gross national product = GDP
+ Factor Payments from Abroad
–
GDP measures the total income produced domestically,
GNP measures the total income earned by nationals (residents of a nation).
NNP
Net national product = GNP – Depreciation.
The depreciation—the amount of the economy’s stock of plants, equipment, and residential structures that wears out during the year
Depreciation is also called the consumption of fixed capital.
2.1 Measuring the Value of Economic Activity: Gross Domestic Product
Chain-Weighted Measures of Real GDP
The Components of Expenditure
Other Measures of Income
Seasonal Adjustment

Слайд 23NI
national income ≈NNP
They two differ by a small correction called the
National income measures how much everyone in the economy has earned.
National income includes 6 components, depending on who earns the income.
2.1 Measuring the Value of Economic Activity: Gross Domestic Product
Chain-Weighted Measures of Real GDP
The Components of Expenditure
Other Measures of Income
Seasonal Adjustment

Слайд 24I - Workers
1 Compensation of employees (63%).
II -Firms
2 Corporate profits
The income of corporations
3 Proprietors’ income (8%).
The income of noncorporate businesses
4 Rental income (3%).
The income that landlords receive
5 Net interest (4%).
The interest domestic businesses pay minus the interest they receive, plus interest earned from foreigners.
III - Government
6 - Indirect business taxes (8%).
2.1 Gross Domestic Product
Chain-Weighted Measures of Real GDP
The Components of Expenditure
Other Measures of Income
Seasonal Adjustment
. II -Firms2 Corporate profits (14%). The income of")
Слайд 25Personal Income =
National Income
− Indirect Business Taxes
− Corporate
+ Dividends
− Social Insurance Contributions
+ Government Transfers to Individuals
− Net Interest
+ Personal Interest Income.
Disposable Personal Income
= Personal Income
– Personal Tax and
- Nontax Payments.
2.1 Measuring the Value of Economic Activity: Gross Domestic Product
Chain-Weighted Measures of Real GDP
The Components of Expenditure
Other Measures of Income
Seasonal Adjustment

Слайд 26Most of the economic statistics reported in the newspaper are seasonally
This means that the data have been adjusted to remove the regular seasonal fluctuations.
=> when you observe a rise or fall in real GDP or any other data series, you must look beyond the seasonal cycle for the explanation.
2.1 Measuring the Value of Economic Activity: Gross Domestic Product
Chain-Weighted Measures of Real GDP
The Components of Expenditure
Other Measures of Income
Seasonal Adjustment

Слайд 27The increase in the overall level of prices, called inflation.
The most
For example,
The typical consumer buys 5 apples and 2 oranges every month.
Then the basket of goods consists of 5 apples and 2 oranges, and the CPI is
The index tells us how much it costs now to buy 5 apples and 2 oranges relative to how much it cost to buy the same basket of fruit in 2011.
2-2 Measuring the Cost of Living: The Consumer Price Index
The Price of a Basket of Goods
The CPI Versus the GDP Deflator
Does the CPI Overstate Inflation?

Слайд 28The PRODUCER price index,
a typical basket of goods bought by
price indexes for SPECIFIC TYPES of goods,
food, housing, and energy.
CORE INFLATION STATISTIC
a consumer basket that excludes food and energy products.
2-2 Measuring the Cost of Living: The Consumer Price Index
The Price of a Basket of Goods
The CPI Versus the GDP Deflator
Does the CPI Overstate Inflation?

Слайд 29GDP deflator
measures the prices of All G&S produced
includes only those goods
assigns changing weights
CPI
measures the prices of only the G&S bought by consumers
Includes goods produced Domestically & imported goods
assigns fixed weights to the prices of different goods
2-2 Measuring the Cost of Living: The Consumer Price Index
The Price of a Basket of Goods
The CPI Versus the GDP Deflator
Does the CPI Overstate Inflation?

Слайд 30The GDP Deflator and the CPI
This figure shows the
Although these two measures of prices diverge at times, they usually tell the same story about how quickly prices are rising.

Слайд 312-2 Measuring the Cost of Living: The Consumer Price Index
The Price
The CPI Versus the GDP Deflator
Does the CPI Overstate Inflation?
If prices of different goods are
changing by different amounts
the increase in the cost of living

Слайд 32
Why the CPI Overstate Inflation?
One problem is the substitution bias
A second problem is the introduction of new goods.
A third problem is unmeasured changes in quality
economists have suggested revising laws to reduce the degree of indexation
For example
Social Security benefits could be indexed to CPI inflation minus 1%.
2-2 Measuring the Cost of Living: The Consumer Price Index
The Price of a Basket of Goods
The CPI Versus the GDP Deflator
Does the CPI Overstate Inflation?
COLAs (cost-of-living allowances) use the CPI to adjust for changes in the price level

Слайд 33Cavallo and Rigobon collect data on the prices charged by ONLINE
From their offices in Cambridge, Massachusetts, they track about
5 million items sold in
70 countries by
300 online retailers.
THE BILLION PRICES PROJECT
+
Quickly,
daily
Less work
Similar to CPI in USA
-
Not all G&S
Significantly different from CPI in some countries

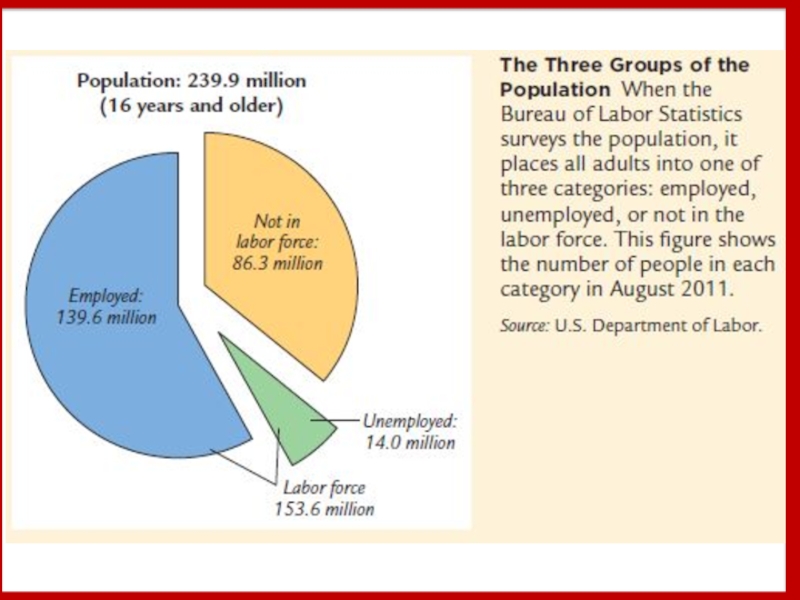
Слайд 34The unemployment rate is the statistic that measures the % of
The U comes from a survey of households.
age 16 and older
three categories:
Employed
worked as paid employees,
worked in their own business,
Worked as unpaid workers in a family member’s business
not working but who had jobs from which they were temporarily absent
vacation,
illness, or
bad weather.
Unemployed
were not employed,
were available for work,
had tried to find employment during the previous 4 weeks.
waiting to be recalled to a job from which they had been laid off.
Not in the labor force
fit neither of the first two categories
full-time student,
homemaker,
retiree.
2-3 Measuring Joblessness: The Unemployment Rate
The Household Survey
The Establishment Survey

Слайд 35Who wants a job but has given up looking—a discouraged worker—
The labor force is defined as the sum of the employed and unemployed,
Labor Force = Number of Employed + Number of Unemployed
The unemployment rate is defined as the percentage of the labor force that is unemployed.
Unemployment Rate = Number of Unemployed × 100/Labor Force
A related statistic is the labor-force participation rate, the percentage of the adult population:
Labor -Force Participation Rate = Labor Force × 100/Adult Population
2-3 Measuring Joblessness: The Unemployment Rate
The Household Survey
The Establishment Survey

Слайд 37TRENDS IN LABOR-FORCE PARTICIPATION
Labor-Force Participation.
Over the past several decades, the labor-force
Men:
Stay at school longer
Retire earlier & Live longer
Raise their children

Слайд 38
2-3 Measuring Joblessness: The Unemployment Rate
The Household Survey
The Establishment Survey

Слайд 392-4 Conclusion: From Economic Statistics to Economic Models
The three statistics quantify
gross domestic product,
The consumer price index,
the unemployment rate.
These statistics is used
to monitor changes in the economy
to formulate appropriate policies
to develop and test theories about how the economy works.
We will
examine some of these theories,
build models that explain how these variables are determined and how economic policy affects them.