- Главная
- Разное
- Дизайн
- Бизнес и предпринимательство
- Аналитика
- Образование
- Развлечения
- Красота и здоровье
- Финансы
- Государство
- Путешествия
- Спорт
- Недвижимость
- Армия
- Графика
- Культурология
- Еда и кулинария
- Лингвистика
- Английский язык
- Астрономия
- Алгебра
- Биология
- География
- Детские презентации
- Информатика
- История
- Литература
- Маркетинг
- Математика
- Медицина
- Менеджмент
- Музыка
- МХК
- Немецкий язык
- ОБЖ
- Обществознание
- Окружающий мир
- Педагогика
- Русский язык
- Технология
- Физика
- Философия
- Химия
- Шаблоны, картинки для презентаций
- Экология
- Экономика
- Юриспруденция
The basic concepts of the world economy презентация
Содержание
- 1. The basic concepts of the world economy
- 2. Economic science levels Тимофеева А.А. 2017 © Positive Normative What is economics
- 3. Microeconomics Macroeconomics The world economics Тимофеева А.А. 2017 ©
- 4. The world economics
- 5. Тимофеева А.А. 2017 ©
- 6. 195 states, 72 dependent areas 1
- 7. Age structure: 0-14 years: 25% 15-24 years: 16.8%
- 8. Тимофеева А.А. 2017 ©
- 9. 2016 Ten largest urban
- 10. Total: 510.072 million sq km Land: 148.94 million sq
- 11. World World GDP (purchasing power parity): $119.25
- 12. GDP - composition by sector: Agriculture: 6% Industry: 31% Services: 62% (2016 est.) Тимофеева А.А. 2017 ©
- 13. International economic relations Resident a legal
- 14. The forms of international economic relations International
- 15. International trade in goods and services Exports:
- 16. Stock of direct foreign investment - abroad:
- 17. labour migration Тимофеева А.А. 2017 © According
- 18. Тимофеева А.А. 2017 ©
- 19. International exchange of knowledge Тимофеева А.А. 2017
- 20. Тимофеева А.А. 2017 © International exchange of
- 21. The international currency and settlement relations
- 22. International market Domestic market National market
- 23. Тимофеева А.А. 2017 ©
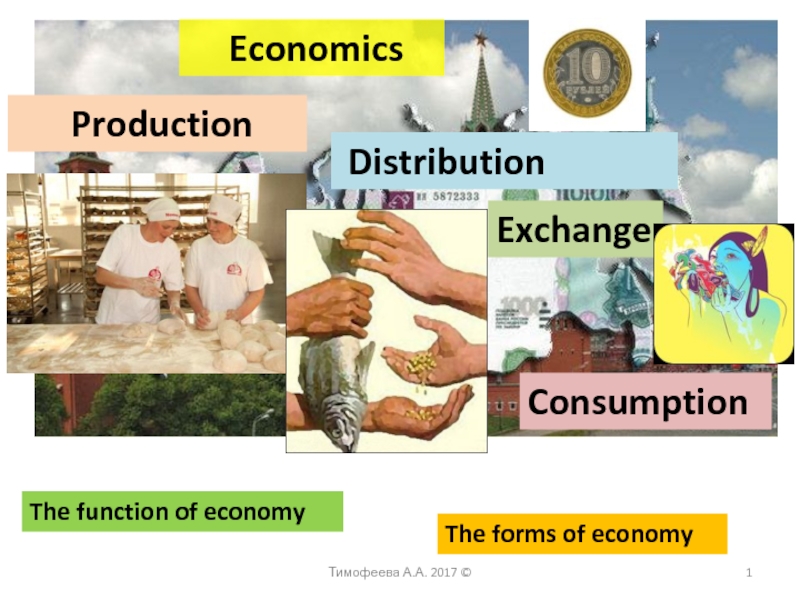
Слайд 1 Economics
Production
Distribution
Exchange
Consumption
The function of economy
The forms of economy
Тимофеева А.А.
Слайд 4
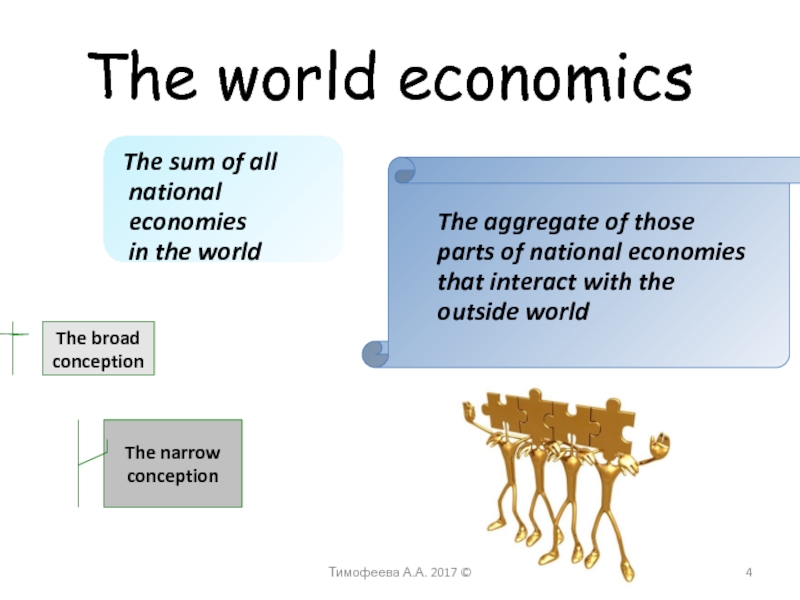
The world economics
The sum of all national economies
The aggregate of those parts of national economies that interact with the outside world
The narrow conception
The broad conception
Тимофеева А.А. 2017 ©
Слайд 6195 states, 72 dependent areas
1 billion in 1820
2 billion
3 billion in 1960
4 billion in 1974
5 billion in 1987
6 billion in 1999
7 billion in 2012
7,095,217,980 (July 2013)
China 1,373
India 1,266
United States 324
Indonesia 258
Brazil 205
Pakistan 202
Nigeria 186
Bangladesh 156
Russia 142 (146)
Japan 126
Population growth rate:
1.06%
note: this rate results in about 148 net additions to the worldwide population every minute or 2.5 every second (2013 est)
7,174,611,584 (July 2014)
Тимофеева А.А. 2017 ©
7,256,490,011 (July 2015)
7,323,600,000 (July 2016)
How many countries?
Top ten most populous countries (in millions):
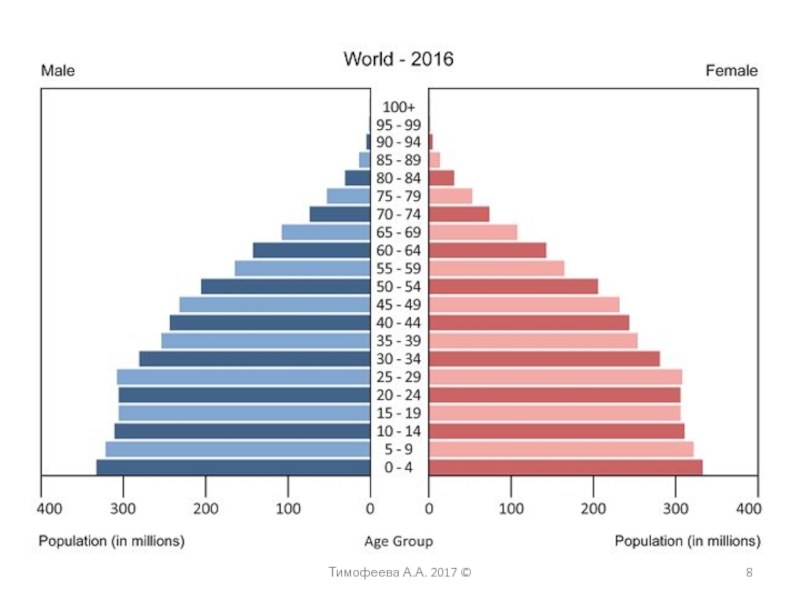
Слайд 7Age structure:
0-14 years: 25%
15-24 years: 16.8%
25-54 years: 40.6%
55-64 years: 8.4%
65 years and
Тимофеева А.А. 2017 ©
Labor force:
3,39 billion (2015)
3,36 billion (2014)
3.308 billion (2013)
3.297 billion (2012)
Слайд 9
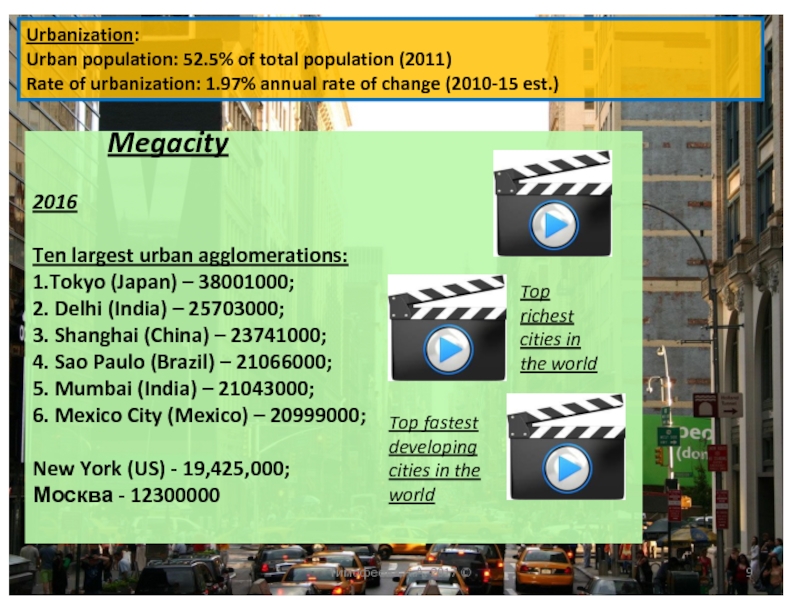
2016
Ten largest urban agglomerations:
1.Tokyo (Japan) – 38001000;
2. Delhi (India) – 25703000;
3. Shanghai (China) – 23741000;
4. Sao Paulo (Brazil) – 21066000;
5. Mumbai (India) – 21043000;
6. Mexico City (Mexico) – 20999000;
New York (US) - 19,425,000;
Москва - 12300000
Тимофеева А.А. 2017 ©
Megacity
Top richest cities in the world
Top fastest developing cities in the world
Urbanization:
Urban population: 52.5% of total population (2011)
Rate of urbanization: 1.97% annual rate of change (2010-15 est.)
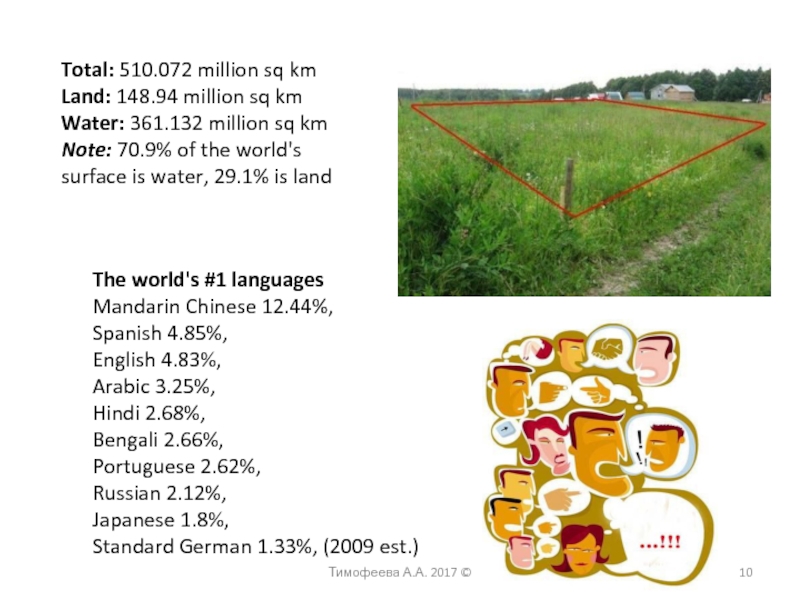
Слайд 10Total: 510.072 million sq km
Land: 148.94 million sq km
Water: 361.132 million sq km
Note: 70.9% of
The world's #1 languages
Mandarin Chinese 12.44%,
Spanish 4.85%,
English 4.83%,
Arabic 3.25%,
Hindi 2.68%,
Bengali 2.66%,
Portuguese 2.62%,
Russian 2.12%,
Japanese 1.8%,
Standard German 1.33%, (2009 est.)
Тимофеева А.А. 2017 ©
Слайд 11World World GDP (purchasing power parity):
$119.25 trillion (2016 est.)
$115.97 trillion (2015est.)
$115.47
note: data are in 2016 US dollars
World World GDP - real growth rate:
3% (2016)
3,2% (2015)
3,3% (2014)
World World GDP - per capita (PPP):
$ 16.300 (2016)
$16,000 (2015)
$15,800 (2014)
Тимофеева А.А. 2017 ©
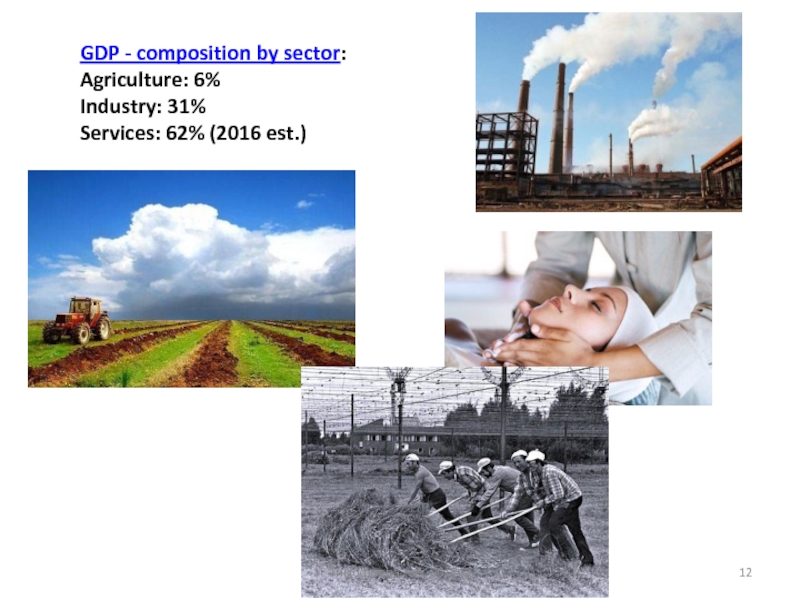
Слайд 12GDP - composition by sector:
Agriculture: 6%
Industry: 31%
Services: 62% (2016 est.)
Тимофеева А.А. 2017 ©
Слайд 13International economic relations
Resident
a legal or natural person, registered or residing
Тимофеева А.А. 2017 ©
A nonresident –
1) organization without legal entity status, established in accordance with the legislation of a foreign state or
2) diplomatic representative offices of foreign States or other official organizations located in the territory of the Russian Federation
3) natural person residing outside the Russian Federation for more than 183 calendar days within last 12 months, that is, not having permanent residence in the country.
Слайд 14The forms of international economic relations
International trade in goods and services;
The
Labour migration;
International exchange of knowledge;
The international currency and settlement relations.
Тимофеева А.А. 2017 ©
Слайд 15International trade in goods and services
Exports:
$16 trillion (2015)
$15 trillion (2014)
Exports -
top ten - share of world trade:
electrical machinery, including computers 14.8%;
mineral fuels, including oil, coal, gas, and refined products 14.4%;
nuclear reactors, boilers, and parts 14.2%;
cars, trucks, and buses 8.9%;
scientific and precision instruments 3.5%;
plastics 3.4%;
iron and steel 2.7%;
organic chemicals 2.6%;
pharmaceutical products 2.6%;
diamonds, pearls, and precious stones 1.9%
Тимофеева А.А. 2017 ©
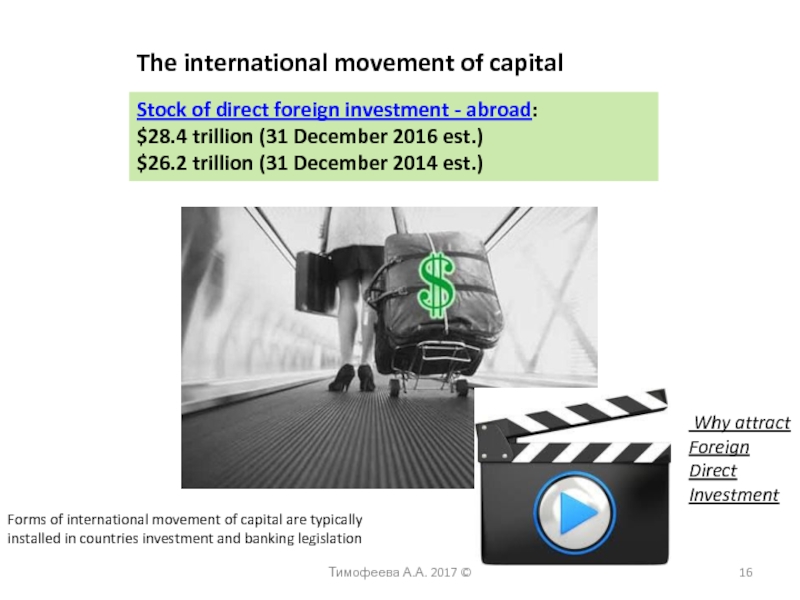
Слайд 16Stock of direct foreign investment - abroad:
$28.4 trillion (31 December 2016
$26.2 trillion (31 December 2014 est.)
The international movement of capital
.
.
Тимофеева А.А. 2017 ©
Forms of international movement of capital are typically installed in countries investment and banking legislation
Why attract Foreign Direct Investment
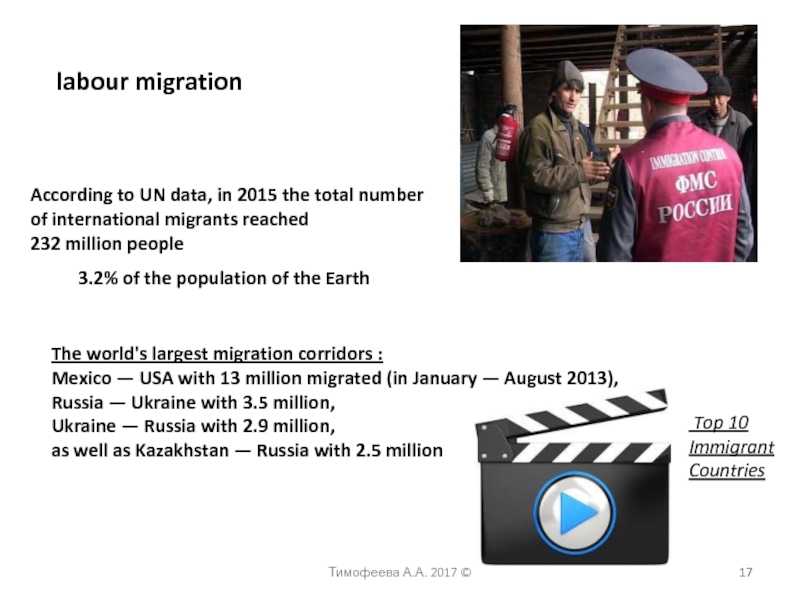
Слайд 17labour migration
Тимофеева А.А. 2017 ©
According to UN data, in 2015 the
232 million people
3.2% of the population of the Earth
The world's largest migration corridors :
Mexico — USA with 13 million migrated (in January — August 2013),
Russia — Ukraine with 3.5 million,
Ukraine — Russia with 2.9 million,
as well as Kazakhstan — Russia with 2.5 million
Top 10 Immigrant Countries
Слайд 19International exchange of knowledge
Тимофеева А.А. 2017 ©
Nonprofit forms
• scientific and technical
• carrying out of exhibitions, fairs, symposiums;
• the exchange of delegations and meetings of scientists and engineers;
• migration of professionals;
• training students and postgraduates;
• activities of international organizations on cooperation in the field of science and technology, etc.
Слайд 20Тимофеева А.А. 2017 ©
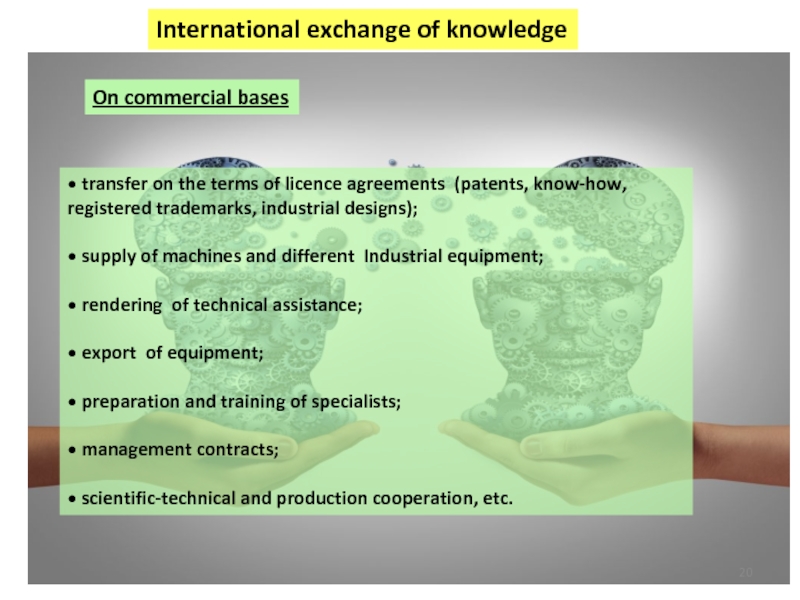
International exchange of knowledge
On commercial bases
• transfer on
• supply of machines and different Industrial equipment;
• rendering of technical assistance;
• export of equipment;
• preparation and training of specialists;
• management contracts;
• scientific-technical and production cooperation, etc.
Слайд 21The international currency and settlement relations
Тимофеева А.А. 2017 ©
1) means
3) the procedure for balancing international payments.
4) international organizations and complex international Treaty and state law.
is a set of economic relations arising at functioning of money in international circulation.
the daily turnover in the Forex market
2016 — 5,1 tr $
2020 – 10 tr $
