- Главная
- Разное
- Дизайн
- Бизнес и предпринимательство
- Аналитика
- Образование
- Развлечения
- Красота и здоровье
- Финансы
- Государство
- Путешествия
- Спорт
- Недвижимость
- Армия
- Графика
- Культурология
- Еда и кулинария
- Лингвистика
- Английский язык
- Астрономия
- Алгебра
- Биология
- География
- Детские презентации
- Информатика
- История
- Литература
- Маркетинг
- Математика
- Медицина
- Менеджмент
- Музыка
- МХК
- Немецкий язык
- ОБЖ
- Обществознание
- Окружающий мир
- Педагогика
- Русский язык
- Технология
- Физика
- Философия
- Химия
- Шаблоны, картинки для презентаций
- Экология
- Экономика
- Юриспруденция
Tasks Forcasting methods. The rule of min costs презентация
Содержание
- 2. Extrapolation It is known that in 2006
- 3. the number of failures in 1 hour
- 4. Iinear interpolation Experts of Department of the
- 5. EXPONENTIAL SMOOTHING The number of confidential information
- 6. EVALUATION OF THE FORECAST RELIABILITY You must
- 7. Calculate the average and marginal product of
- 8. The production technology of firms described by
Слайд 2Extrapolation
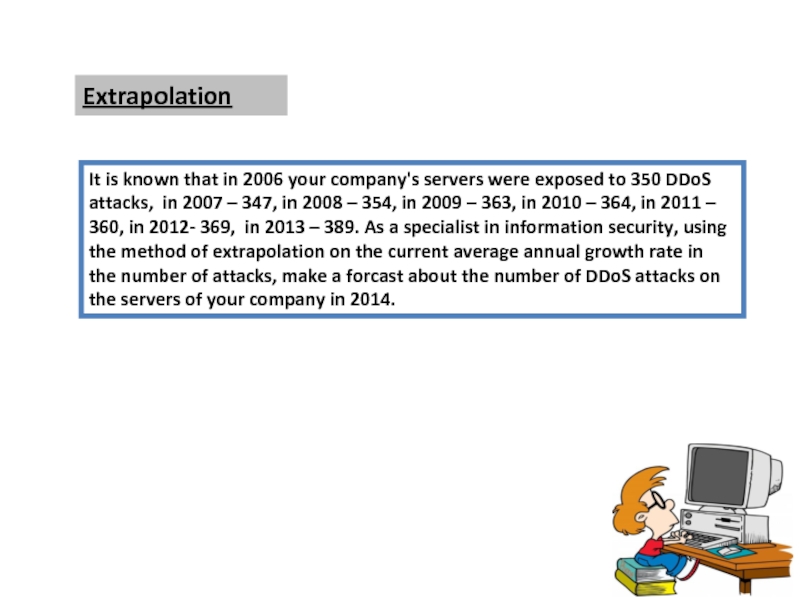
It is known that in 2006 your company's servers were exposed
Слайд 3the number of failures in 1 hour
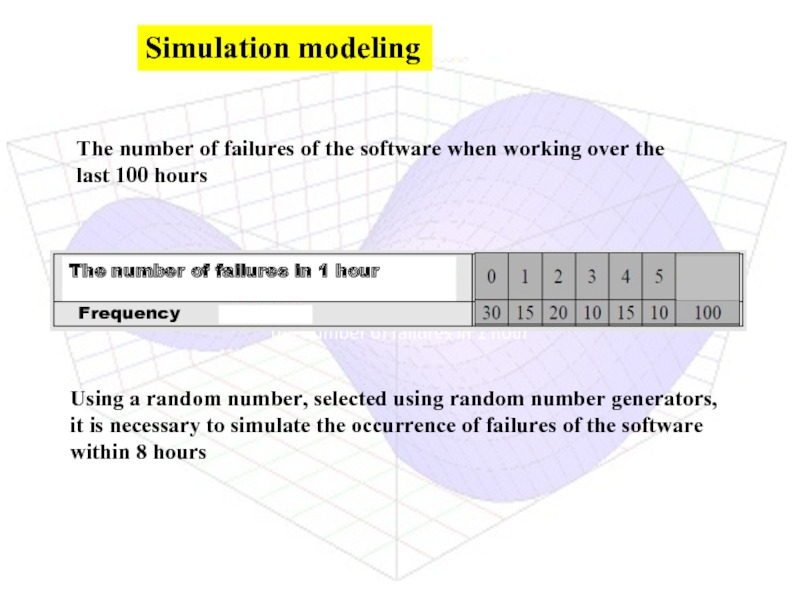
The number of failures of
Simulation modeling
Using a random number, selected using random number generators, it is necessary to simulate the occurrence of failures of the software within 8 hours
Слайд 4Iinear interpolation
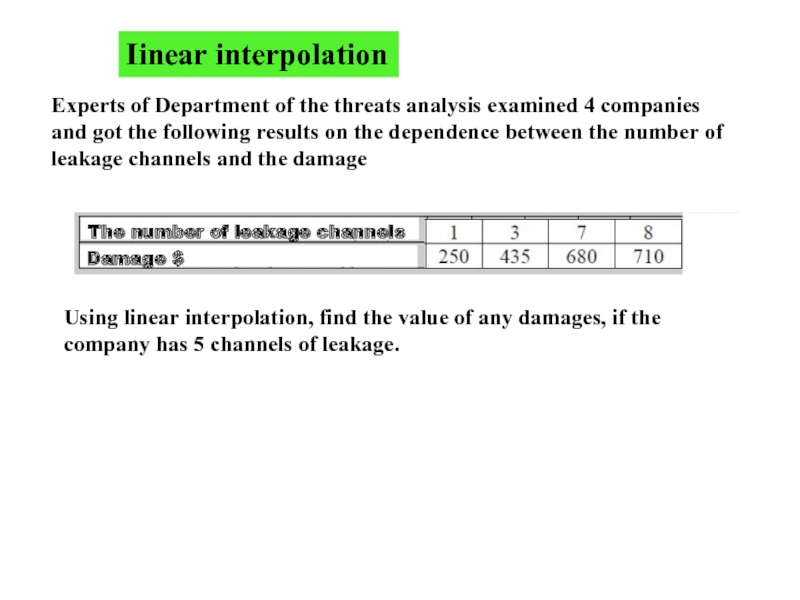
Experts of Department of the threats analysis examined 4 companies
Using linear interpolation, find the value of any damages, if the company has 5 channels of leakage.
The number of leakage channels
Damage $
Слайд 5EXPONENTIAL SMOOTHING
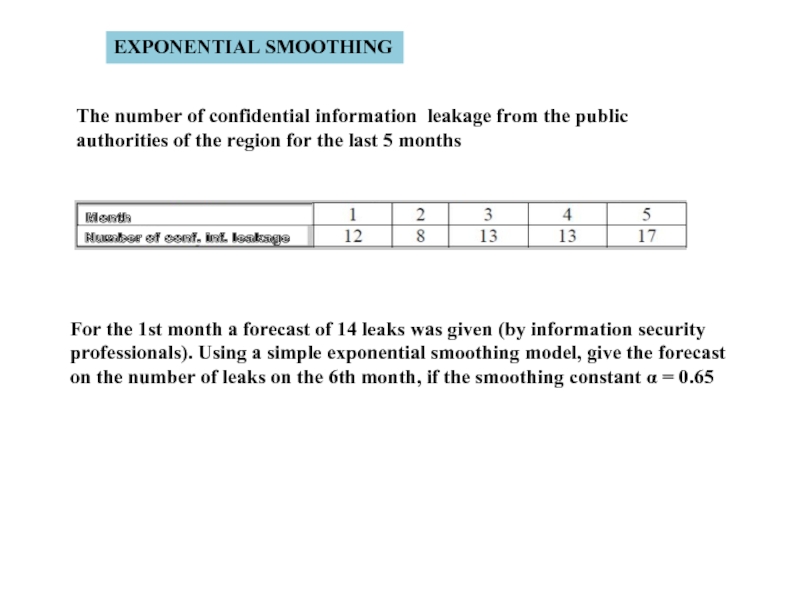
The number of confidential information leakage from the public authorities
For the 1st month a forecast of 14 leaks was given (by information security professionals). Using a simple exponential smoothing model, give the forecast on the number of leaks on the 6th month, if the smoothing constant α = 0.65
Month
Number of conf. inf. leakage
Слайд 6EVALUATION OF THE FORECAST RELIABILITY
You must provide the CEO report on
provided that
the information security specialists predicted the emergence of 47 new types of malicious programs,
and as a result, the monitoring system discovered 62 new species of malicious program,
41 of them coincided with the experts forecasts.
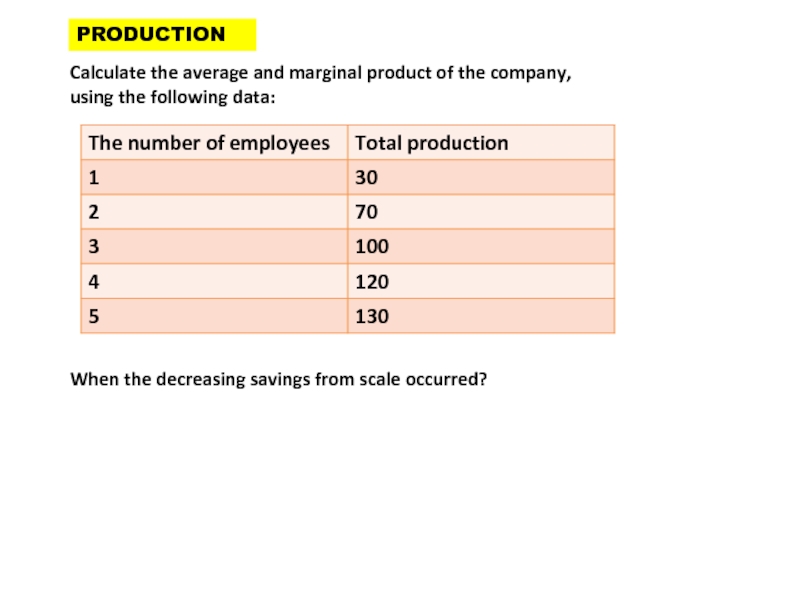
Слайд 7Calculate the average and marginal product of the company, using the
When the decreasing savings from scale occurred?
PRODUCTION
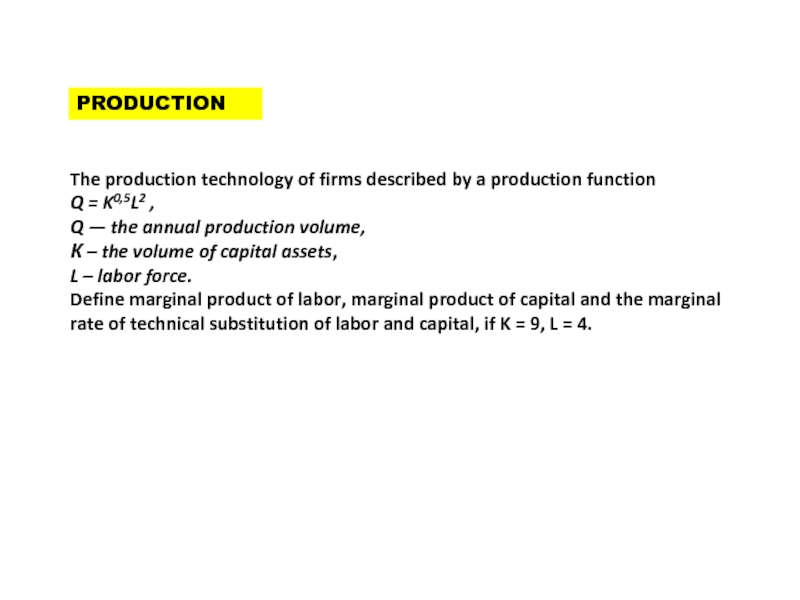
Слайд 8The production technology of firms described by a production function
Q =
Q — the annual production volume,
К – the volume of capital assets,
L – labor force.
Define marginal product of labor, marginal product of capital and the marginal rate of technical substitution of labor and capital, if K = 9, L = 4.
PRODUCTION

