- Главная
- Разное
- Дизайн
- Бизнес и предпринимательство
- Аналитика
- Образование
- Развлечения
- Красота и здоровье
- Финансы
- Государство
- Путешествия
- Спорт
- Недвижимость
- Армия
- Графика
- Культурология
- Еда и кулинария
- Лингвистика
- Английский язык
- Астрономия
- Алгебра
- Биология
- География
- Детские презентации
- Информатика
- История
- Литература
- Маркетинг
- Математика
- Медицина
- Менеджмент
- Музыка
- МХК
- Немецкий язык
- ОБЖ
- Обществознание
- Окружающий мир
- Педагогика
- Русский язык
- Технология
- Физика
- Философия
- Химия
- Шаблоны, картинки для презентаций
- Экология
- Экономика
- Юриспруденция
Manufacturing Statistics Current trends and challenges презентация
Содержание
- 1. Manufacturing Statistics Current trends and challenges
- 2. Are Manufacturing statistics still relevant? Often cited
- 7. Are Manufacturing statistics still relevant? Manufacturing activities
- 8. Are Manufacturing statistics still relevant? Manufacturing sector
- 9. Are Manufacturing statistics still relevant? Not all
- 10. Available statistics for manufacturing Data collection at
- 11. New Challenges Manufacturing technologies and methods of
- 12. New Challenges Coherence of business statistics is
- 13. We need a consistent approach to: Scope
- 14. Consistent approach (cont.) Existing international guidelines: International
- 15. Scope of manufacturing activities Manufacturing covers the
- 16. Scope (cont.) Data collection should also cover
- 17. Detail of statistics required New version of
- 18. Selection of units In cases of production
- 19. Selection of units (cont.) Changing concepts will
- 20. Measurement issues 1. Industry vs. product
- 21. 1. Industry vs. product based measurement Output
- 22. Industry vs. product data (cont.) Product data
- 23. 2. Measurement of volatile industries Some industries
- 24. Measurement of volatile industries (cont.) How should
- 25. 3. Productivity measures Outsourcing of labour force
- 26. 4. Valuation of output Output data in
- 27. Valuation of output (cont.) Choice of national
- 28. Outsourcing Affects manufacturing to a large degree
- 29. (1) Outsourcing of support functions (services) Problem:
- 30. (1) Outsourcing (cont.) Concept and use of
- 31. (2) Outsourcing of parts of the manufacturing
- 32. (2) Outsourcing (cont.) Countries treat this in
- 33. (3) Outsourcing of labour force Problem: Affects
- 34. (3) Outsourcing (cont.) Labour force is provided
- 35. Summary Production patterns in manufacturing have changed
- 36. Current state of data collection Index numbers
- 37. Current state of data collection Industrial commodity statistics (of 588)
- 38. Where do we go from here? Implementation

Слайд 2Are Manufacturing statistics still relevant?
Often cited phrases:
“Manufacturing activities are declining”
“The share
of manufacturing activities is declining and services dominate the economic production”

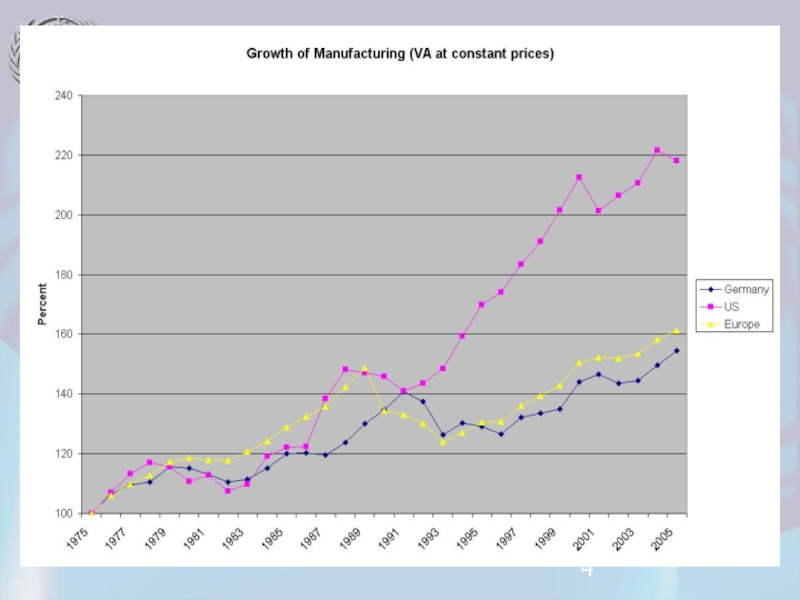
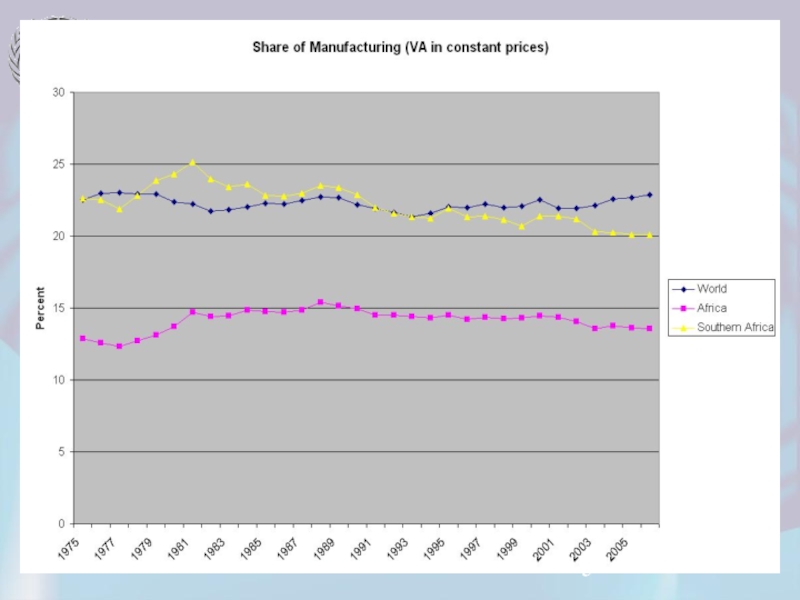
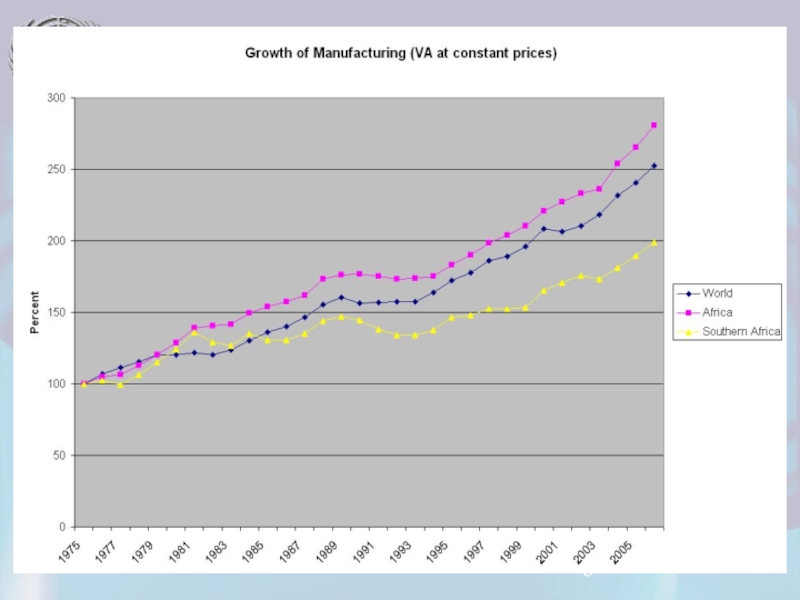
Слайд 7Are Manufacturing statistics still relevant?
Manufacturing activities are growing worldwide
While services play
an increasing role today, manufacturing as the source of all physical goods remains an essential key component of all economic statistics
Many service industries support manufacturing or are based on goods produced by the manufacturing sector
Manufacturing statistics are a key input into the national accounts, but have also important applications in their own right
Many service industries support manufacturing or are based on goods produced by the manufacturing sector
Manufacturing statistics are a key input into the national accounts, but have also important applications in their own right

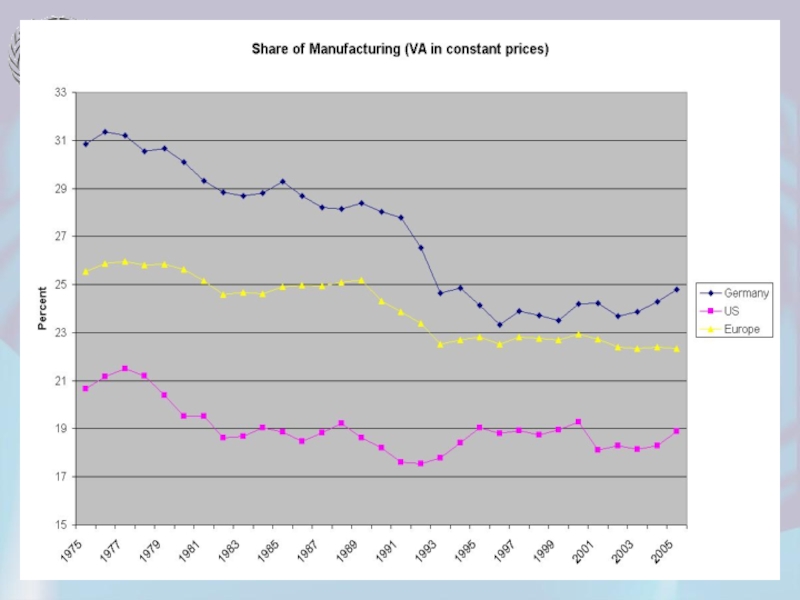
Слайд 8Are Manufacturing statistics still relevant?
Manufacturing sector plays leading role for growth
in most developing countries, while the services sector does in developed countries, supported by strong technology-based manufacturing sector
Industrial development is particularly important for economic prosperity because of its technological and high value adding nature and employment effect
Industrial development is particularly important for economic prosperity because of its technological and high value adding nature and employment effect

Слайд 9Are Manufacturing statistics still relevant?
Not all manufacturing industries have high growth
potential, therefore research and policy makers seek potential sources of growth, with notions of comparative advantage, competitiveness, productivity and structural change as such at the sub-sectoral level becoming relevant
Demand for internationally comparable data on detailed (structural) manufacturing statistics is increasing more than ever for industrial-growth empirics
Statistics need to reflect effects of globalization of production, such as outsourcing, global supply chains
Demand for internationally comparable data on detailed (structural) manufacturing statistics is increasing more than ever for industrial-growth empirics
Statistics need to reflect effects of globalization of production, such as outsourcing, global supply chains

Слайд 10Available statistics for manufacturing
Data collection at the international level:
General industrial statistics
(number of establishments, employment, female employment, wages and salaries, output*, value added*, gross fixed capital formation)
(annual, 3 and 4-digit ISIC)
Index numbers of industrial production
(quarterly, 2-digit ISIC; monthly, 1-digit ISIC)
Commodity production statistics
(annual, 600 products; monthly, 15 products)
Indicators are based on “traditional” data collection by country
(annual, 3 and 4-digit ISIC)
Index numbers of industrial production
(quarterly, 2-digit ISIC; monthly, 1-digit ISIC)
Commodity production statistics
(annual, 600 products; monthly, 15 products)
Indicators are based on “traditional” data collection by country

Слайд 11New Challenges
Manufacturing technologies and methods of production have changed
Manufacturing production
has taken on a global character, with production owners, production organizers, production contractors and clients located in different parts of the world (outsourcing, merchanting)
Specialization in support activities has changed the scope of activities of traditional manufacturing units
Some of these changes impact on time series for manufacturing statistics, while others are not visible in traditional indicators
Specialization in support activities has changed the scope of activities of traditional manufacturing units
Some of these changes impact on time series for manufacturing statistics, while others are not visible in traditional indicators

Слайд 12New Challenges
Coherence of business statistics is needed
‘internal coherence’ : between annual
and short-term business statistics; between data coming from different sources (direct surveys, administrative sources, directly from business accounting systems etc.);
‘external coherence’ : business statistics vis-à-vis other economic statistics: national accounts, statistics on prices and wages, external trade and BOP statistics
‘external coherence’ : business statistics vis-à-vis other economic statistics: national accounts, statistics on prices and wages, external trade and BOP statistics

Слайд 13We need a consistent approach to:
Scope of manufacturing activities and products
Detail
of statistics required
Selection of units
problems for continuity of historical time series
Measurement issues
industry vs. product based measurement
measurement of volatile industries
productivity measures
valuation of output
Different forms of outsourcing
Selection of units
problems for continuity of historical time series
Measurement issues
industry vs. product based measurement
measurement of volatile industries
productivity measures
valuation of output
Different forms of outsourcing

Слайд 14Consistent approach (cont.)
Existing international guidelines:
International Recommendations for Industrial Statistics (IRIS)
Last revision:
2008
International Standard Classification of All Economic Activities (ISIC)
Last revision: 2008
Central product classification (CPC)
Last revision: 2008
Manual on index numbers of industrial production
Last revision: 1950 (currently under revision)
International Standard Classification of All Economic Activities (ISIC)
Last revision: 2008
Central product classification (CPC)
Last revision: 2008
Manual on index numbers of industrial production
Last revision: 1950 (currently under revision)
Existing international guidelines:International Recommendations for Industrial Statistics (IRIS)Last revision: 2008International Standard Classification of")
Слайд 15Scope of manufacturing activities
Manufacturing covers the production of physical goods
Includes industrial
services (repair, installation)
Does not include support services (accounting, computer services)
Boundary issues e.g. between manufacturing and trade need to be consistently resolved
Does not include support services (accounting, computer services)
Boundary issues e.g. between manufacturing and trade need to be consistently resolved
Does not")
Слайд 16Scope (cont.)
Data collection should also cover SME (small and medium enterprises)
for selected industries
Some industries are dominated by large companies, but there are exceptions based on country and industry (e.g. food manufacturing)
Some industries are dominated by large companies, but there are exceptions based on country and industry (e.g. food manufacturing)
Data collection should also cover SME (small and medium enterprises) for selected industriesSome industries")
Слайд 17Detail of statistics required
New version of ISIC Rev.4 defines more accurately
the scope of manufacturing and reflects new industries (electronic products, pharmaceuticals, etc.)
Compliance with the new international standard should be a priority
For comprehensive study of manufacturing, all categories at 4-digit level of ISIC should be considered
2-digit level may be appropriate for some short term indicators, such as quarterly indices
Compliance with the new international standard should be a priority
For comprehensive study of manufacturing, all categories at 4-digit level of ISIC should be considered
2-digit level may be appropriate for some short term indicators, such as quarterly indices

Слайд 18Selection of units
In cases of production of multiple types of goods
and in cases of outsourcing, the choice of unit strongly impacts comparability of statistics
Choice of enterprise vs. establishment reflects balancing of data availability against homogeneity of outputs
If output across establishments within an enterprise is not homogeneous, the establishment may be the better unit for manufacturing statistics, but less data may be available
Using the establishment as unit, also produces more accurate regional data

Слайд 19Selection of units (cont.)
Changing concepts will disrupt historical time series
Nonetheless, the
new concepts provide a clearer description of actual production
SNA and IRIS provide guidance, but national interpretation and implementation differs
Clearer guidelines at regional level are necessary to avoid ambiguity
SNA and IRIS provide guidance, but national interpretation and implementation differs
Clearer guidelines at regional level are necessary to avoid ambiguity
Changing concepts will disrupt historical time seriesNonetheless, the new concepts provide a")
Слайд 20Measurement issues
1. Industry vs. product based measurement
2. Measurement of volatile industries
3.
Productivity measures
4. Valuation of output
4. Valuation of output

Слайд 211. Industry vs. product based measurement
Output of manufacturing activities can be
described on an establishments basis (gross output, value added etc.) = historical “general industrial statistics”
Diversification of outputs and secondary production is not visible in this form
Product data on outputs (commodity production statistics) has to complement the general industrial statistics
Diversification of outputs and secondary production is not visible in this form
Product data on outputs (commodity production statistics) has to complement the general industrial statistics

Слайд 22Industry vs. product data (cont.)
Product data allows:
Measuring of diversification of outputs
Measuring
of secondary activities
Linking product data to trade data and consumption data
Measuring production patterns of volatile outputs, i.e. changing product groups over time within the same industry
Linking product data to trade data and consumption data
Measuring production patterns of volatile outputs, i.e. changing product groups over time within the same industry
Product data allows:Measuring of diversification of outputsMeasuring of secondary activitiesLinking product")
Слайд 232. Measurement of volatile industries
Some industries have rapidly changing production patterns,
i.e. the output changes (based on season etc.) while the process, technology and equipment used remains the same
In such cases the industry classification of the producer has to remain stable, making it not a perfect tool for measuring change
But: Detail in the product classification is able to provide the necessary information
In such cases the industry classification of the producer has to remain stable, making it not a perfect tool for measuring change
But: Detail in the product classification is able to provide the necessary information

Слайд 24Measurement of volatile industries (cont.)
How should production indices reflect this behaviour?
How
should fast changes be reflected in product basket?
How should fast quality changes be reflected in index numbers for volume and prices?
How to measure output of industries with work-in-progress over long periods (e.g. shipbuilding) for short-term indicators?
How should fast quality changes be reflected in index numbers for volume and prices?
How to measure output of industries with work-in-progress over long periods (e.g. shipbuilding) for short-term indicators?
How should production indices reflect this behaviour?How should fast changes be")
Слайд 253. Productivity measures
Outsourcing of labour force affects calculation of productivity indicators
(e.g. output/worker or output/hours worked)
Trends in sector employment get distorted when labour force is outsourced
Data collection needs to be supplemented with new information that allows linking the outsourced labour to the contracting manufacturing unit
Trends in sector employment get distorted when labour force is outsourced
Data collection needs to be supplemented with new information that allows linking the outsourced labour to the contracting manufacturing unit

Слайд 264. Valuation of output
Output data in quantitative units are stable, but
monetary terms are used for most analysis and aggregation, e.g. for National Accounts:
Choice of national accounting concept or industrial census concept of value added
Valuation of output: ‘Basic prices’ or ‘producer prices’
Difference between market prices and prices between related establishments; how does this affect the use of prices for deflation of outputs
Choice of national accounting concept or industrial census concept of value added
Valuation of output: ‘Basic prices’ or ‘producer prices’
Difference between market prices and prices between related establishments; how does this affect the use of prices for deflation of outputs

Слайд 27Valuation of output (cont.)
Choice of national accounting concept vs. industrial census
concept of value added
The difference is significant for some industries using relatively more non-industrial services due to:
Industrial census excludes cost of and revenue from non-industrial services
National accounts value added properly includes cost of and revenue from non-industrial services
Valuation of output: ‘Basic prices’ vs. ‘producer prices’
Basic prices valuation does not include net taxes therefore reflects the actual cost of production. This avoids the effects of changes in taxes or subsidies on products on the value of output within a country or the effects of different tax regimes on output across countries.
Producer prices include net taxes.
Choice of national accounting concept vs. industrial census concept of value addedThe")
Слайд 28Outsourcing
Affects manufacturing to a large degree
Can take place locally and on
international level
Can take three forms:
outsourcing of support functions (services), such as accounting, computer services
outsourcing of parts of the manufacturing process
outsourcing of labour force
Can take three forms:
outsourcing of support functions (services), such as accounting, computer services
outsourcing of parts of the manufacturing process
outsourcing of labour force

Слайд 29(1) Outsourcing of support functions (services)
Problem: Affects time series, since over
time units move out of manufacturing; showing apparent decline in value added, employment
Examples: accounting, computer services
Selection of appropriate units is key issue
Often related to ancillary units
Examples: accounting, computer services
Selection of appropriate units is key issue
Often related to ancillary units
 Outsourcing of support functions (services)Problem: Affects time series, since over time units move out")
Слайд 30(1) Outsourcing (cont.)
Concept and use of “ancillary units” is inconsistent across
countries and is changed in new SNA context
Separate accounting of such units changes the scope of data in time series
Double coding of such units for purposes of time series continuity has to be considered
Clear guidance on selection of units for manufacturing statistics is needed
Separate accounting of such units changes the scope of data in time series
Double coding of such units for purposes of time series continuity has to be considered
Clear guidance on selection of units for manufacturing statistics is needed
 Outsourcing (cont.)Concept and use of “ancillary units” is inconsistent across countries and is changed")
Слайд 31(2) Outsourcing of parts of the manufacturing process
Problem: Where is production
recorded? How are involved units linked in the statistics?
Common growing phenomenon, in particular at the international level
Who reports manufacturing production – the principal or the contractor?
Contractor carries out the actual production, but cannot report on value of the output (sales value)
Principal can report on sales value, costs etc., but has no manufacturing facility as such
 Outsourcing of parts of the manufacturing processProblem: Where is production recorded? How are involved")
Слайд 32(2) Outsourcing (cont.)
Countries treat this in different ways, harmonization is strongly
needed
SNA guidelines exist, but are not followed by all countries for reporting of manufacturing statistics
This form of outsourcing may involve foreign affiliates, in which case transnational corporations may be able to provide data (yet the problem of recording persists). However, in other cases unrelated companies are involved.
 Outsourcing (cont.)Countries treat this in different ways, harmonization is strongly neededSNA guidelines exist, but")
Слайд 33(3) Outsourcing of labour force
Problem: Affects productivity statistics; employment in manufacturing
declines
Emergence of companies providing labour force to others – “Human resource provision” (e.g. PEOs)
Manufacturing companies have no (or few) employees and therefore no compensation of employees
Emergence of companies providing labour force to others – “Human resource provision” (e.g. PEOs)
Manufacturing companies have no (or few) employees and therefore no compensation of employees
 Outsourcing of labour forceProblem: Affects productivity statistics; employment in manufacturing declinesEmergence of companies providing")
Слайд 34(3) Outsourcing (cont.)
Labour force is provided by independent company that charges
a service fee for this provision
Productivity statistics are affected by this
Industry employment trends are difficult to observe
Requires consistent approach to linking employees of human resources provision companies to production
Productivity statistics are affected by this
Industry employment trends are difficult to observe
Requires consistent approach to linking employees of human resources provision companies to production
 Outsourcing (cont.)Labour force is provided by independent company that charges a service fee for")
Слайд 35Summary
Production patterns in manufacturing have changed
Historical scope of manufacturing production may
now be spread over other industries as well
Production takes no longer place in single locations but involves units across the globe
Typical manufacturing indicators (output , value added, employment) do not paint the full picture of today’s complex economy and its global character, even with consistent use guidelines
Production takes no longer place in single locations but involves units across the globe
Typical manufacturing indicators (output , value added, employment) do not paint the full picture of today’s complex economy and its global character, even with consistent use guidelines


")
Слайд 38Where do we go from here?
Implementation of international standards in a
consistent manner (e.g. classifications, use of basic prices)
Focus on better integration of available statistics on manufacturing
Review of existing indicators
Focus on better integration of available statistics on manufacturing
Review of existing indicators