- Главная
- Разное
- Дизайн
- Бизнес и предпринимательство
- Аналитика
- Образование
- Развлечения
- Красота и здоровье
- Финансы
- Государство
- Путешествия
- Спорт
- Недвижимость
- Армия
- Графика
- Культурология
- Еда и кулинария
- Лингвистика
- Английский язык
- Астрономия
- Алгебра
- Биология
- География
- Детские презентации
- Информатика
- История
- Литература
- Маркетинг
- Математика
- Медицина
- Менеджмент
- Музыка
- МХК
- Немецкий язык
- ОБЖ
- Обществознание
- Окружающий мир
- Педагогика
- Русский язык
- Технология
- Физика
- Философия
- Химия
- Шаблоны, картинки для презентаций
- Экология
- Экономика
- Юриспруденция
Macroeconomics. GDP. Income. Economic Growth презентация
Содержание
- 1. Macroeconomics. GDP. Income. Economic Growth
- 2. GDP = is the monetary value of
- 3. Approaches to calculate GDP Expenditure & Income
- 12. Expenditure approach for 1 product economy Roaster
- 13. Expenditure approach for 1 product economy Winegrower
- 14. Product approach GDP is the sum of
- 15. Product approach for 1 product economy Roaster
- 16. Expenditure approach for 1 product economy Winegrower
- 17. Income method Income Method – count all
- 18. Consumption (C) Investment (I) Government purchases (G)
- 19. Consumption + Investment + Government + Net
- 20. NFIA = Factor
- 22. Income approach for 1 product economy Roaster
- 23. Income approach for 1 product economy Winegrower
- 24. GDP – by sum of Spending, Factor Incomes or Output
- 25. The first account displays the expenditure and
- 26. GDP (BEA commentaries) The entries on the
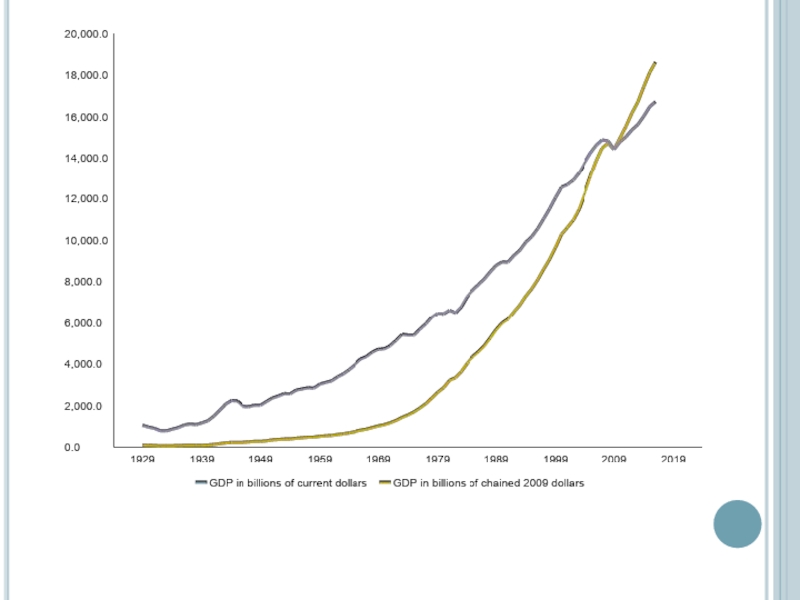
- 28. GDP – Nominal vs. Real Nominal =
- 29. USA GDP Nominal and Real Real GDP or GDP in constant prices
- 31. Example Nominal GDP =Pcheese∗QCheese+Pcheese∗QCheese Nominal GDP =Pcheese∗Qcheese+Pwine∗Qwine
- 32. where GDPt is the level of activity in
- 33. Deflator GDP GDP deflator is an index
- 34. GDP deflator = Nominal GDP Real GDP
- 35. What is the relationship between GDP deflator
- 36. Malaysia
- 37. Example The value of this market basket
- 38. Define Inflation as the growth rate of

Слайд 2GDP = is the monetary value of all the finished goods
Includes all domestic production in a boarders
Monetary measurement of value
To avoid multiple counting – must include ONLY new production (sold to consumers)
Does NOT include:
intermediate goods (ex: tires for new auto)
public transfer payments (welfare payment)
private transfer payments (cash gifts)
stock market transactions (stocks & bonds)
secondhand sales (used books, cars, homes)

Слайд 3Approaches to calculate GDP
Expenditure & Income Methods
Expenditure Method – count all
GDPExpenditure =C + I + G + NX
Consumption
Investment
Government purchases of goods and services
Net eXports


Слайд 12Expenditure approach for 1 product economy
Roaster
Wages $15,000
Taxes $5,000
Revenue $35,000
beans sold to public
beans sold to coffee bar $25,000
Coffee bar
Wages $10,000
Taxes $2,000
Beans bought from roaster $25,000
Revenue from coffee sold to public $40,000
Note: Beans sold to coffee bar are intermediate goods since they are used in the production of coffee sold to the public (final good).
Total expenditure = Consumption Expenditures = Beans purchased by public + Coffee purchased by public = $10,000 + $40,000 = $50,000 final goods.

Слайд 13Expenditure approach for 1 product economy
Winegrower
Wages $20,000
Taxes $7,000
Revenue $50,000
sold to public
sold to wine-maker $30,000
Wine-maker
Wages $18,000
Taxes $8,000
Grapes from winegrower $30,000
Revenue from wine sold to public $40,000
Total expenditure = Consumption Expenditures = Grapes purchased by public + Wine purchased by public = 20 000 + 40 000 = 60 000 final goods.

Слайд 14Product approach
GDP is the sum of the value added created in
Value added is sales minus materials, intermediate inputs and energy costs.
The value of a final good is equal to the value added at each stage of production.
Expenditure method = Production Method

Слайд 15Product approach for 1 product economy
Roaster
Wages $15,000
Taxes $5,000
Revenue $35,000
beans sold to public
beans sold to coffee bar $25,000
Coffee bar
Wages $10,000
Taxes $2,000
Beans bought from roaster $25,000
Revenue from coffee sold to public $40,000
Value Added – revenue earned by selling products minus the amount paid for intermediate goods
Intermediate goods - goods that are used for the production of other goods (in the current year)
Roaster value added = $35,000 in revenue - $0 spent on intermediate goods = $35,000
Coffeebar value added = $40,000 in revenue - $25,000 spent on intermediate goods (beans) = $15,000
Total value added = $50,000

Слайд 16Expenditure approach for 1 product economy
Winegrower
Wages $20,000
Taxes $7,000
Revenue $50,000
sold to public
sold to wine-maker $30,000
Wine-maker
Wages $18,000
Taxes $8,000
Grapes from winegrower $30,000
Revenue from wine sold to public $40,000
Winegrower value added = 50 000 in revenue – 0 spent on intermediate goods = 50 000
Wine-maker value added = 40 000 in revenue – 30 000 spent on intermediate goods (beans) = 10 000
Total value added = 50 000 + 10 000 = 60 000

Слайд 17Income method
Income Method – count all earnings received by those who
Workers, owners of property, interest earned on savings, profit earned by business owners (proprietors, partners & corporation stockholders)
Requires some accounting adjustments => Expenditures = Income (must balance)
National income => all citizens supplied resources (here & abroad)
National Income + statistical discrepancy = Net National Product

Слайд 18Consumption (C)
Investment (I)
Government purchases (G)
Exports (X)
Imports (M)
Taxes (T)
Saving (S)
(I
Investment (I)Government purchases (G) Exports (X) Imports (M)Taxes (T)Saving (S)(I - S) + (G")
Слайд 19Consumption
+
Investment
+
Government
+
Net Export
Wages
+
Profits
+
Rents
+
Interest
Depreciation (CCA)
Indirect business taxes (IBT)
GDP in market prices
National income
Expenditure approach
Income
W - employee compensation (wages)
P - profits received by proprietors & corporation owners (income taxes, dividends, & undistributed profits (retained earnings)
R - rent received for use of property
I - Interest received for use of money
Compensation of Fixed Capital = Depreciation (costs of capital over its lifetime)
Sales, excise, property, customs duties, license fees, etc
Indirect business taxes (IBT)GDP in market pricesNational incomeExpenditure approachIncome approachW - employee compensation")
Слайд 20
NFIA = Factor income earned from abroad by residents - Factor

Слайд 22Income approach for 1 product economy
Roaster
Wages $15,000
Taxes $5,000
Revenue $35,000
beans sold to public
beans sold to coffee bar $25,000
Coffee bar
Wages $10,000
Taxes $2,000
Beans bought from roaster $25,000
Revenue from coffee sold to public $40,000
Note: profit = revenue - expenses
Total wages: $15,000 + $10,000 = $25,000
Total taxes: $5,000 + $2,000 = $7,000
Roaster profit = Revenue - Expenses = $35,000 - ($15,000 in wages + $5,000 in taxes) = $15,000.
Coffeebar profit = Revenue - Expenses = $40,000 - ($10,000 in wages + $2,000 in taxes + $25,000 in beans) = $3,000
Total profit = $15,000 + $3,000 = $18,000.
Total income = Total Wages + Total Taxes + Total Profits = $25,000 + $7,000 +$18,000 = $50,000

Слайд 23Income approach for 1 product economy
Winegrower
Wages $20,000
Taxes $7,000
Revenue $50,000
sold to public
sold to wine-maker $30,000
Wine-maker
Wages $18,000
Taxes $8,000
Grapes from winegrower $30,000
Revenue from wine sold to public $40,000
Total wages = 20 000+18 000 = 38 000
Total taxes = 7 000+8 000 = 15 000
Profit (winegrower) = 50 000 - (20 000+7 000) = 23 000
Profit (wine-maker) = 40 000 - (18 000+8 000+30 000) = -16 000
Total revenue = 23 000 – 16 000 = 7 000
Total income = 38 000+150 00+7 000 = 60 000


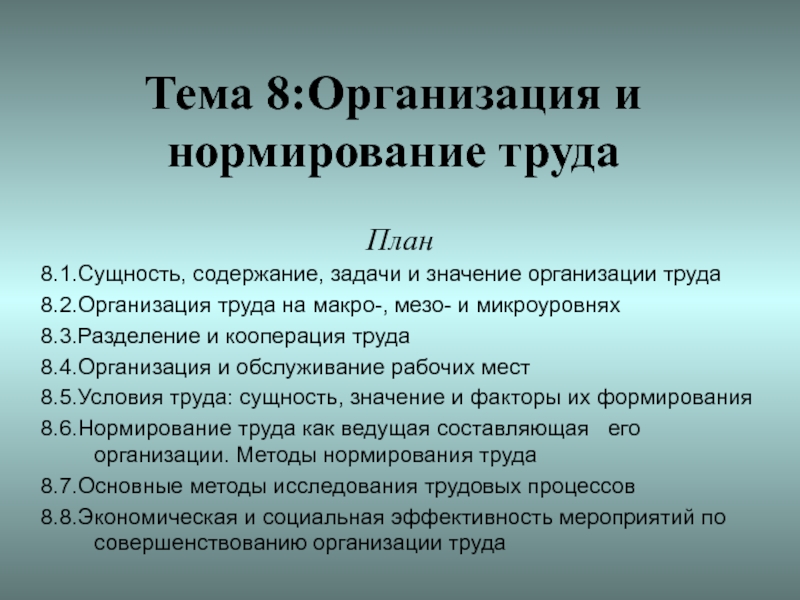
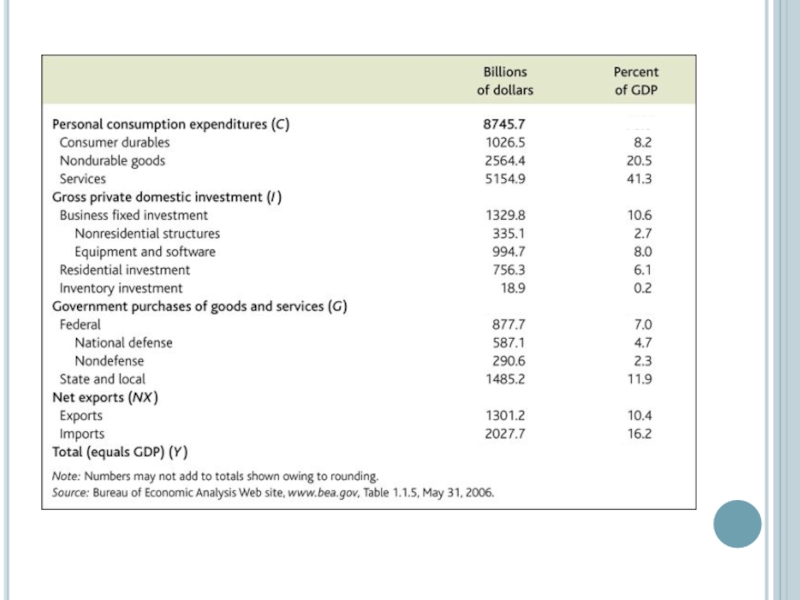
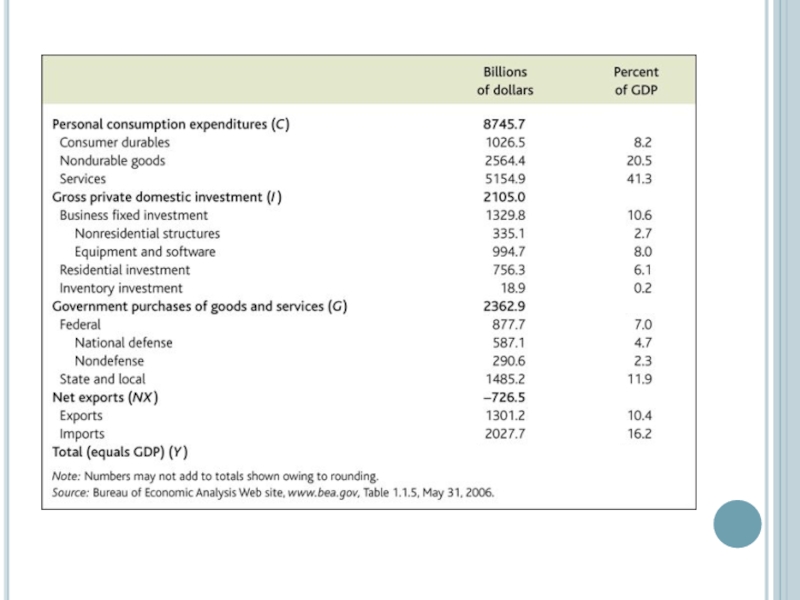
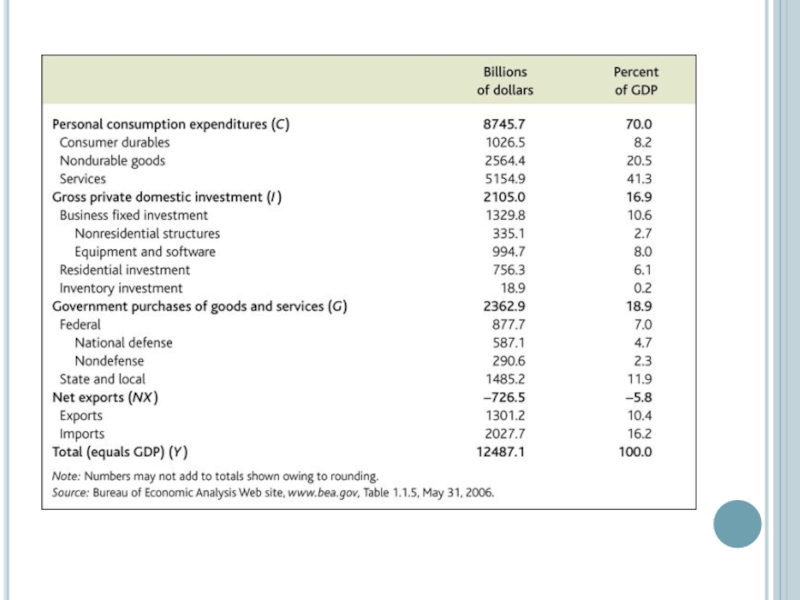
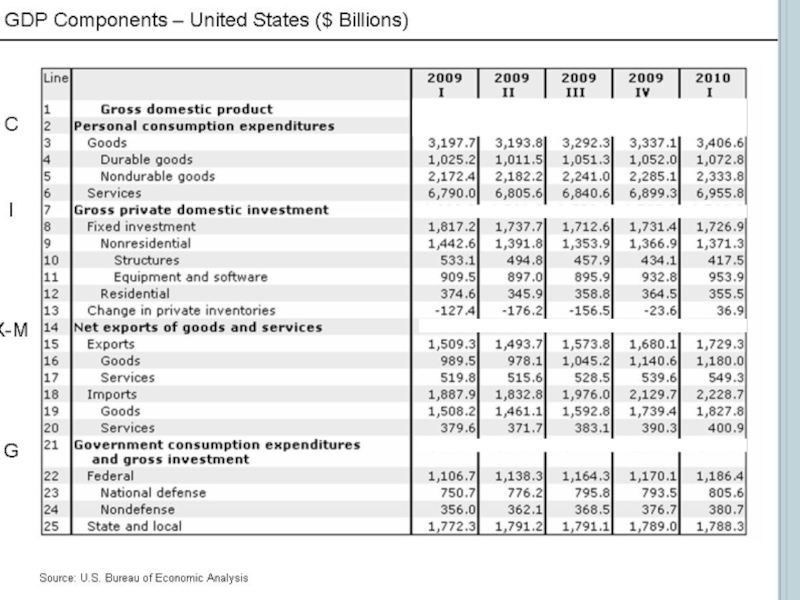
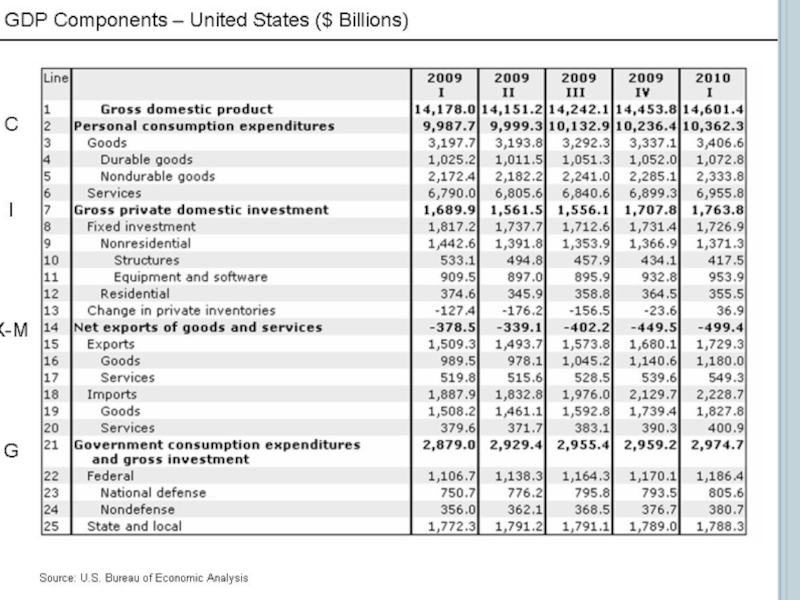
Слайд 25The first account displays the expenditure and income approaches to measuring

Слайд 26GDP (BEA commentaries)
The entries on the right side of account 1
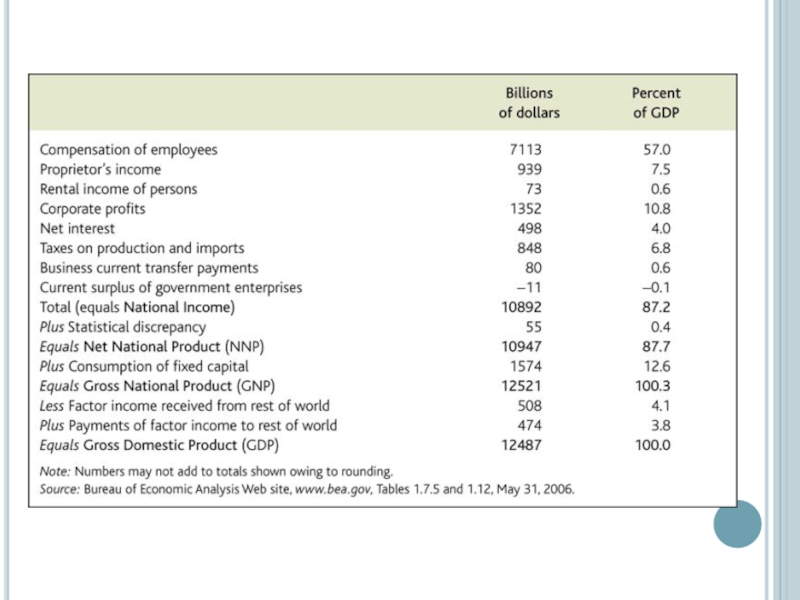
The left (income) side – the sum of all the incomes earned and costs incurred in production.
Specifically, the left side shows GDI as the sum of the income earned by labor, governments and entrepreneurs and the consumption of fixed capital.
In theory, GDI should be equal to GDP. In practice, differences in the source data used to estimate the two measures result in a “statistical discrepancy,” which, in the NIPAs ( national income and product accounts), is calculated as GDP less GDI.
Because the source data used to develop the product-side estimates of the account are based on more comprehensive surveys and censuses, BEA considers them more reliable. Therefore, the statistical discrepancy appears as a component on the income side of the account to equate GDI with GDP.
The entries on the right side of account 1 show the approach used")
Слайд 28GDP – Nominal vs. Real
Nominal = current year prices
Real = prices
Nominal > Real (in the most cases)
Nominal GDP is used when comparing different quarters of output within the same year. When comparing the GDP of two or more years, real GDP is used because, by removing the effects of inflation, the comparison of the different years focuses solely on volume.


Слайд 31Example
Nominal GDP =Pcheese∗QCheese+Pcheese∗QCheese
Nominal GDP =Pcheese∗Qcheese+Pwine∗Qwine
Nominal GDP2010 = 5*2+10*4=50
Nominal GDP2011=12*3+17*3=87
Nominal GDP2012=12*4+20*3=108
Real
Real GDP2010 = 5*2+10*4=50
Real GDP2011=5*3+10*3=45
Real GDP2012=5*4+10*3=50
Real GDP grow = (Real GDP 2011-Real GDP 2010)/Real GDP2010
Real GDP grow2011-2010 = (45-50)/50= -0.1
Real GDP grow2011-2012 = (50-45)/50= 0.1
Nominal GDP grow2011-2010 = (87-50)/50= 0.74
Nominal GDP grow2011-2012 = (108-87)/87= 0.24
Based year

Слайд 32where
GDPt is the level of activity in the later period;
GDP0 is the level
m is the periodicity of the data (for example, 1 for annual data, 4 for quarterly data, or 12 for monthly data); and
n is the number of periods between the earlier period and the later period(that is t-0).

Слайд 33Deflator GDP
GDP deflator is an index of the price level relative
It is the cost of purchasing the goods that represent GDP relative to the cost of purchasing the exact same goods if they had been sold at the prices prevailing in the base year
Consumer Price Index
The CPI is a measure that examines the weighted average of prices of a basket of consumer goods and services
Price index in the base year is always 100

Слайд 34GDP deflator =
Nominal GDP
Real GDP
× 100%
Total amount of money on GDP
Corrects the value of Nominal GDP for inflation
Corrects the value")
Слайд 35What is the relationship between GDP deflator & CPI?
Both GDP
GDP deflator measures price level but will focus more on all new, domestically produced, final goods and services in an economy
CPI is the measure of changes in the price level of consumer goods purchased by households over time.
CPI uses a fixed basket to compare prices in determining inflation progress. GDP deflator uses the price of the currently produced product relative to the price from the base year.


Слайд 37Example
The value of this market basket in the base year :
5
The value of the market basket in the year 2012 :
12 × 1+20 × 2=52
CPI2012= (52/25) × 100= 208
Deflator GDP2010 = (Nominal GDP2010/Real GDP2010 ) × 100=(50/50) ×100=100
Deflator GDP2012=(108/50) ×100=216
Inflation=[(Def GDP2012-Def GDP2010)/Def GDP 2010] ×100=[(216-100)/100] ×100=216
To convert a nominal value to a real value:
So a Television that cost $100 in 2012 would cost $48 ([100/208] × 100=48) (CPI) or $46.3 ([100/216] × 100=46.3) (Deflator GDP) in 2010
Real GDP 2012 in 2010 dollars =50×(100/216)=23.14

Слайд 38Define Inflation as the growth rate of prices.
The greek letter π
Inflation means that prices are growing
Disinflation means that inflation is slowing down but still positive
Deflation means that inflation is negative and prices are actually dropping.
Inflation