- Главная
- Разное
- Дизайн
- Бизнес и предпринимательство
- Аналитика
- Образование
- Развлечения
- Красота и здоровье
- Финансы
- Государство
- Путешествия
- Спорт
- Недвижимость
- Армия
- Графика
- Культурология
- Еда и кулинария
- Лингвистика
- Английский язык
- Астрономия
- Алгебра
- Биология
- География
- Детские презентации
- Информатика
- История
- Литература
- Маркетинг
- Математика
- Медицина
- Менеджмент
- Музыка
- МХК
- Немецкий язык
- ОБЖ
- Обществознание
- Окружающий мир
- Педагогика
- Русский язык
- Технология
- Физика
- Философия
- Химия
- Шаблоны, картинки для презентаций
- Экология
- Экономика
- Юриспруденция
Macroeconomics. GDP /Business Cycle. Unemployment презентация
Содержание
- 1. Macroeconomics. GDP /Business Cycle. Unemployment
- 2. Example In 1966, Howard Hughes was forced
- 3. Trends and cycles We observe that real
- 4. Business Cycle term As the economy fluctuates
- 5. The correlation of business cycles implies that
- 6. North American Free Trade Agreement (NAFTA) It
- 7. The global expansion remains relatively steady and
- 8. Recession and booms Business cycle positions are
- 9. Hong Kong Business Cycle
- 10. Business Cycles & Co-movement Business cycles
- 11. Business Cycles & Sub-Categories Expenditure. Consumption and
- 12. Hong Kong Expenditure Cycle
- 13. Corporate Profits Corporate profits are strongly pro-cyclical
- 14. Using financial market data to predict business
- 15. The traditional business cycle frequency is around
- 17. Level of Unemployment (HK)
- 18. Unemployment Is defined by the International Labor
- 19. Unemployment Labor force Many people
- 20. Employment dynamics Employed labor force Unemployed
- 21. Example Who is counted as employed? On
- 22. Example Garrett is 16 years old, and
- 23. Types of Unemployment
- 24. Underemployment Underemployment is a measure of employment
- 25. Disguised (hidden) Unemployment Disguised unemployment exists where
- 26. Alternative Measures U-1 People who have been
- 27. Alternative Measures U-5 Unemployed people, plus those
- 28. Alternative Measures U-6 Unemployed people, plus people
- 30. Tightly regulated labor markets increase structural unemployment.
- 31. How to solve the problem There are

Слайд 2Example
In 1966, Howard Hughes was forced to sell TWA (trans world
The GDP deflator in USA in 1966 was 22.855. The deflator in 2004 was 107.958.
In 2004 dollars this is
 and received a")
Слайд 3Trends and cycles
We observe that real GDP is growing over time
We call the growth path, if the economy were always growing at its average rate, the trend path.
Fluctuations around the trend are called business cycles.

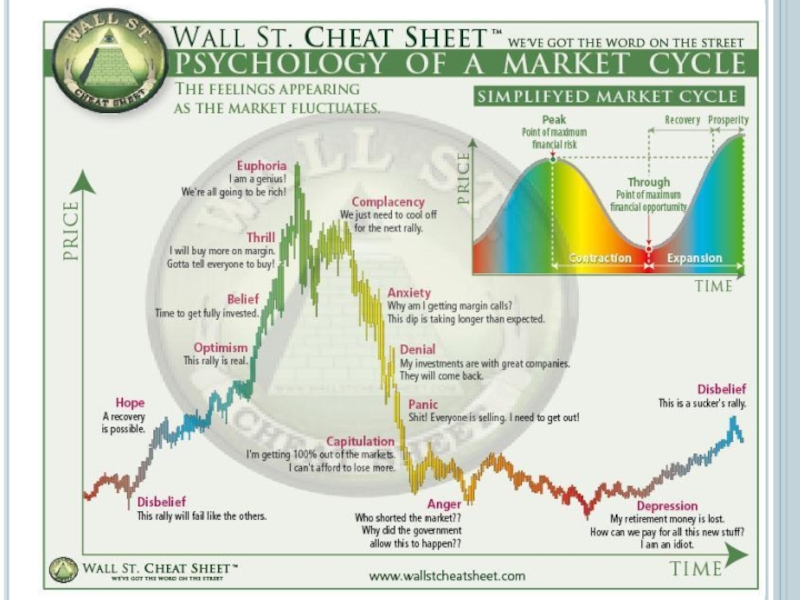
Слайд 4Business Cycle term
As the economy fluctuates around the trend, the economy
When economy is moving from a peak level to trough level, the economy is in a contractionary phase.
When economy is moving from trough to peak, the economy is in an expansionary phase.
When economy is moving from peak to trough the economy is in a contractionary phase

Слайд 5The correlation of business cycles implies that groups of countries are

Слайд 6North American Free Trade Agreement (NAFTA)
It is a piece of regulation
The essence of a free trade measure, NAFTA’s purpose is to encourage economic activity between the three major economic powers of North America.
NAFTA has two supplements: the North American Agreement on Environmental Cooperation (NAAEC) and the North American Agreement on Labor Cooperation (NAALC).
About 1/4 of all U.S. imports (especially crude oil, machinery, gold, vehicles, fresh produce, livestock and processed foods) comes from Canada and Mexico, which are the United States’ second- and third-largest suppliers of imported goods. In addition, about one-third of U.S. exports, particularly machinery, vehicle parts, mineral fuel/oil and plastics are destined for Canada and Mexico.
It is a piece of regulation implemented January 1, 1994")
Слайд 7The global expansion remains relatively steady and synchronized across major economies.
Broadly
The Eurozone is not as far along as the U.S. in the cycle, and it continues to benefit from improving sentiment and credit conditions.
China's activity has rebounded to multiyear highs, but policy tightening and slowing momentum in industrial activity and housing suggest that most of the upside has already occurred.
Overall, the global expansion is on firm ground, but peak activity levels have probably already been reached.

Слайд 8Recession and booms
Business cycle positions are sometimes characterized as booms and
These names have many definitions
a boom occurs roughly when real output is above the trend growth path (detrended output is positive).
A recession occurs roughly when real output is below trend growth.
In the USA, recessions are sometimes defined as 2 consecutive periods of negative growth.


Слайд 10 Business Cycles & Co-movement
Business cycles are fluctuations in the economy
Different sub-categories of GDP tend to co-move with business cycles though to different degree.
Business cycles tend to co-move across countries though not as strongly as within countries.

Слайд 11Business Cycles & Sub-Categories
Expenditure. Consumption and Investment co-move with output. Investment
Production – Production sectors co-move with business cycles. Manufacturing & Construction most volatile. Services least volatile.
Income – Worker Compensation & Capital Income are both pro-cyclical. Capital Income tends to be more volatile.


Слайд 13Corporate Profits
Corporate profits are strongly pro-cyclical and volatile.
When the economy is
Corporate profits fluctuate far more than the economy as a whole
HK Corporate Earnings & the Business Cycle

Слайд 14Using financial market data to predict business cycles
It has been joked
(In fact there does seem to be a moderately strong, positive correlation between cyclical variation in stock prices and business cycles)
In the USA, some financial market indicators have been shown to predict business cycles.
Default Spread : Interest rates on lower rated bonds vs. Interest rates on better rated bonds.
Term Spread: Interest rates on long-term bonds vs. short-term bonds (when this is inverted, recession is likely)

Слайд 15The traditional business cycle frequency is around one to eight years.

")
Слайд 18Unemployment
Is defined by the International Labor Organization (ILO) as a situation
According to this definition, people who do not look for a job will not be considered unemployed.
Productive population
In the labor force
Not in the labor force
Employed
Unemployed
 as a situation in which people are")
Слайд 19Unemployment
Labor force
Many people who would like to work but cannot (due

Слайд 20Employment dynamics
Employed labor force
Unemployed
New hire/ recall
Lay off/ quits
Out of the labor
Retiring/ temporarily leaving
Taking a job
Discouraged workers
New entrants willing to work but not yet found one
A discouraged worker is a person who is eligible for employment and is able to work, but is currently unemployed and has not attempted to find employment in the last four weeks.

Слайд 21Example
Who is counted as employed?
On vacation
Ill
Experiencing child care problems
On maternity or
Taking care of some other family or personal obligation
Involved in a labor dispute
Prevented from working by bad weather
Fictional scenarios:
Elena reported to the interviewer that last week she worked 40 hours as a sales manager for a beverage company. Elena is employed.
Steve lost his job when the local plant of an aircraft manufacturing company closed down. Since then, he has been contacting other businesses in town trying to find a job. Steve is unemployed.
Linda is a stay-at-home mother. Last week, she was occupied with her normal household activities. She neither held a job nor looked for a job. Her 80-year-old father who lives with her has not worked or looked for work because of a disability. Linda and her father are not in the labor force.

Слайд 22Example
Garrett is 16 years old, and he has no job from
Lisa spends most of her time taking care of her home and children, but she helps in her husband's computer software business all day Friday and Saturday.
Both Garrett and Lisa are considered employed. They fall into a group called unpaid family workers, which includes any person who worked without pay for 15 hours or more per week in a business or farm operated by a family member with whom they live. Unpaid family workers comprise a small proportion of total employment. Most of the employed are either wage and salary workers (paid employees) or self-employed (working in their own business, profession, or farm).
In addition to estimating the number of employed people, the survey collects information about the job characteristics of the employed. For example, the survey gathers and provides data about workers’ industry and occupation, hours worked, usual earnings, and union membership.


Слайд 24Underemployment
Underemployment is a measure of employment and labor utilization in the
Labor that falls under the underemployment classification includes those workers who are highly skilled but working in low paying jobs, workers who are highly skilled but working in low skill jobs and part-time workers who would prefer to be full time. This is different from unemployment in that the individual is working but is not working at his full capability.

Слайд 25Disguised (hidden) Unemployment
Disguised unemployment exists where part of the labor force
exists frequently in developing countries whose large populations create a surplus in the labor force. It can be characterized by low productivity and frequently accompanies informal labor markets and agricultural labor markets, which can absorb substantial quantities of labor.
can refer to any segment of the population not employed at full capacity, but it is often not counted in official unemployment statistics within the national economy. This can include those working well below their capabilities, those whose positions provide little overall value in terms of productivity, or any group that is not currently looking for work but is able to perform work of value
 UnemploymentDisguised unemployment exists where part of the labor force is either left without")
Слайд 26Alternative Measures
U-1 People who have been unemployed for 15 weeks or
U-2 People who lost their jobs, or whose temporary jobs ended, as a percentage of the labor force.
U-4 Unemployed people, plus discouraged workers, as a percentage of the labor force (plus discouraged workers).
Discouraged workers are those who are available to work and would like a job, but have given up actively looking for one.**

Слайд 27Alternative Measures
U-5 Unemployed people, plus those who are marginally attached to
People who are marginally attached to the labor force include discouraged workers and anyone else who would like a job and has looked for one in the past 12 months, but have given up actively searching. As with U4, the denominator is expanded to include the marginally attached, who are not technically part of the labor force.

Слайд 28Alternative Measures
U-6 Unemployed people, plus people who are marginally attached to
This metric is the Bureau of Labor Statistics (BLS) most comprehensive. In addition to the categories included in U5, it accounts for people who have been forced to settle for part-time work even though they want to work full-time. This category is often referred to as "underemployed," although that label arguably includes full-time workers who are overqualified for their jobs. The denominator for this ratio is the same as in U5.

Слайд 30Tightly regulated labor markets increase structural unemployment.
High social welfare benefits increase

Слайд 31How to solve the problem
There are two ways the government can
There are passive programs, such as unemployment insurance, that help the unemployed make ends meet and stabilize the economy by providing funds that are generally spent immediately. Then there are active programs, such as might help the unemployed meet the skills requirements of available jobs.
Active labor market policies (ALMP). They can be divided into six categories:
Training programs to help workers move from one industry and occupation to another.
Job-search assistance to help match the unemployed with employers.
Employment incentives for employers.
Supported employment to subsidize cost of new hires.
Direct job creation of government spending programs.
Other policies, which can be diverse, including entrepreneurship incentives