- Главная
- Разное
- Дизайн
- Бизнес и предпринимательство
- Аналитика
- Образование
- Развлечения
- Красота и здоровье
- Финансы
- Государство
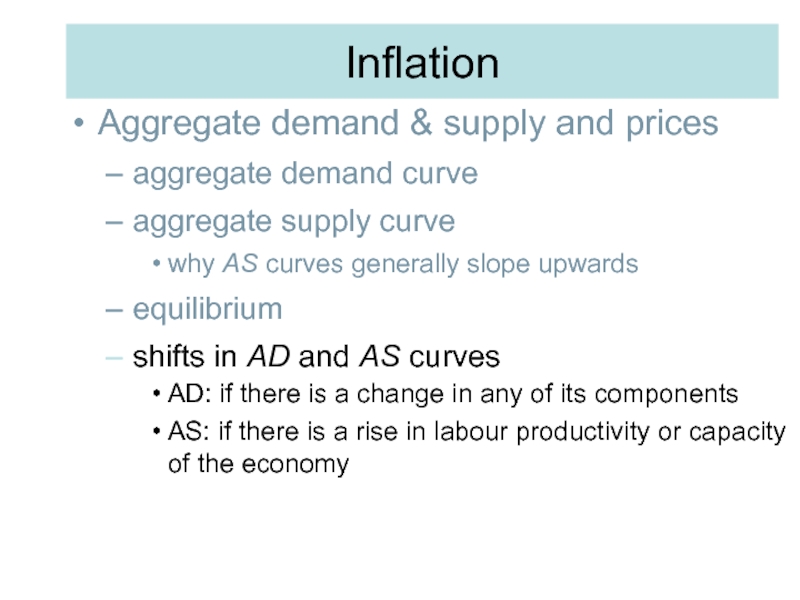
- Путешествия
- Спорт
- Недвижимость
- Армия
- Графика
- Культурология
- Еда и кулинария
- Лингвистика
- Английский язык
- Астрономия
- Алгебра
- Биология
- География
- Детские презентации
- Информатика
- История
- Литература
- Маркетинг
- Математика
- Медицина
- Менеджмент
- Музыка
- МХК
- Немецкий язык
- ОБЖ
- Обществознание
- Окружающий мир
- Педагогика
- Русский язык
- Технология
- Физика
- Философия
- Химия
- Шаблоны, картинки для презентаций
- Экология
- Экономика
- Юриспруденция
Inflation. The rate of inflation measures the annual percentage increase in prices презентация
Содержание
- 1. Inflation. The rate of inflation measures the annual percentage increase in prices
- 2. Inflation Inflation in historical perspective
- 3. Annual % increase in GDP deflator Inflation
- 4. The distinction between real and nominal values.
- 5. Q In a period of rapid inflation
- 6. Inflation Aggregate demand &
- 7. O Price level National
- 8. Inflation Aggregate demand & supply
- 9. O Price level National
- 10. Inflation Aggregate demand & supply
- 11. Q As the price level in the
- 12. Inflation Causes of inflation demand
- 13. Demand-pull inflation O Price
- 14. O Price level National
- 15. O Price level National
- 16. Inflation Causes of inflation cost
- 17. Inflation Rise in costs may come from:
- 18. In all these cases, inflation occurs because
- 19. Q Which one of the following would
- 20. Cost-push inflation O Price
- 21. O Price level National
- 22. O Price level National
- 23. With the growth in demand for raw
- 24. Demand-pull and cost-push inflation can occur together
- 25. The interaction of demand-pull
- 26. O Price level National
- 27. O Price level National
- 28. Inflation Expectations and inflation Workers
- 29. Lecture 4.1 Fiscal and Monetary Policy
- 30. Aims of this session: Add Government spending
- 31. Fiscal policy Fiscal policy is the government’s
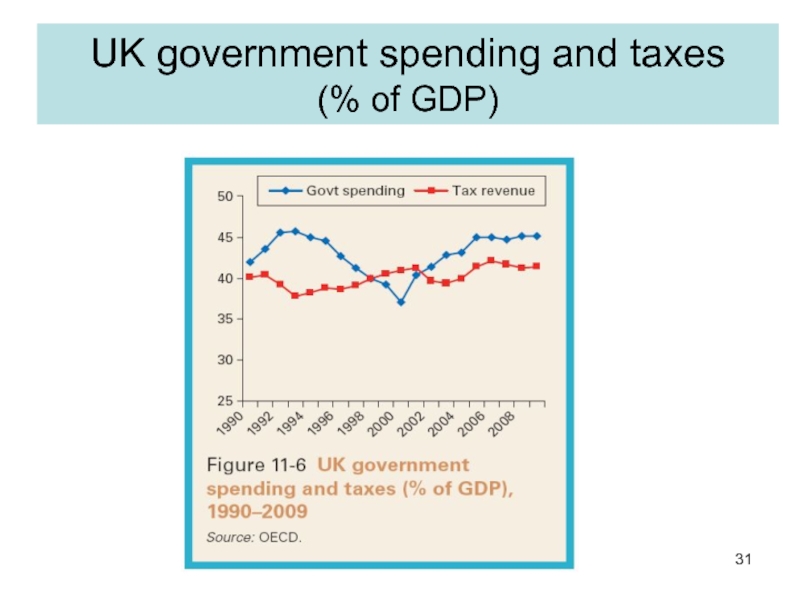
- 32. UK government spending and taxes (% of GDP)
- 33. Government and aggregate demand 1 Government
- 34. Government and aggregate demand 2
- 35. The open economy: foreign trade and output
- 36. UK Foreign trade (% of GDP)
- 37. Monetary Policy I Interest rates are the
- 38. Monetary Policy II Monetary policy
- 39. Nominal vs Real Interest Rates The
- 40. Nominal and real UK interest rates (%)
- 41. How interest rates affect the economy Interest
- 42. Interest rates and investment demand For a
- 43. Lower interest rates increase aggregate demand 1
- 44. Demand management and the policy mix Demand
Слайд 1
Inflation
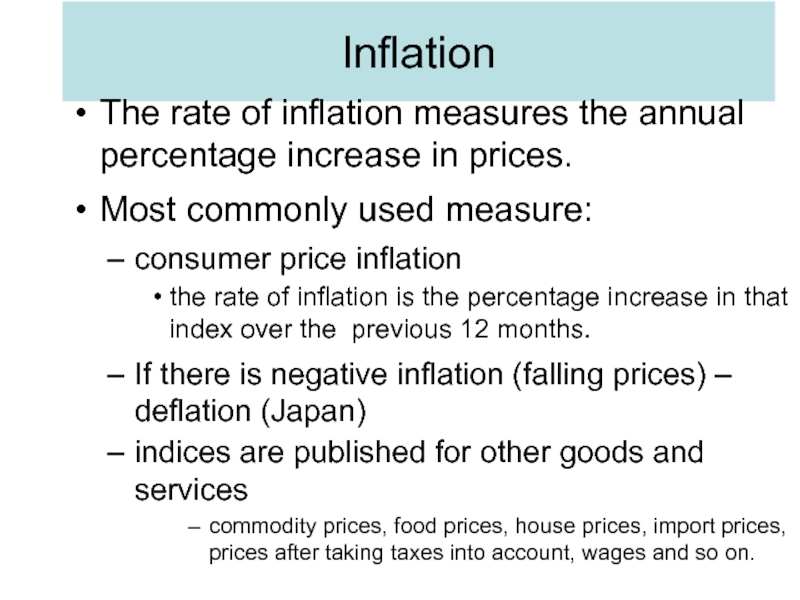
The rate of inflation measures the annual percentage increase in prices.
Most
consumer price inflation
the rate of inflation is the percentage increase in that index over the previous 12 months.
If there is negative inflation (falling prices) – deflation (Japan)
indices are published for other goods and services
commodity prices, food prices, house prices, import prices, prices after taking taxes into account, wages and so on.
Слайд 2
Inflation
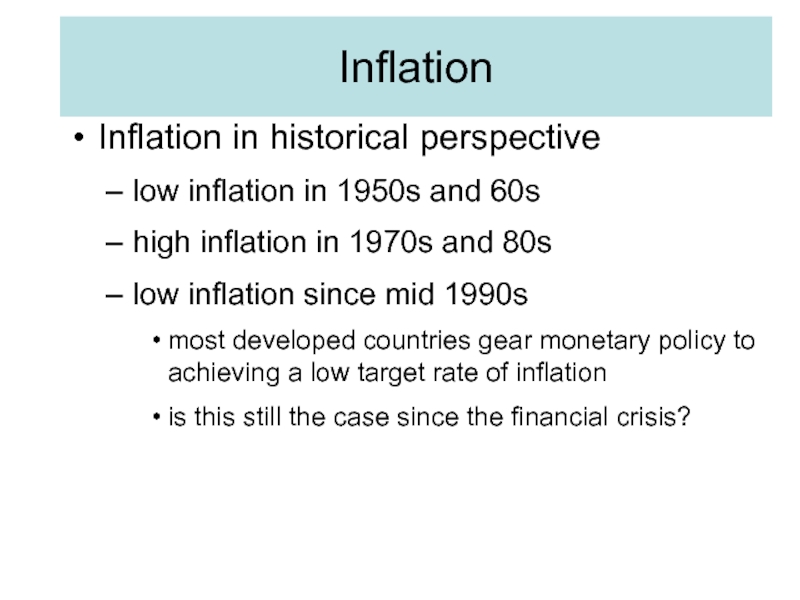
Inflation in historical perspective
low inflation in 1950s and 60s
high inflation in
low inflation since mid 1990s
most developed countries gear monetary policy to achieving a low target rate of inflation
is this still the case since the financial crisis?
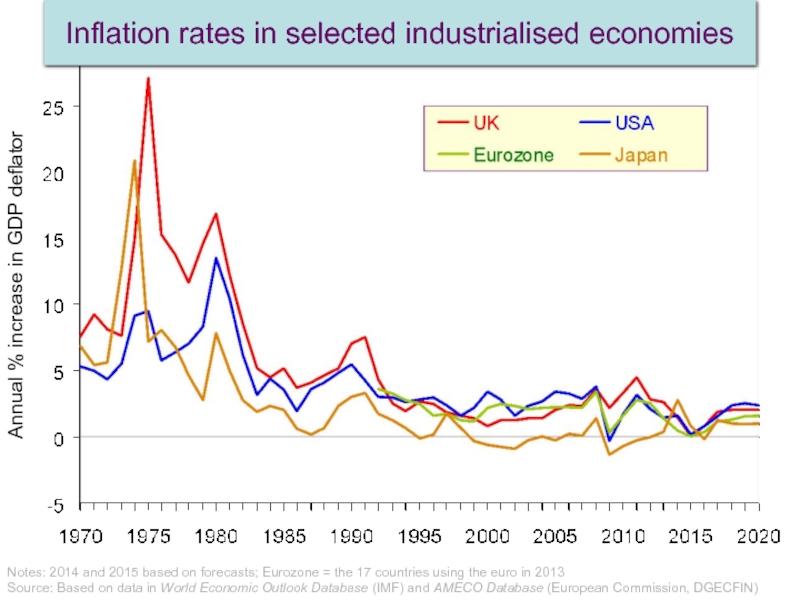
Слайд 3Annual % increase in GDP deflator
Inflation rates in selected industrialised economies
Notes:
Source: Based on data in World Economic Outlook Database (IMF) and AMECO Database (European Commission, DGECFIN)
Слайд 4The distinction between real and nominal values.
Nominal figures are those using
When there is inflation, we have to be careful in assessing how much national output, consumption, wages, etc. are increasing.
GDP in money terms may have risen by 5 per cent, but if inflation is 3 per cent, real growth in GDP will be only 2 per cent.
A rise or fall in inflation is different from a rise or fall in prices.
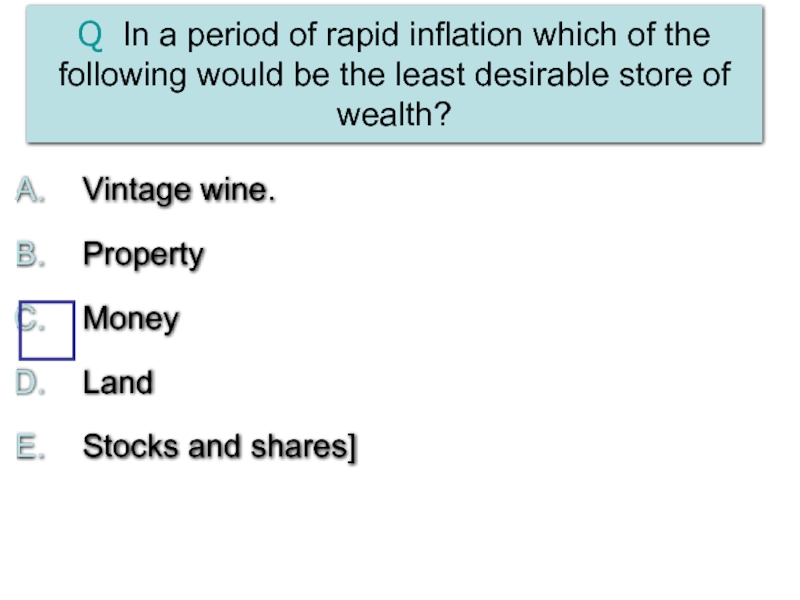
Слайд 5Q In a period of rapid inflation which of the following
Vintage wine.
Property
Money
Land
Stocks and shares]
Слайд 6
Inflation
Aggregate demand & supply and prices
The level of prices in the
Aggregate demand curve shows how much national output (real GDP) will be demanded at each level of prices.
Слайд 7
O
Price level
National output
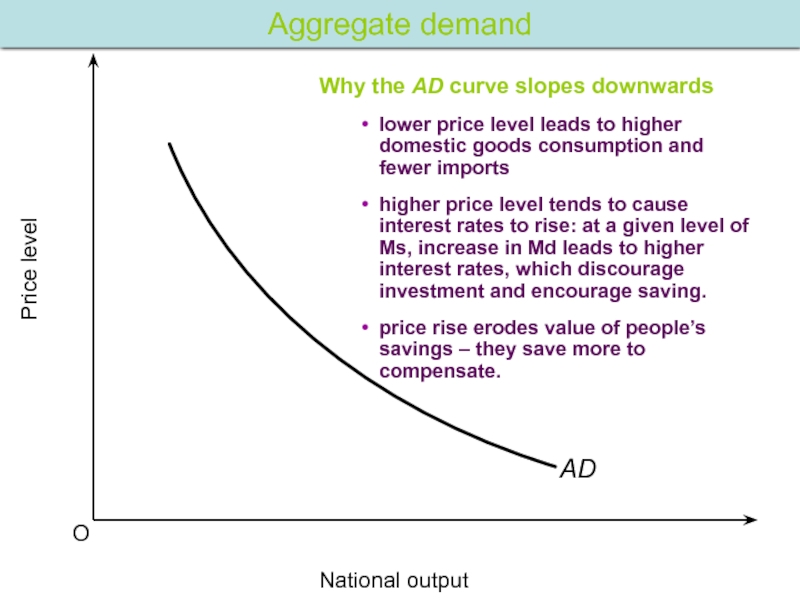
Aggregate demand
Why the AD curve slopes downwards
lower price level
higher price level tends to cause interest rates to rise: at a given level of Ms, increase in Md leads to higher interest rates, which discourage investment and encourage saving.
price rise erodes value of people’s savings – they save more to compensate.
Слайд 8
Inflation
Aggregate demand & supply and prices
aggregate demand curve
aggregate supply curve
The aggregate
Слайд 9
O
Price level
National output
AS
AD
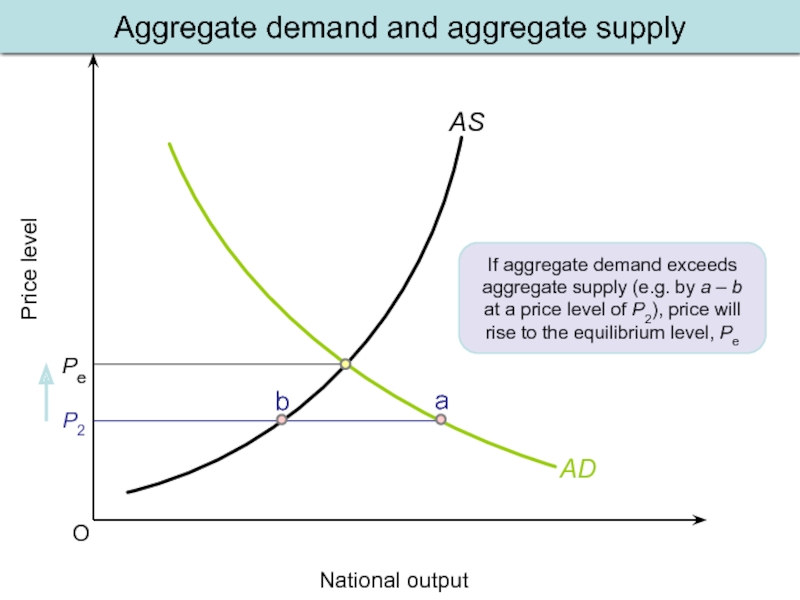
Aggregate demand and aggregate supply
If aggregate demand exceeds aggregate
Слайд 10
Inflation
Aggregate demand & supply and prices
aggregate demand curve
aggregate supply curve
why AS
equilibrium
shifts in AD and AS curves
AD: if there is a change in any of its components
AS: if there is a rise in labour productivity or capacity of the economy
Слайд 11Q As the price level in the economy rises, which of
(i) only
(ii) only
(i) and (ii)
(i) and (iii)
(i), (ii) and (iii)
Слайд 12
Inflation
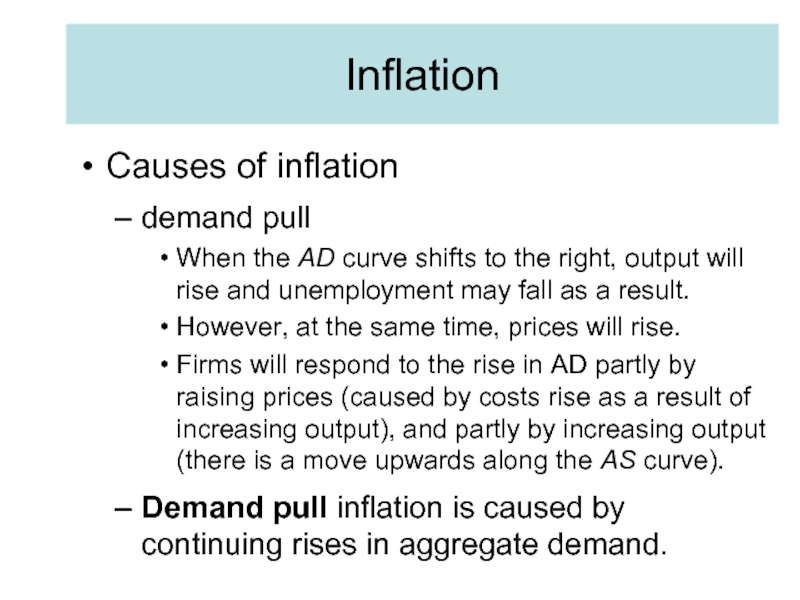
Causes of inflation
demand pull
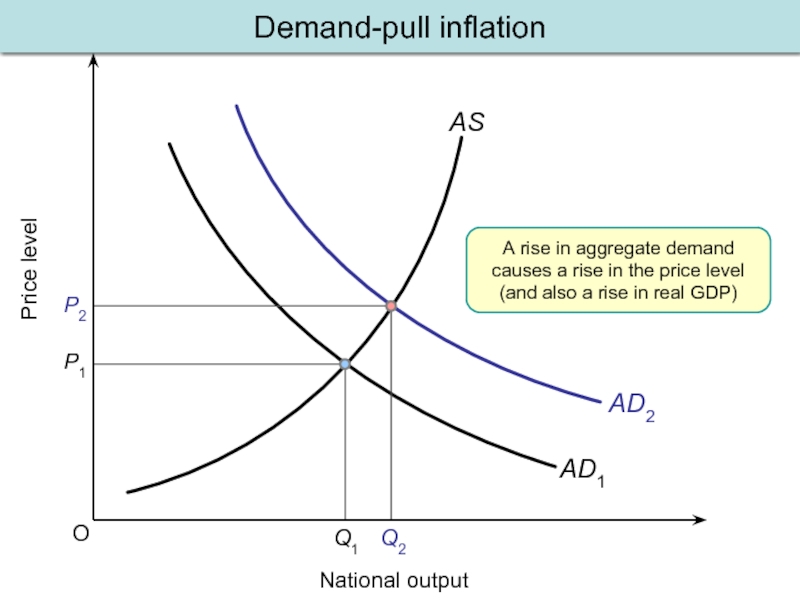
When the AD curve shifts to the right,
However, at the same time, prices will rise.
Firms will respond to the rise in AD partly by raising prices (caused by costs rise as a result of increasing output), and partly by increasing output (there is a move upwards along the AS curve).
Demand pull inflation is caused by continuing rises in aggregate demand.
Слайд 15
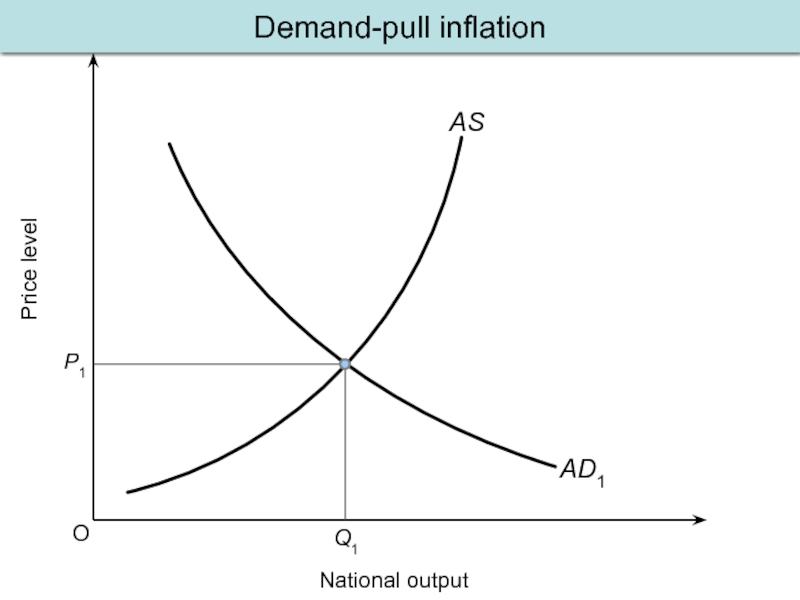
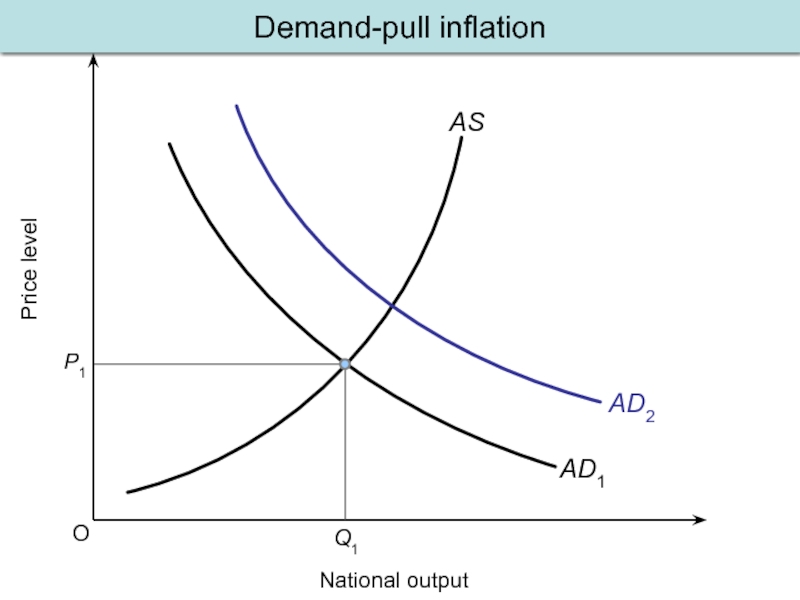
O
Price level
National output
AS
AD1
P1
Q1
AD2
P2
A rise in aggregate demand causes a rise in
Demand-pull inflation
Слайд 16
Inflation
Causes of inflation
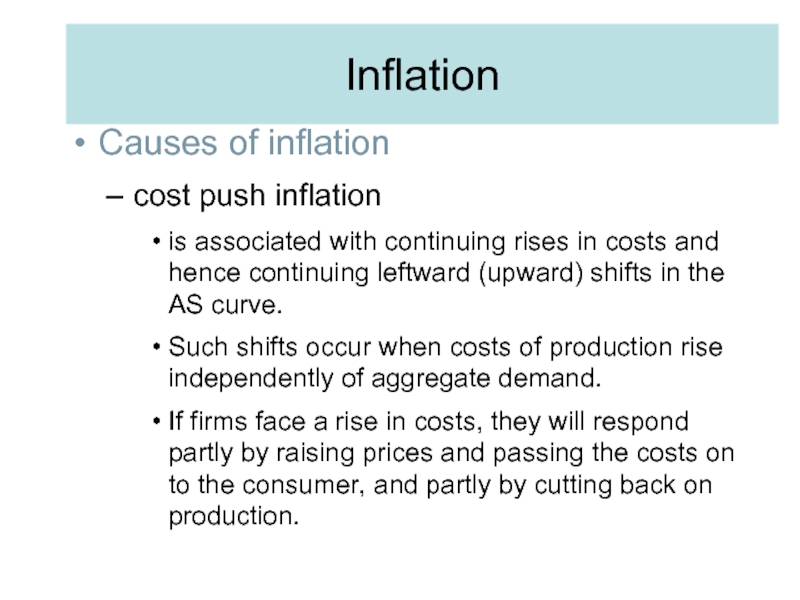
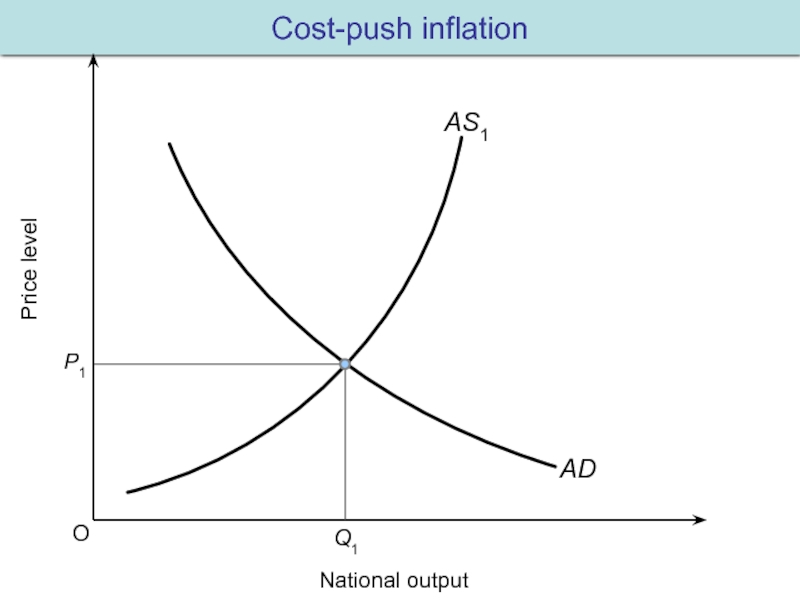
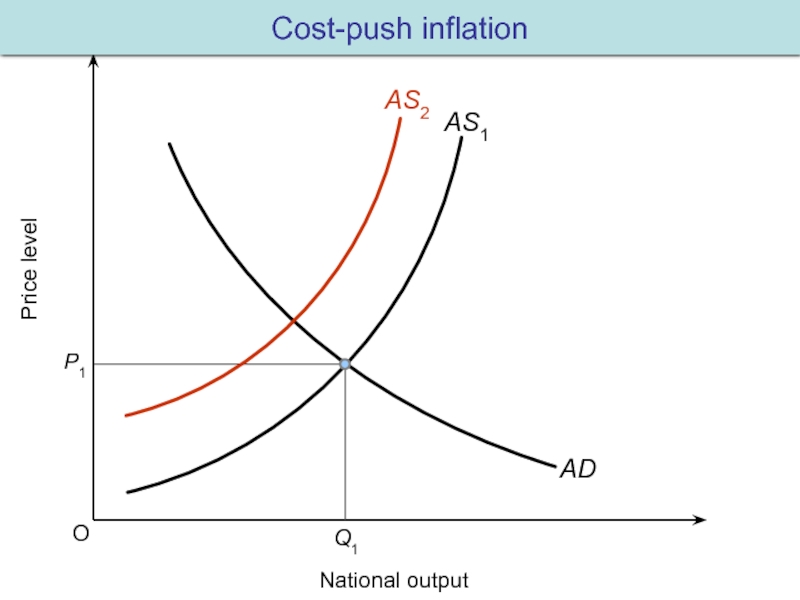
cost push inflation
is associated with continuing rises in costs
Such shifts occur when costs of production rise independently of aggregate demand.
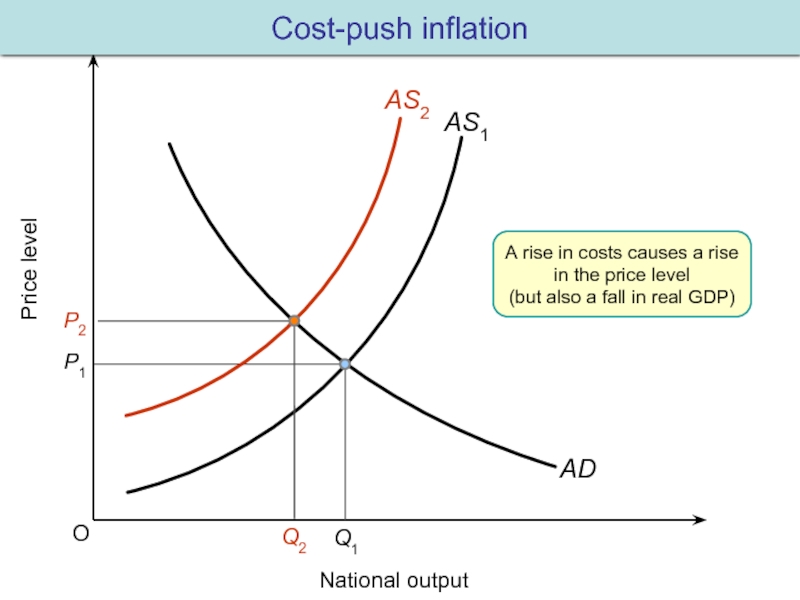
If firms face a rise in costs, they will respond partly by raising prices and passing the costs on to the consumer, and partly by cutting back on production.
Слайд 17Inflation
Rise in costs may come from:
wage push
increase in wages due
profit push
firms use their monopoly power to make bigger profits by pushing up prices independently of consumer demand
import-price push
prices rising independently of the level of AD (e.g. OPEC putting up oil prices)
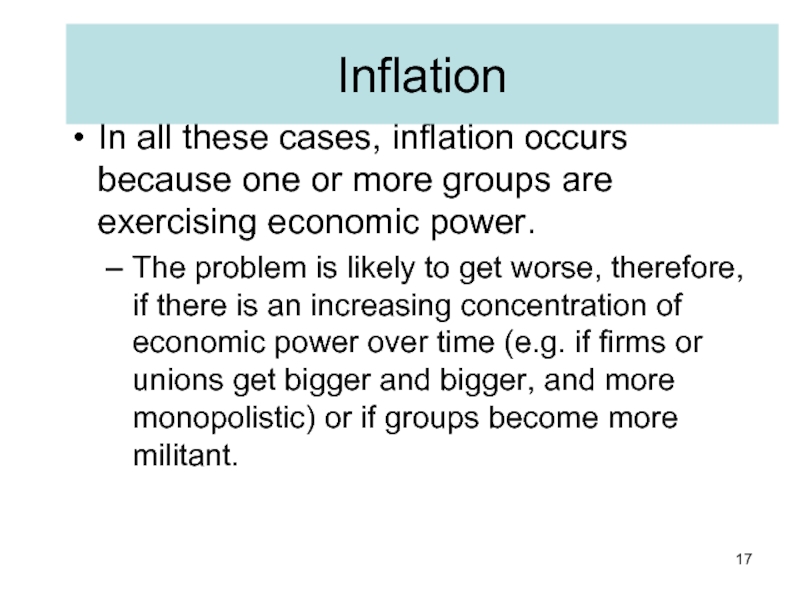
Слайд 18In all these cases, inflation occurs because one or more groups
The problem is likely to get worse, therefore, if there is an increasing concentration of economic power over time (e.g. if firms or unions get bigger and bigger, and more monopolistic) or if groups become more militant.
Inflation
Слайд 19Q Which one of the following would be the cause of
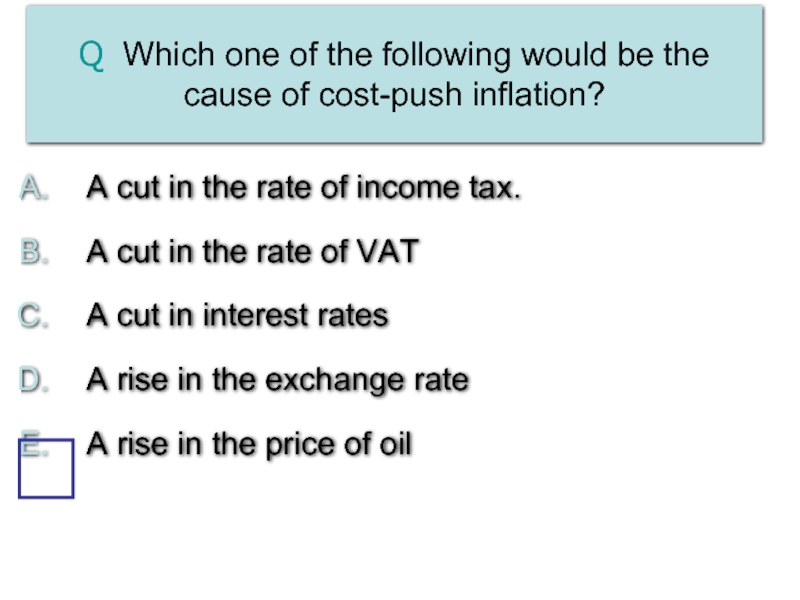
A cut in the rate of income tax.
A cut in the rate of VAT
A cut in interest rates
A rise in the exchange rate
A rise in the price of oil
Слайд 22
O
Price level
National output
AS1
AD
P1
Q1
AS2
P2
A rise in costs causes a rise in the
Cost-push inflation
Слайд 23With the growth in demand for raw materials and food (China,
Thus, what starts with a rise in aggregate demand in these countries (demand-pull inflation), becomes cost-push inflation for other countries due to globalisation, having to pay higher prices for the commodities they import.
Inflation
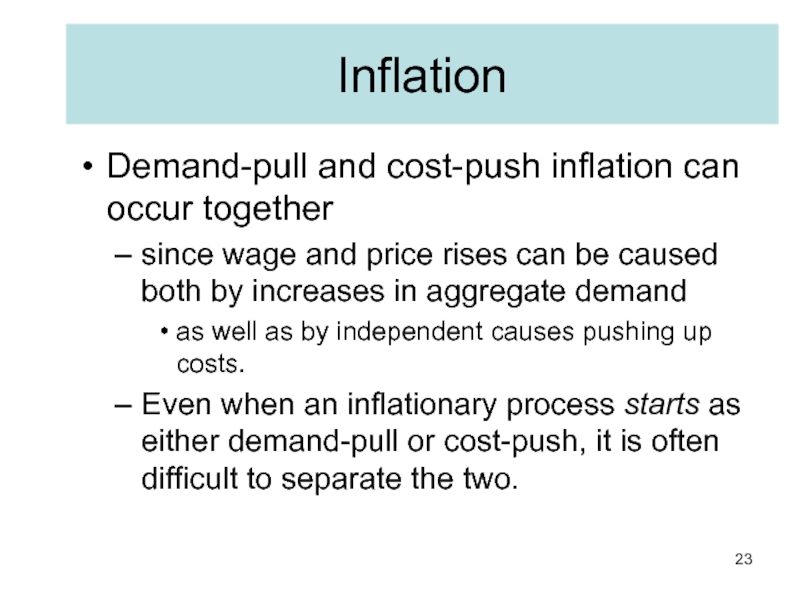
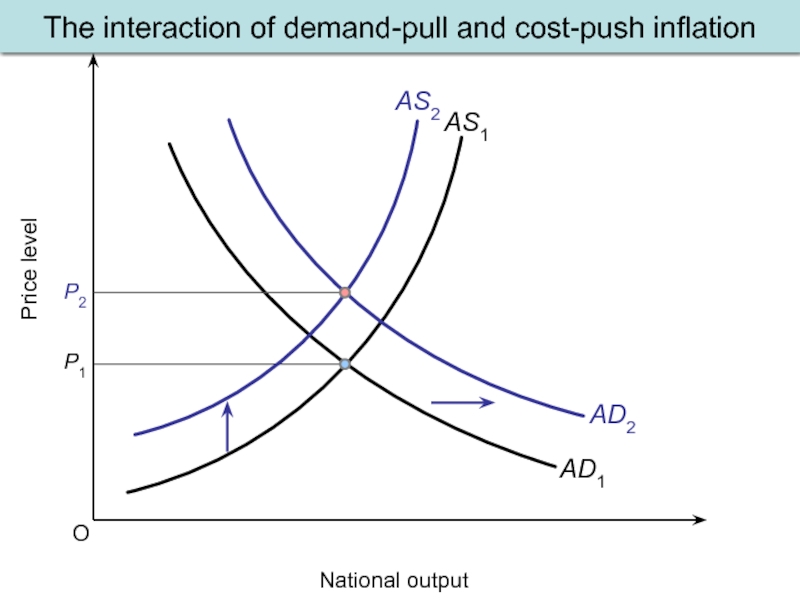
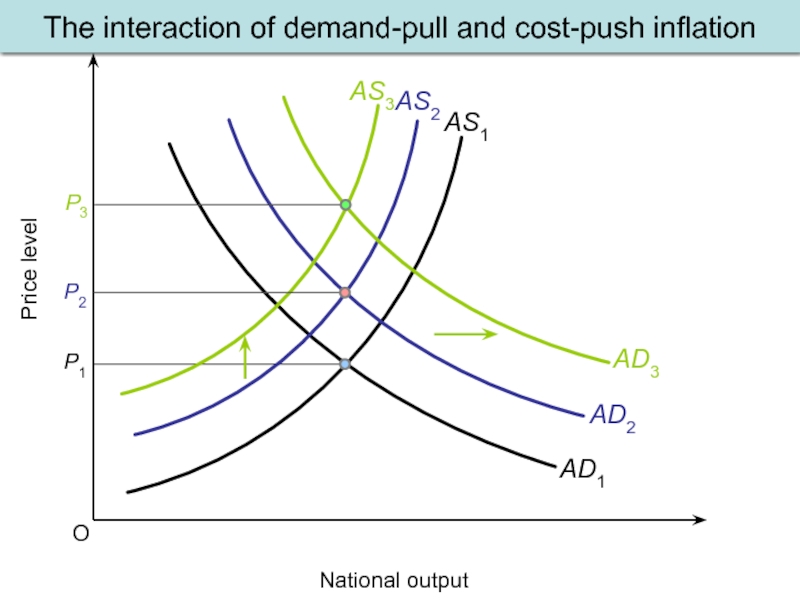
Слайд 24Demand-pull and cost-push inflation can occur together
since wage and price rises
as well as by independent causes pushing up costs.
Even when an inflationary process starts as either demand-pull or cost-push, it is often difficult to separate the two.
Inflation
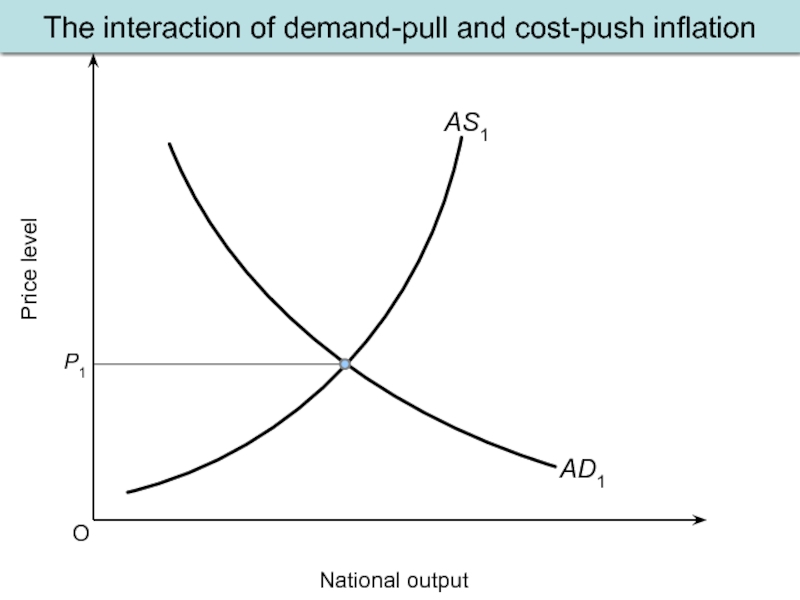
Слайд 26
O
Price level
National output
AS1
AD1
P1
AS2
AD2
The interaction of demand-pull and cost-push inflation
Слайд 27
O
Price level
National output
AS1
AD1
P1
AD2
P2
AS3
AD3
AS2
The interaction of demand-pull and cost-push inflation
Слайд 28
Inflation
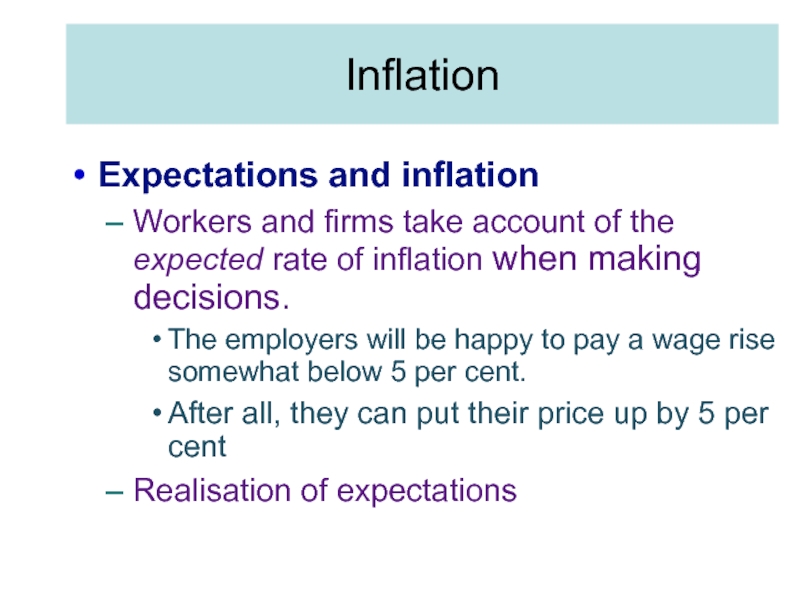
Expectations and inflation
Workers and firms take account of the expected rate
The employers will be happy to pay a wage rise somewhat below 5 per cent.
After all, they can put their price up by 5 per cent
Realisation of expectations
Слайд 30Aims of this session:
Add Government spending and foreign trade as additional
Explain what we mean by fiscal and monetary policy
Show how fiscal and monetary policy may affect aggregate demand
Слайд 31Fiscal policy
Fiscal policy is the government’s decisions about spending and taxes.
Automatic
Слайд 33Government and aggregate demand 1
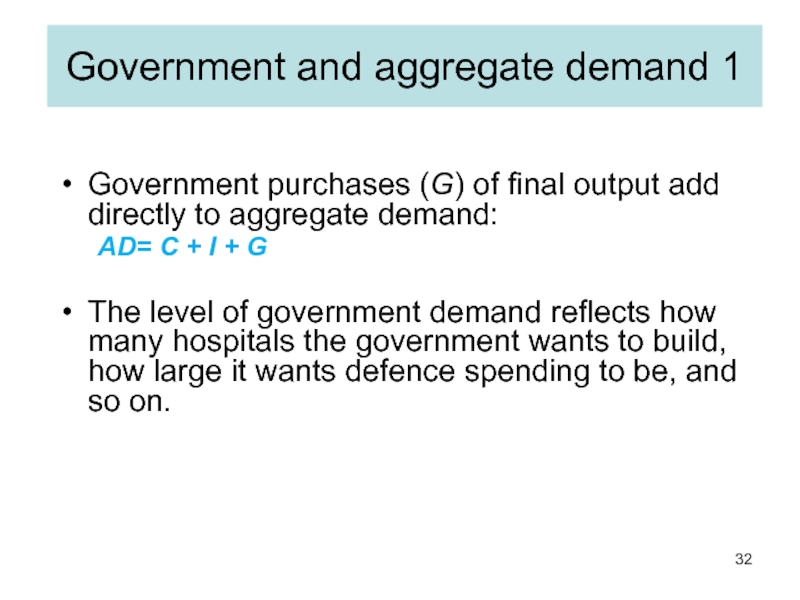
Government purchases (G) of final output add
AD= C + I + G
The level of government demand reflects how many hospitals the government wants to build, how large it wants defence spending to be, and so on.
Слайд 34Government and aggregate demand 2
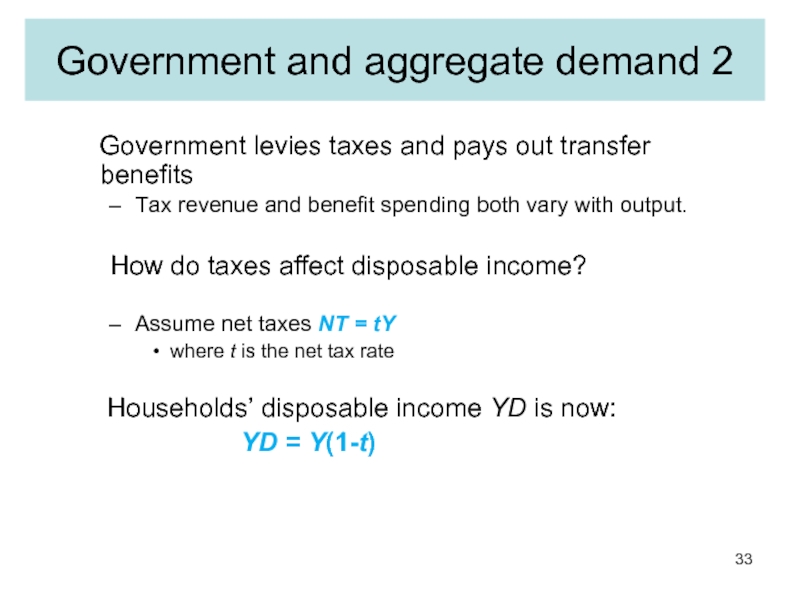
Government levies taxes and pays
Tax revenue and benefit spending both vary with output.
How do taxes affect disposable income?
Assume net taxes NT = tY
where t is the net tax rate
Households’ disposable income YD is now:
YD = Y(1-t)
Слайд 35The open economy: foreign trade and output determination
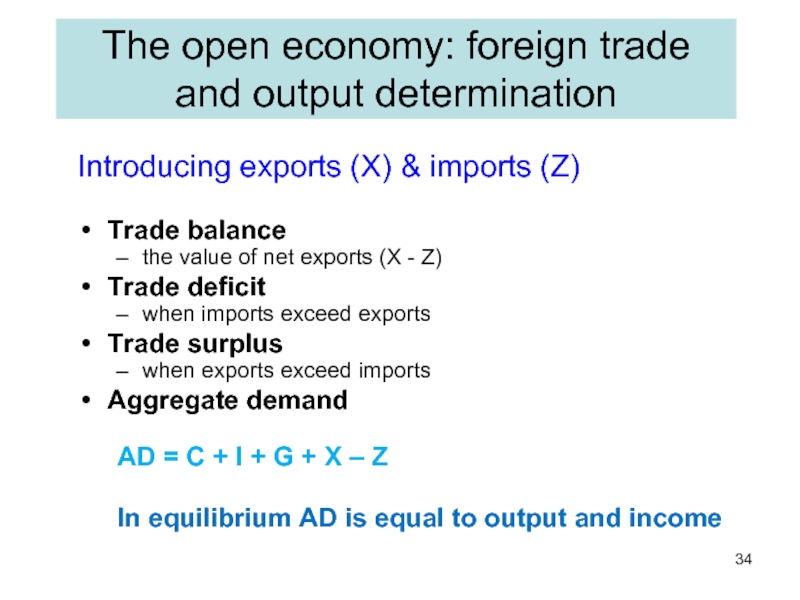
Introducing exports (X)
Trade balance
the value of net exports (X - Z)
Trade deficit
when imports exceed exports
Trade surplus
when exports exceed imports
Aggregate demand
AD = C + I + G + X – Z
In equilibrium AD is equal to output and income
Слайд 37Monetary Policy I
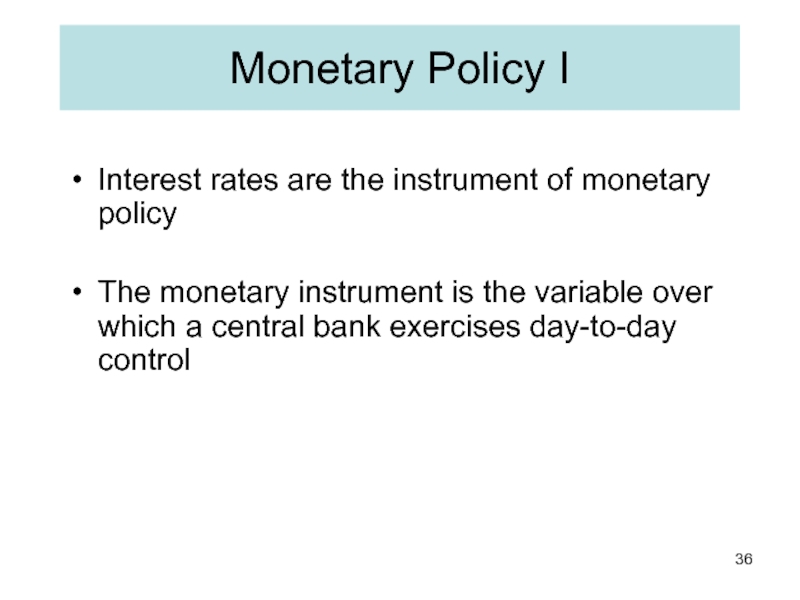
Interest rates are the instrument of monetary policy
The monetary
Слайд 38Monetary Policy II
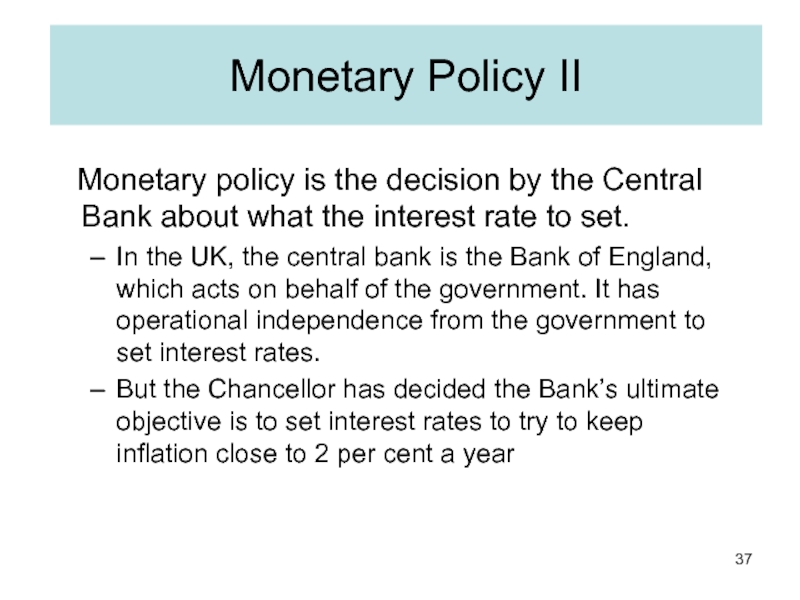
Monetary policy is the decision by the
In the UK, the central bank is the Bank of England, which acts on behalf of the government. It has operational independence from the government to set interest rates.
But the Chancellor has decided the Bank’s ultimate objective is to set interest rates to try to keep inflation close to 2 per cent a year
Слайд 39Nominal vs Real Interest Rates
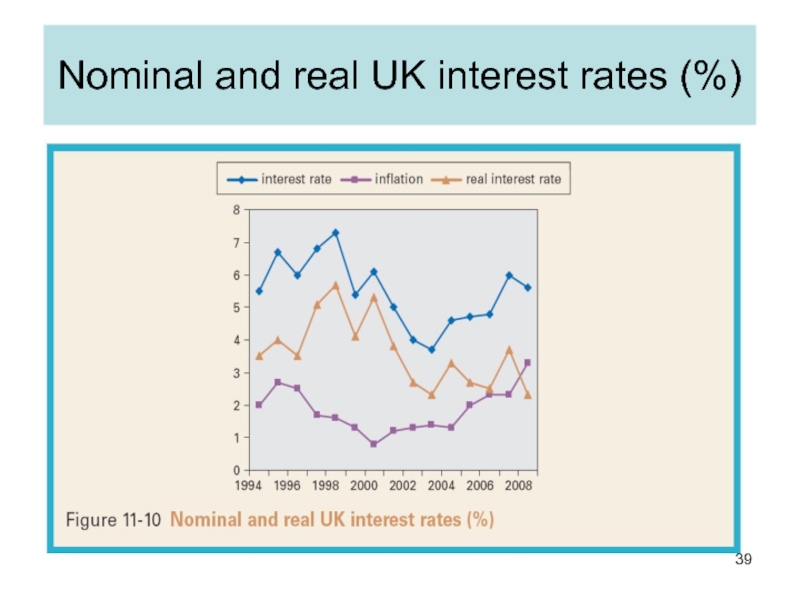
The real interest rate is the difference
Слайд 41How interest rates affect
the economy
Interest rates influence:
personal consumption by changing the
investment demand by raising the opportunity cost of capital
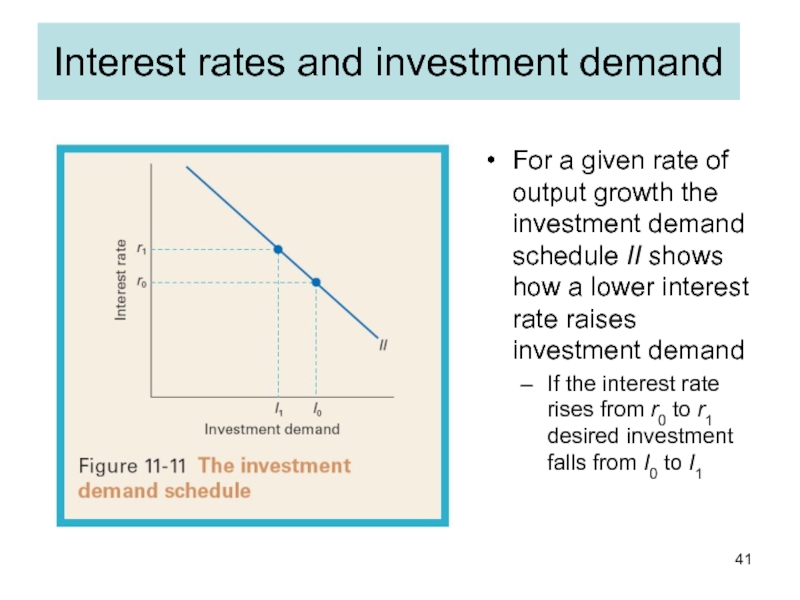
Слайд 42Interest rates and investment demand
For a given rate of output growth
If the interest rate rises from r0 to r1 desired investment falls from I0 to I1
Слайд 43Lower interest rates increase aggregate demand 1
Lower interest rates induce an
Equivalently, lower interest rates increase desired investment at any output
but also, by reducing desired consumption, they raise the desire to save at any output
Слайд 44Demand management and the policy mix
Demand management is the use of
The government can use fiscal and monetary policy to control demand
loose fiscal policy can be used with tight monetary policy or vice versa
the former suggests a large public sector; the latter a smaller public sector
the mix of policies affects the composition of output
