- Главная
- Разное
- Дизайн
- Бизнес и предпринимательство
- Аналитика
- Образование
- Развлечения
- Красота и здоровье
- Финансы
- Государство
- Путешествия
- Спорт
- Недвижимость
- Армия
- Графика
- Культурология
- Еда и кулинария
- Лингвистика
- Английский язык
- Астрономия
- Алгебра
- Биология
- География
- Детские презентации
- Информатика
- История
- Литература
- Маркетинг
- Математика
- Медицина
- Менеджмент
- Музыка
- МХК
- Немецкий язык
- ОБЖ
- Обществознание
- Окружающий мир
- Педагогика
- Русский язык
- Технология
- Физика
- Философия
- Химия
- Шаблоны, картинки для презентаций
- Экология
- Экономика
- Юриспруденция
Indicators of economic efficiency презентация
Содержание
- 1. Indicators of economic efficiency
- 2. 3 Key Economic indicators
- 3. Gross Domestic Product market value of all
- 4. Intermediate goods Resources of any kind Used
- 5. C: consumer spending Daily spending on goods
- 6. G: government spending Spending by all levels
- 7. Example: In 2000, estimates in trillions of
- 8. Unemployment Rate Percentage of labor force who
- 9. People are out of work temporarily Seasonal
- 10. Unemployment because your job skills are no
- 11. People are unemployed due to fluctuations in
- 12. Consumer Price Index Index of all goods
- 13. Inflation Rising price levels purchasing power of
- 14. Hyperinflation: rapid inflation ex. Germany after WWII
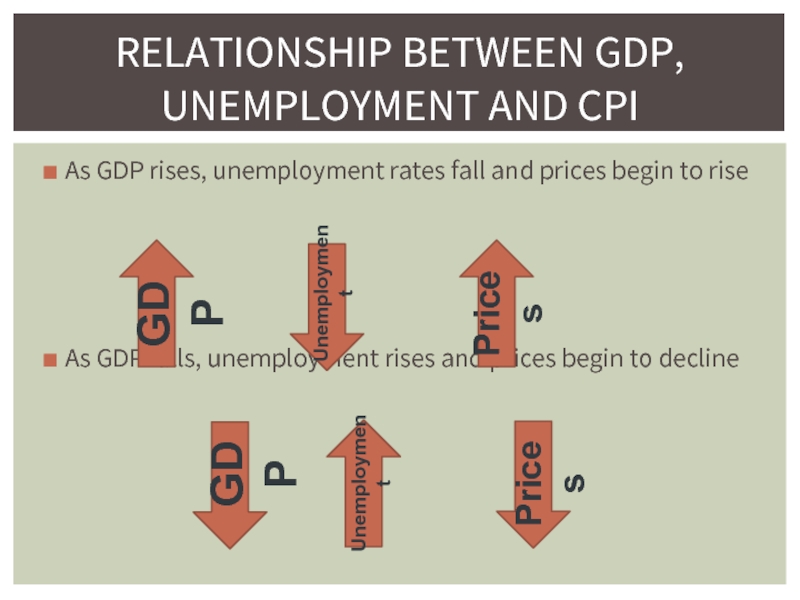
- 15. As GDP rises, unemployment rates fall and
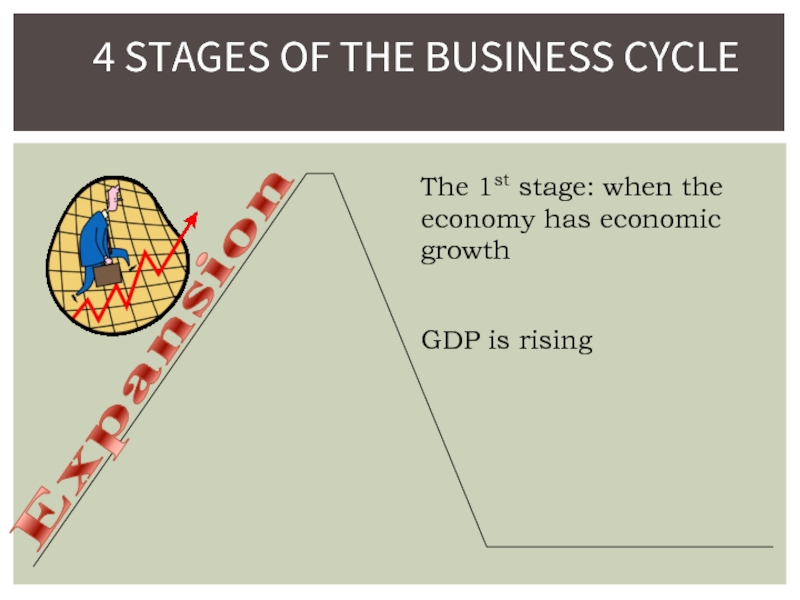
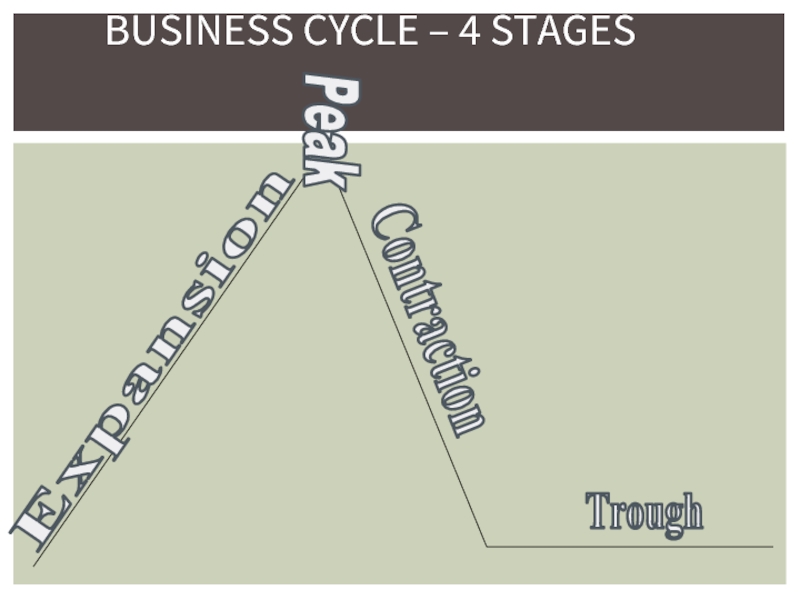
- 16. 4 STAGES OF THE BUSINESS CYCLE Expansion
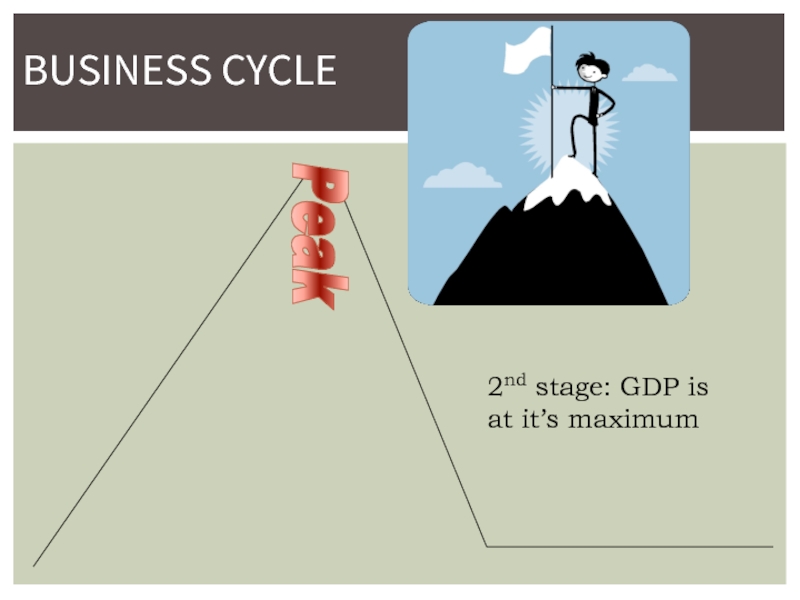
- 17. BUSINESS CYCLE Peak 2nd stage: GDP is at it’s maximum
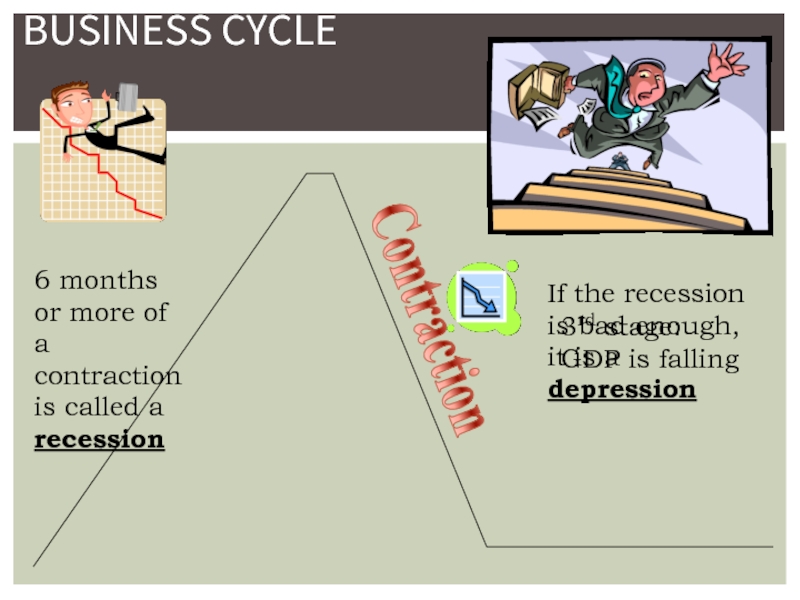
- 18. BUSINESS CYCLE Contraction 3rd stage: GDP is
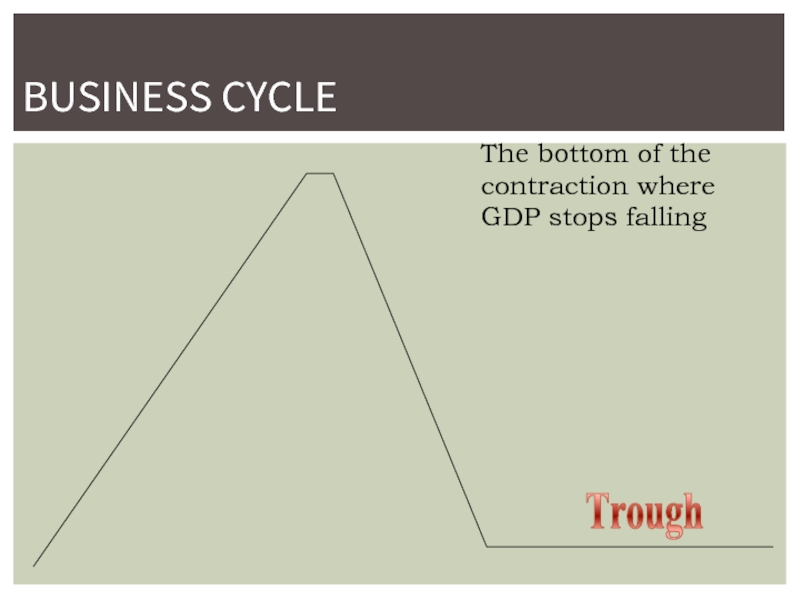
- 19. BUSINESS CYCLE Trough The bottom of the contraction where GDP stops falling
- 20. BUSINESS CYCLE – 4 STAGES Expansion Peak Contraction Trough
- 21. Aggregate means “total” Total demand
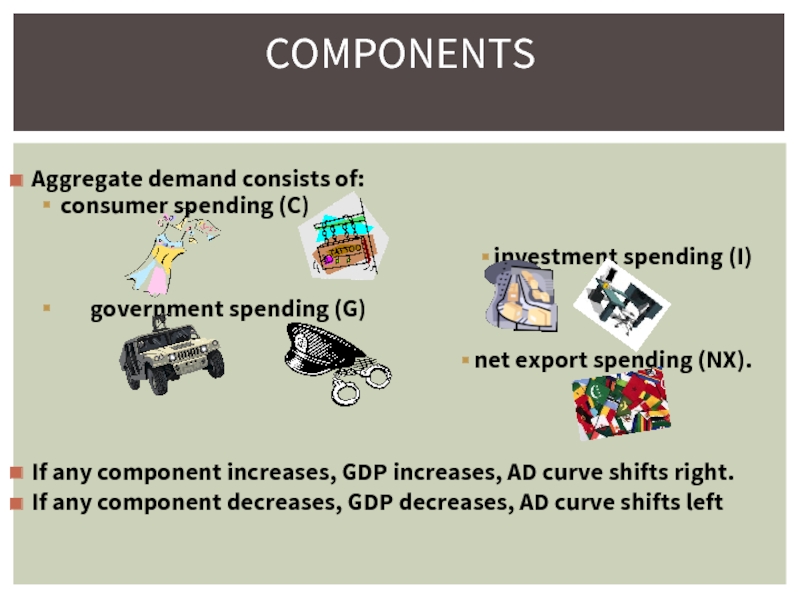
- 22. Aggregate demand consists of: consumer spending
- 23. High price level leads to lower quantity
- 24. Total production of ALL FINAL goods and
Слайд 3Gross Domestic Product
market value of all final goods and services produced
Final goods are purchased by the last user and will not be resold or used to produce anything else
GDP
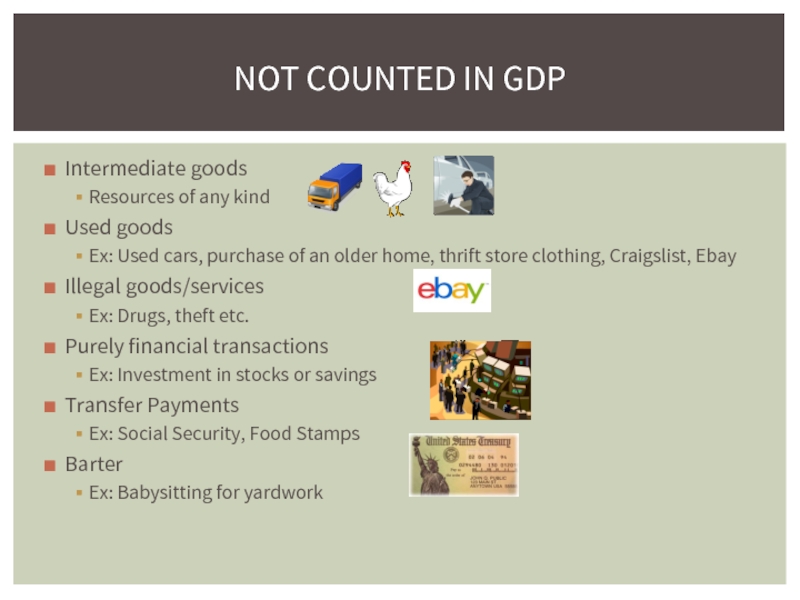
Слайд 4Intermediate goods
Resources of any kind
Used goods
Ex: Used cars, purchase of an
Illegal goods/services
Ex: Drugs, theft etc.
Purely financial transactions
Ex: Investment in stocks or savings
Transfer Payments
Ex: Social Security, Food Stamps
Barter
Ex: Babysitting for yardwork
NOT COUNTED IN GDP
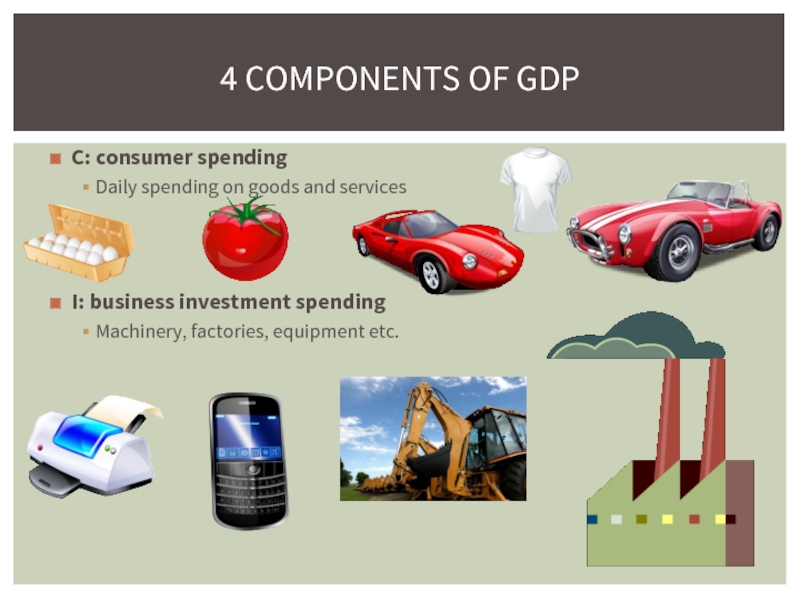
Слайд 5C: consumer spending
Daily spending on goods and services
I: business investment spending
Machinery,
4 COMPONENTS OF GDP
Слайд 6G: government spending
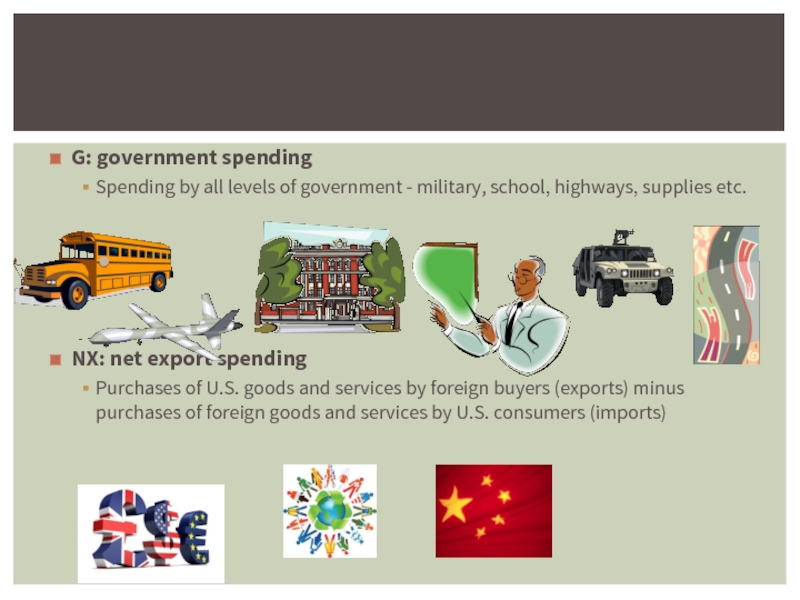
Spending by all levels of government - military, school,
NX: net export spending
Purchases of U.S. goods and services by foreign buyers (exports) minus purchases of foreign goods and services by U.S. consumers (imports)
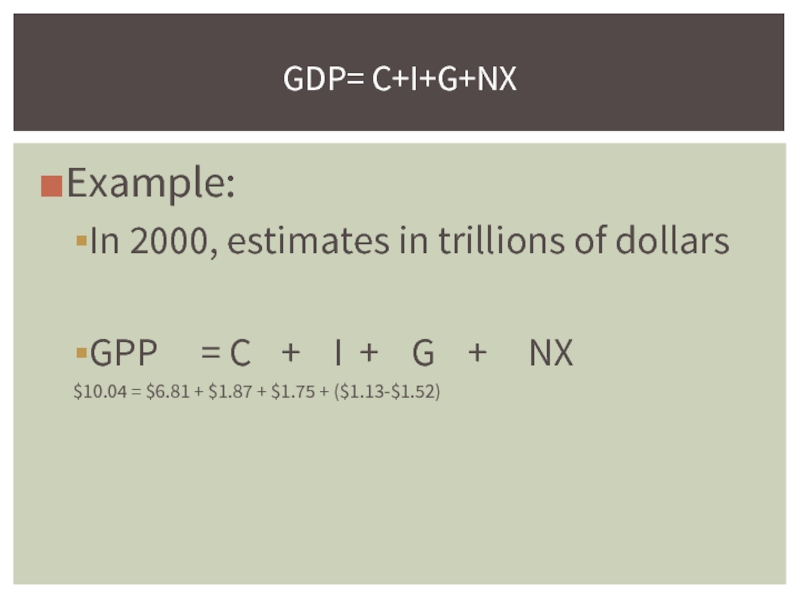
Слайд 7Example:
In 2000, estimates in trillions of dollars
GPP = C + I
$10.04 = $6.81 + $1.87 + $1.75 + ($1.13-$1.52)
GDP= C+I+G+NX
Слайд 8Unemployment Rate
Percentage of labor force who is not working
Labor Force: everyone
3 types of unemployment
Unemployment
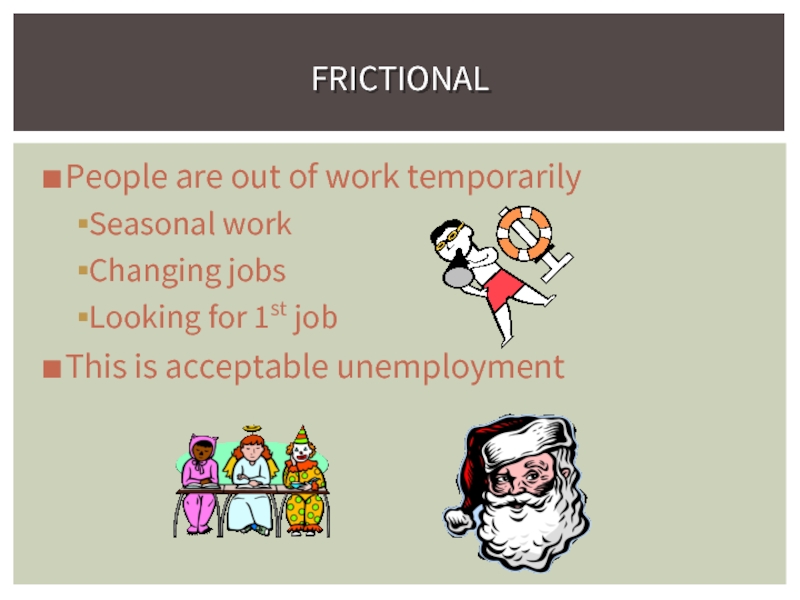
Слайд 9People are out of work temporarily
Seasonal work
Changing jobs
Looking for 1st job
This
FRICTIONAL
Слайд 10Unemployment because your job skills are no longer needed
Ex. Technology replaces
People can go back to school and learn new skills
STRUCTURAL
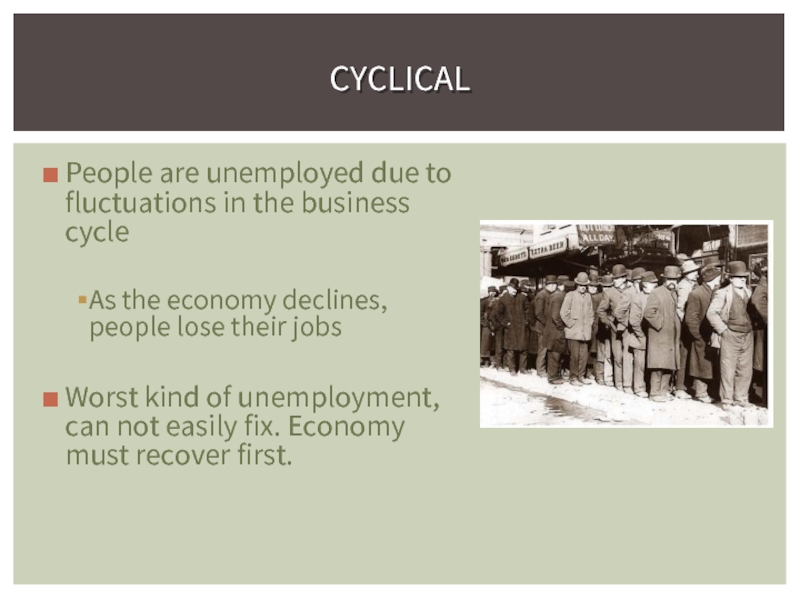
Слайд 11People are unemployed due to fluctuations in the business cycle
As the
Worst kind of unemployment, can not easily fix. Economy must recover first.
CYCLICAL
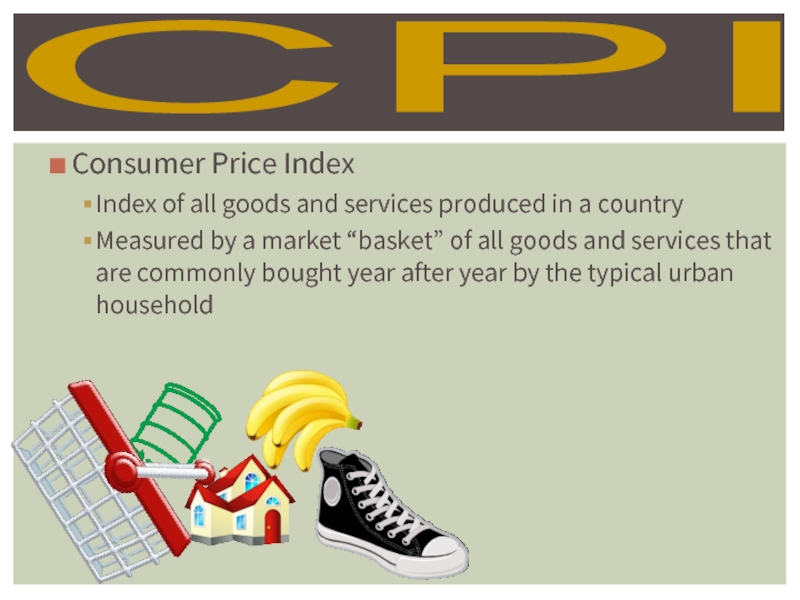
Слайд 12Consumer Price Index
Index of all goods and services produced in a
Measured by a market “basket” of all goods and services that are commonly bought year after year by the typical urban household
CPI
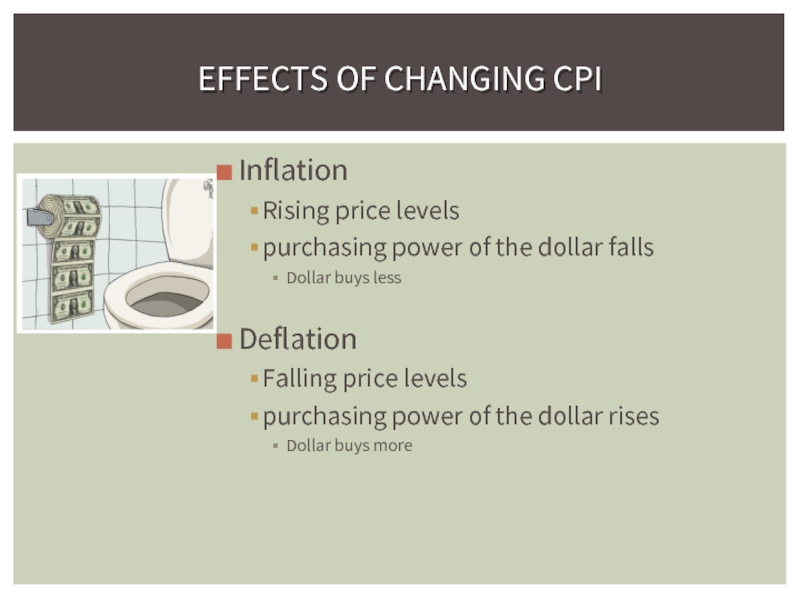
Слайд 13Inflation
Rising price levels
purchasing power of the dollar falls
Dollar buys less
Deflation
Falling price
purchasing power of the dollar rises
Dollar buys more
EFFECTS OF CHANGING CPI
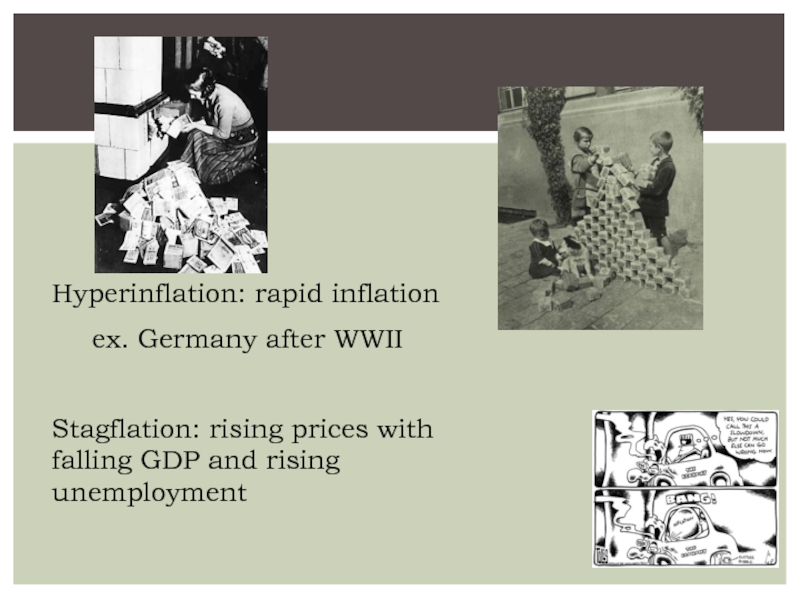
Слайд 14Hyperinflation: rapid inflation
ex. Germany after WWII
Stagflation: rising prices with falling GDP
Слайд 15As GDP rises, unemployment rates fall and prices begin to rise
As
RELATIONSHIP BETWEEN GDP, UNEMPLOYMENT AND CPI
GDP
GDP
Prices
Unemployment
Unemployment
Prices
Слайд 164 STAGES OF THE BUSINESS CYCLE
Expansion
The 1st stage: when the economy
GDP is rising
Слайд 18BUSINESS CYCLE
Contraction
3rd stage: GDP is falling
6 months or more of a
If the recession is bad enough, it is a depression
Слайд 21
Aggregate means “total”
Total demand for ALL FINAL goods and services in
from all people in the economy
for all prices levels
Aggregate Demand
Слайд 22Aggregate demand consists of:
consumer spending (C)
investment spending (I)
net export spending (NX).
If any component increases, GDP increases, AD curve shifts right.
If any component decreases, GDP decreases, AD curve shifts left
COMPONENTS
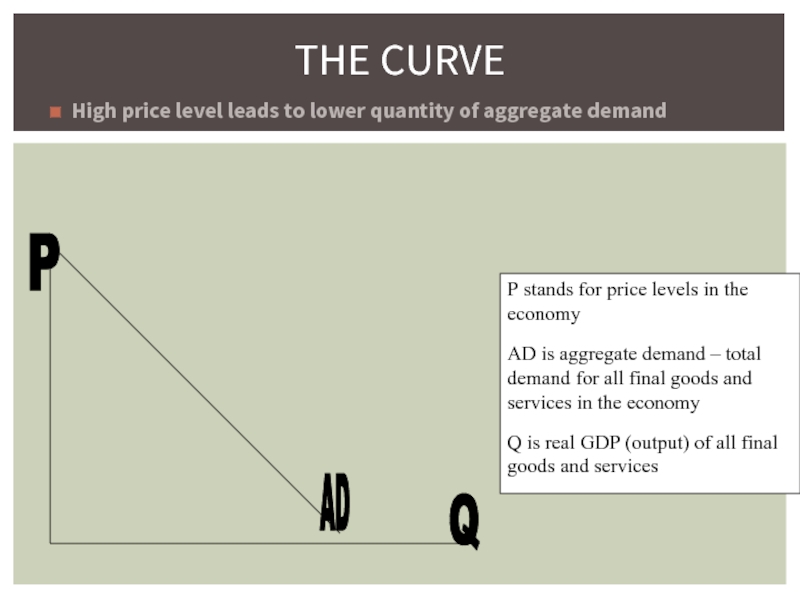
Слайд 23High price level leads to lower quantity of aggregate demand
THE CURVE
P
AD
Q
P
AD is aggregate demand – total demand for all final goods and services in the economy
Q is real GDP (output) of all final goods and services
Слайд 24Total production of ALL FINAL goods and services in the economy
from all poducers in the economy
for all prices levels
AGGREGATE SUPPLY
