- Главная
- Разное
- Дизайн
- Бизнес и предпринимательство
- Аналитика
- Образование
- Развлечения
- Красота и здоровье
- Финансы
- Государство
- Путешествия
- Спорт
- Недвижимость
- Армия
- Графика
- Культурология
- Еда и кулинария
- Лингвистика
- Английский язык
- Астрономия
- Алгебра
- Биология
- География
- Детские презентации
- Информатика
- История
- Литература
- Маркетинг
- Математика
- Медицина
- Менеджмент
- Музыка
- МХК
- Немецкий язык
- ОБЖ
- Обществознание
- Окружающий мир
- Педагогика
- Русский язык
- Технология
- Физика
- Философия
- Химия
- Шаблоны, картинки для презентаций
- Экология
- Экономика
- Юриспруденция
Forests, agriculture and climate презентация
Содержание
- 1. Forests, agriculture and climate
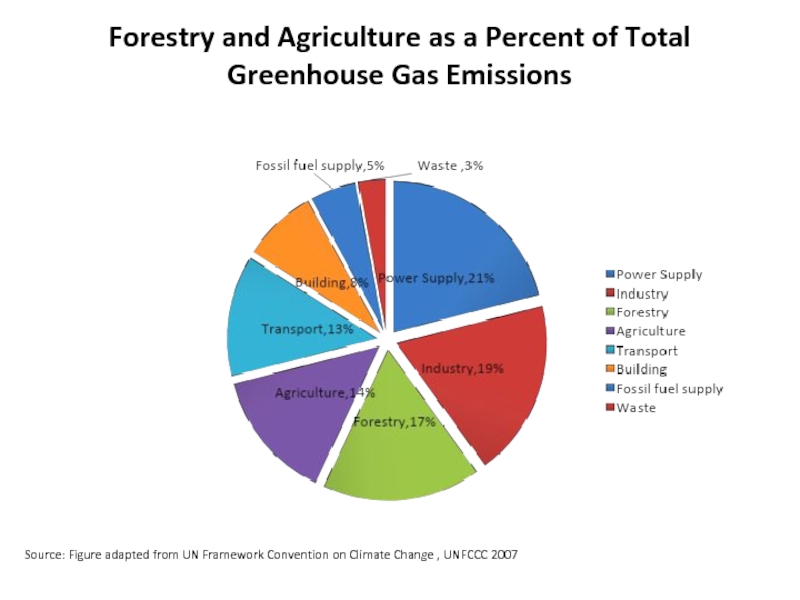
- 2. Forestry and Agriculture as a Percent of
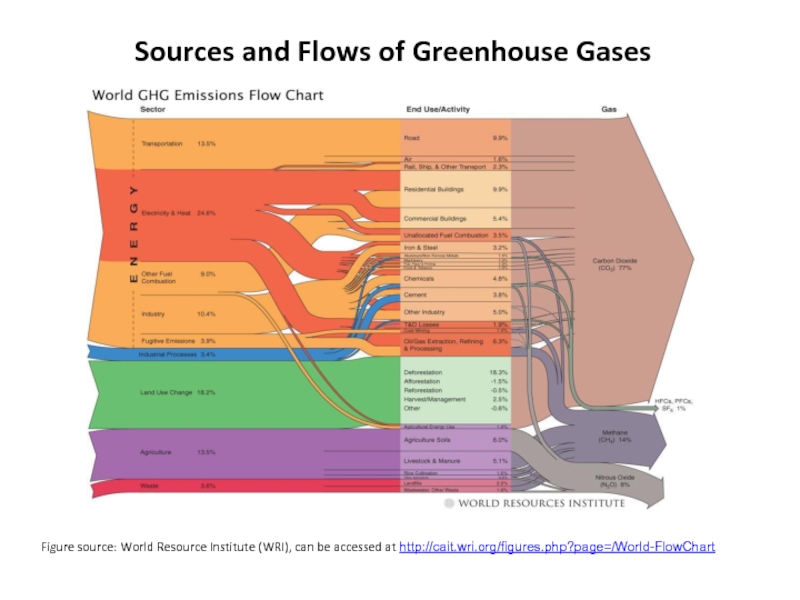
- 3. Sources and Flows of Greenhouse Gases
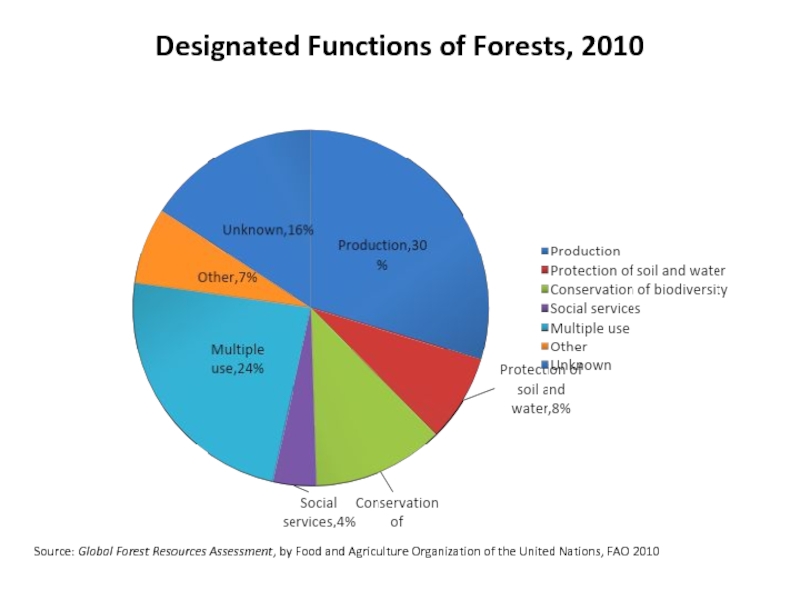
- 4. Designated Functions of Forests, 2010 Source:
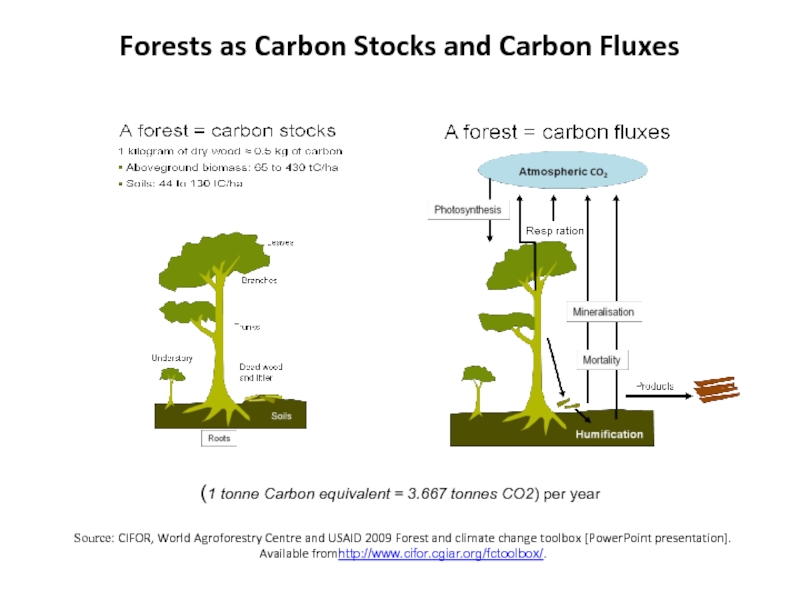
- 5. Forests as Carbon Stocks and Carbon Fluxes
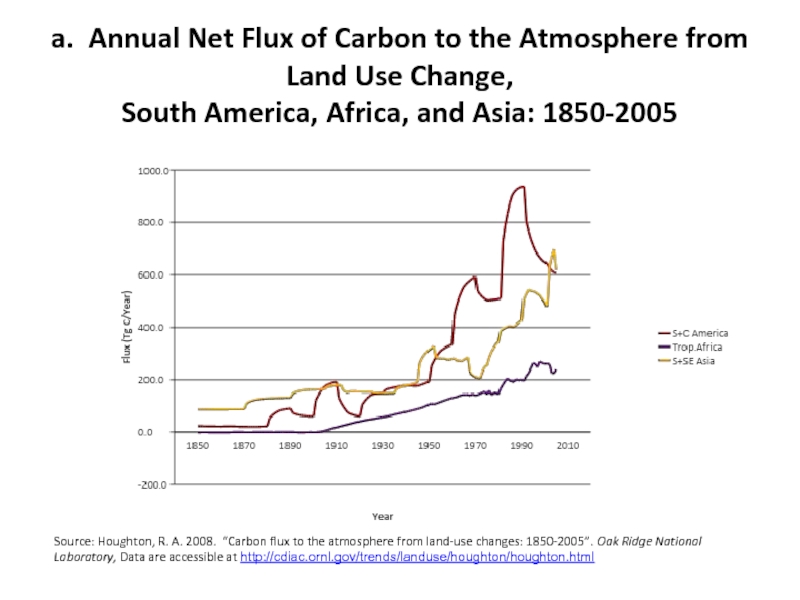
- 7. a. Annual Net Flux of Carbon to
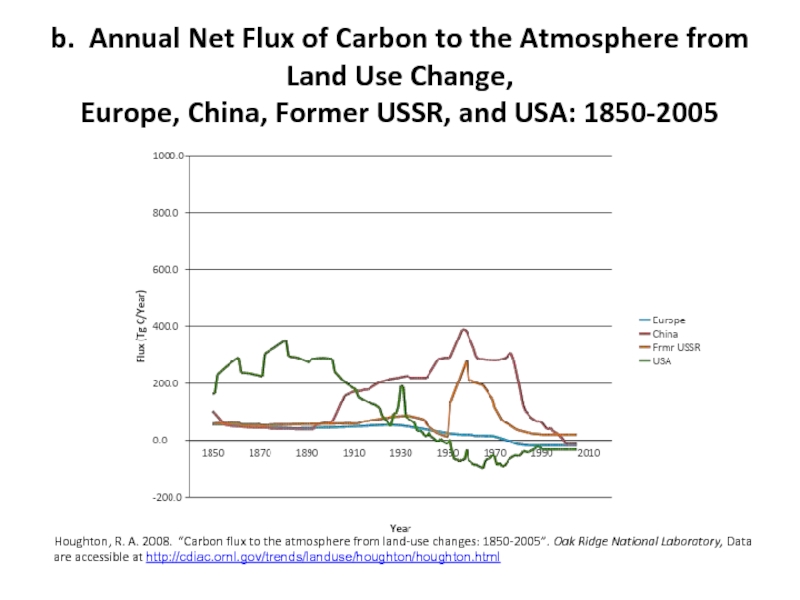
- 8. b. Annual Net Flux of Carbon to
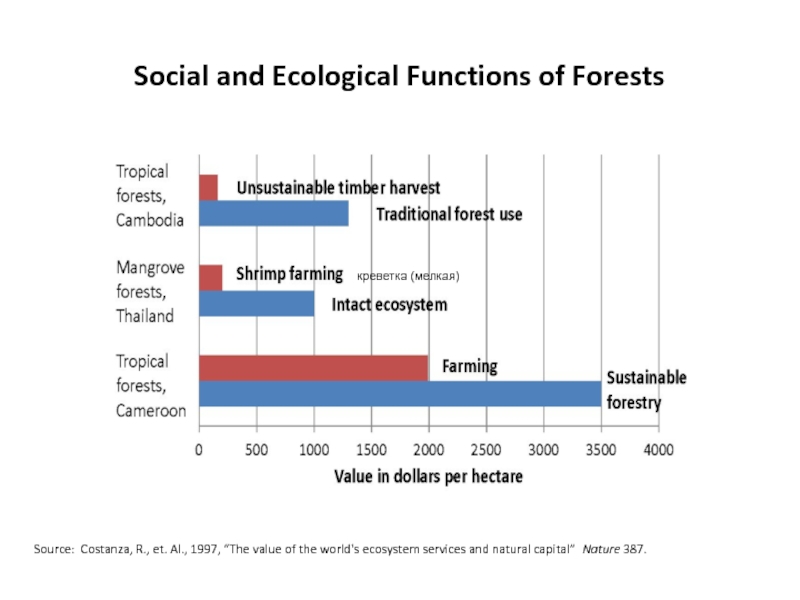
- 9. Social and Ecological Functions of Forests Source:
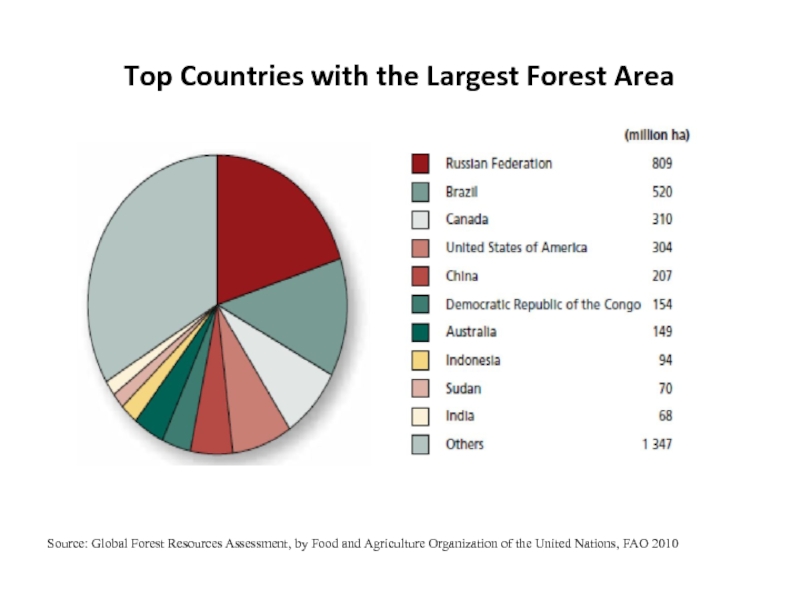
- 10. Top Countries with the Largest Forest Area
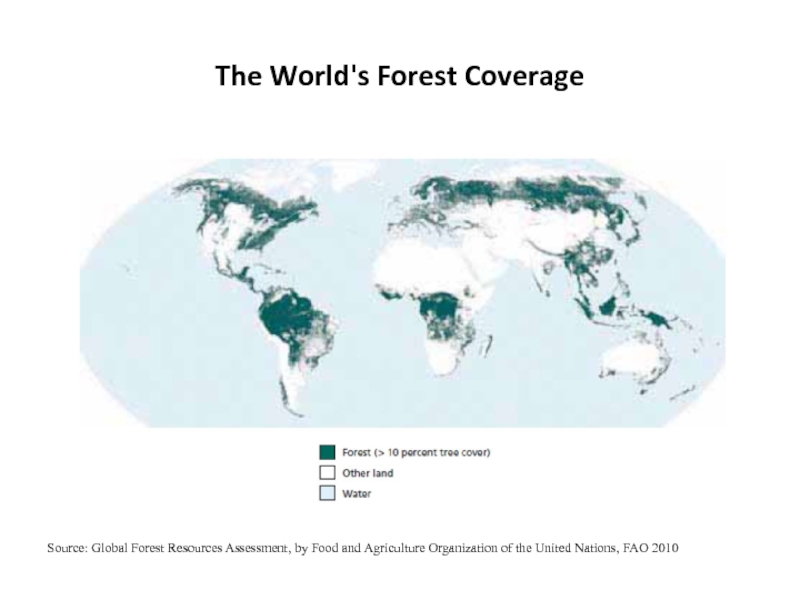
- 11. The World's Forest Coverage Source: Global Forest
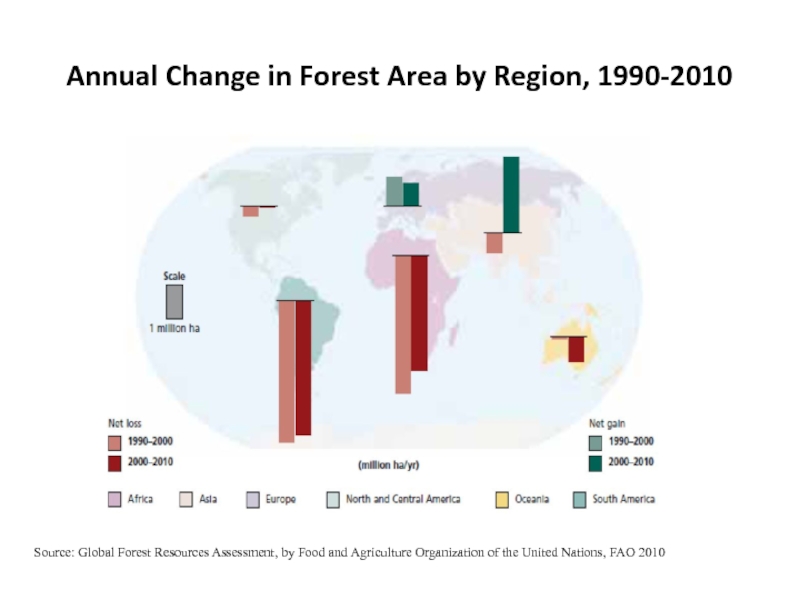
- 12. Annual Change in Forest Area by Region,
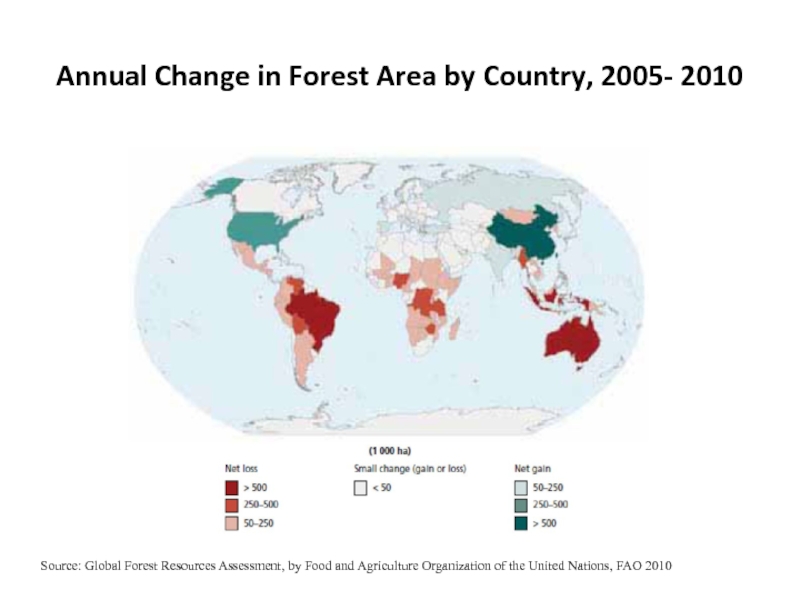
- 13. Annual Change in Forest Area by Country,
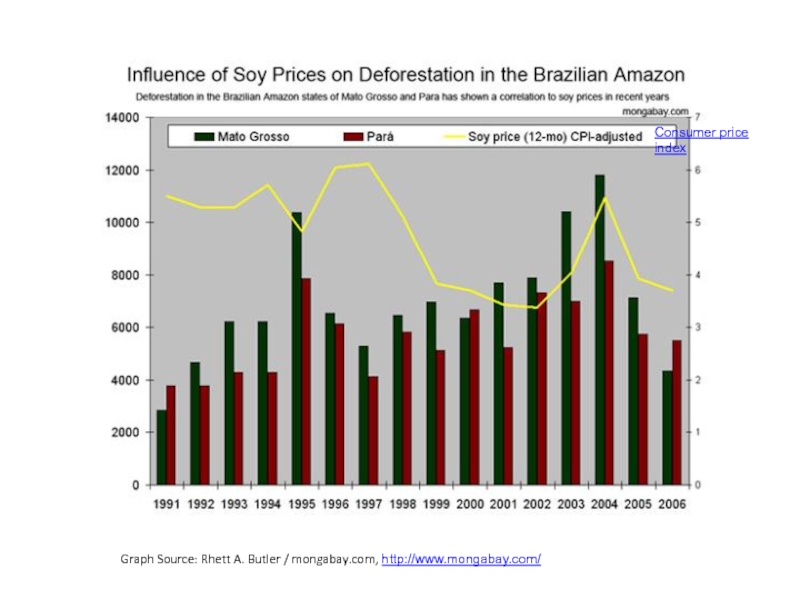
- 14. Graph Source: Rhett A. Butler / mongabay.com, http://www.mongabay.com/ Consumer price index
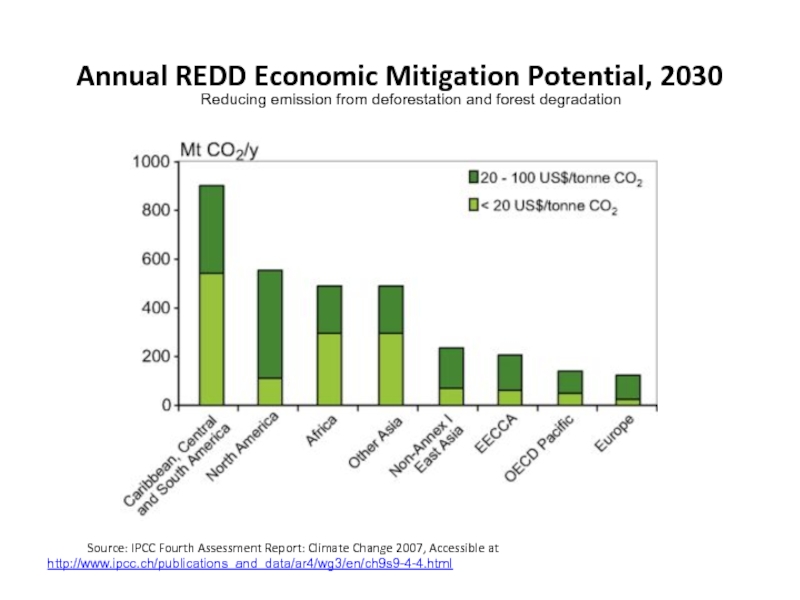
- 15. Annual REDD Economic Mitigation Potential, 2030
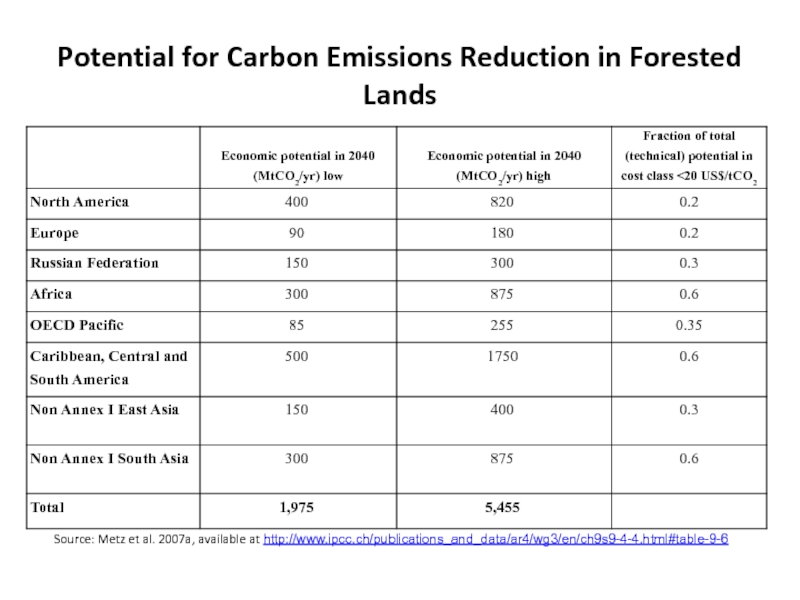
- 16. Potential for Carbon Emissions Reduction in Forested
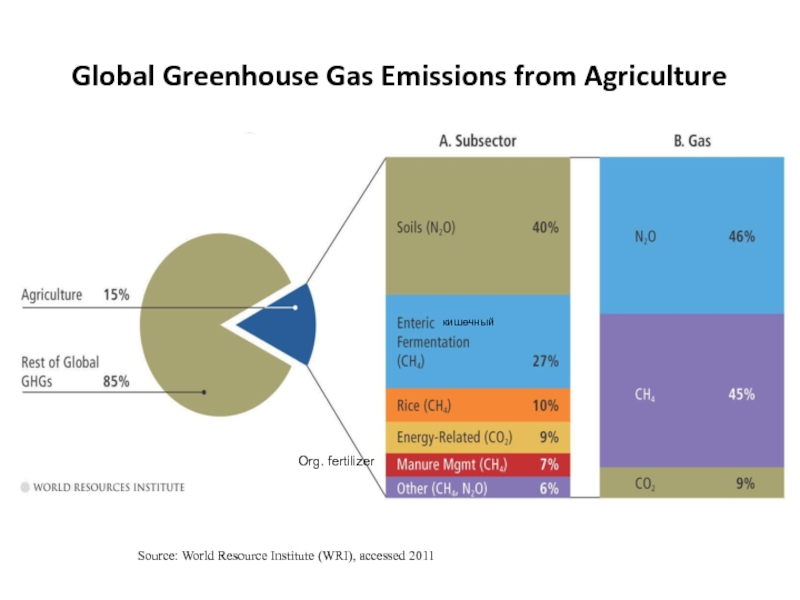
- 17. Global Greenhouse Gas Emissions from Agriculture Source:
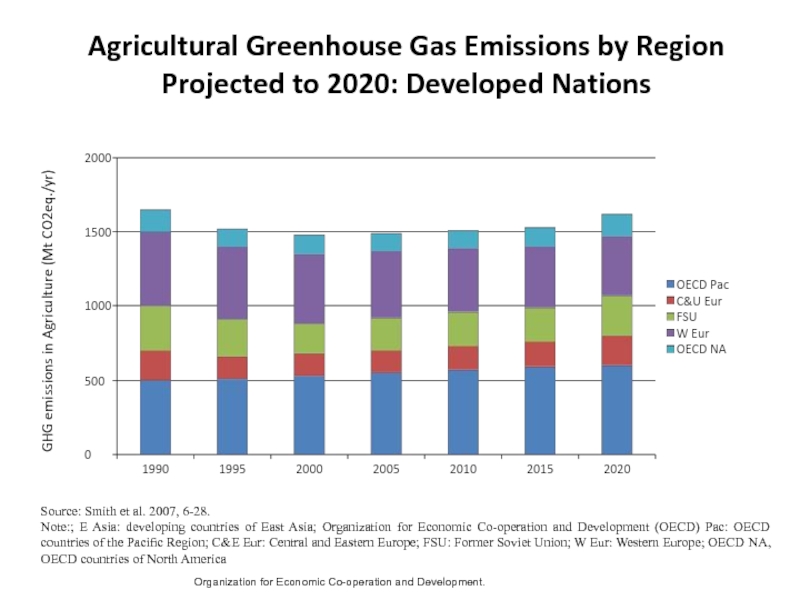
- 18. Agricultural Greenhouse Gas Emissions by Region Projected
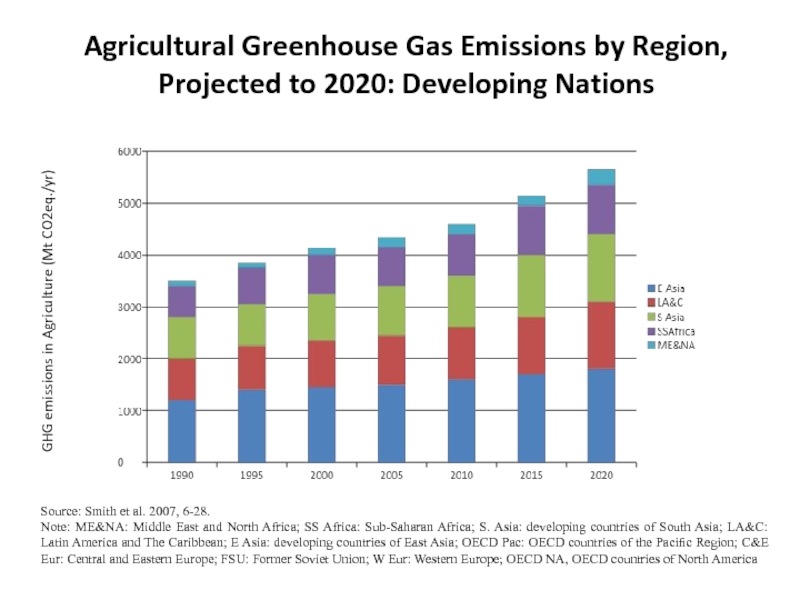
- 19. Agricultural Greenhouse Gas Emissions by Region, Projected
Слайд 2Forestry and Agriculture as a Percent of Total Greenhouse Gas Emissions
Source:
Слайд 3Sources and Flows of Greenhouse Gases
Figure source: World Resource Institute
Слайд 4Designated Functions of Forests, 2010
Source: Global Forest Resources Assessment, by Food
Слайд 5Forests as Carbon Stocks and Carbon Fluxes
Source: CIFOR, World
(1 tonne Carbon equivalent = 3.667 tonnes CO2) per year
Слайд 7a. Annual Net Flux of Carbon to the Atmosphere from Land
Source: Houghton, R. A. 2008. “Carbon flux to the atmosphere from land-use changes: 1850-2005”. Oak Ridge National Laboratory, Data are accessible at http://cdiac.ornl.gov/trends/landuse/houghton/houghton.html
Слайд 8b. Annual Net Flux of Carbon to the Atmosphere from Land
Houghton, R. A. 2008. “Carbon flux to the atmosphere from land-use changes: 1850-2005”. Oak Ridge National Laboratory, Data are accessible at http://cdiac.ornl.gov/trends/landuse/houghton/houghton.html
Слайд 9Social and Ecological Functions of Forests
Source: Costanza, R., et. Al., 1997,
креветка (мелкая)
Слайд 10Top Countries with the Largest Forest Area
Source: Global Forest Resources Assessment,
Слайд 11The World's Forest Coverage
Source: Global Forest Resources Assessment, by Food and
Слайд 12Annual Change in Forest Area by Region, 1990-2010
Source: Global Forest Resources
Слайд 13Annual Change in Forest Area by Country, 2005- 2010
Source: Global Forest
Слайд 15Annual REDD Economic Mitigation Potential, 2030
Source: IPCC Fourth Assessment Report: Climate
Reducing emission from deforestation and forest degradation
Слайд 16Potential for Carbon Emissions Reduction in Forested Lands
Source: Metz et al.
Слайд 17Global Greenhouse Gas Emissions from Agriculture
Source: World Resource Institute (WRI), accessed
Org. fertilizer
кишечный
Слайд 18Agricultural Greenhouse Gas Emissions by Region Projected to 2020: Developed Nations
GHG
Source: Smith et al. 2007, 6-28.
Note:; E Asia: developing countries of East Asia; Organization for Economic Co-operation and Development (OECD) Pac: OECD countries of the Pacific Region; C&E Eur: Central and Eastern Europe; FSU: Former Soviet Union; W Eur: Western Europe; OECD NA, OECD countries of North America
Organization for Economic Co-operation and Development.
Слайд 19Agricultural Greenhouse Gas Emissions by Region, Projected to 2020: Developing Nations
GHG
Source: Smith et al. 2007, 6-28.
Note: ME&NA: Middle East and North Africa; SS Africa: Sub-Saharan Africa; S. Asia: developing countries of South Asia; LA&C: Latin America and The Caribbean; E Asia: developing countries of East Asia; OECD Pac: OECD countries of the Pacific Region; C&E Eur: Central and Eastern Europe; FSU: Former Soviet Union; W Eur: Western Europe; OECD NA, OECD countries of North America
