- Главная
- Разное
- Дизайн
- Бизнес и предпринимательство
- Аналитика
- Образование
- Развлечения
- Красота и здоровье
- Финансы
- Государство
- Путешествия
- Спорт
- Недвижимость
- Армия
- Графика
- Культурология
- Еда и кулинария
- Лингвистика
- Английский язык
- Астрономия
- Алгебра
- Биология
- География
- Детские презентации
- Информатика
- История
- Литература
- Маркетинг
- Математика
- Медицина
- Менеджмент
- Музыка
- МХК
- Немецкий язык
- ОБЖ
- Обществознание
- Окружающий мир
- Педагогика
- Русский язык
- Технология
- Физика
- Философия
- Химия
- Шаблоны, картинки для презентаций
- Экология
- Экономика
- Юриспруденция
Classification of Analytical Methods презентация
Содержание
- 1. Classification of Analytical Methods
- 2. Internal and interdisciplinary interfaces in the realm of Chemistry
- 3. Analytical Chemistry Internal interfaces with other chemical
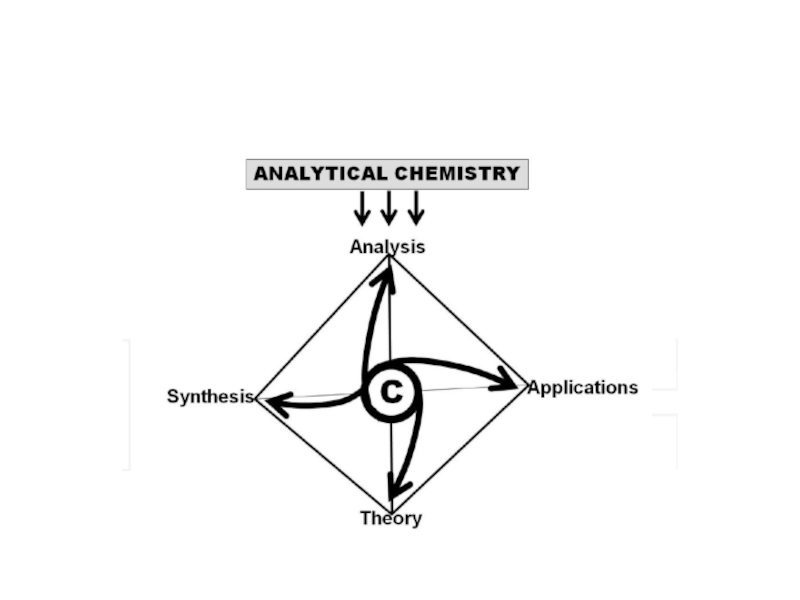
- 4. Analytical Chemistry the discipline in charge of
- 6. Definitions: “Analytical Chemistry is a scientific discipline
- 7. Analytical Chemistry has two essential aims.
- 8. Quality indicators Top or capital analytical properties
- 9. Classification of techniques by the type
- 10. Basic Equipment and Instrumentation Photo of a typical electronic balance. beaker graduated cylinder
- 11. Basic Equipment and Instrumentation volumetric flask dropping
- 12. Classical Methods: Separation of analytes by
- 13. Titrimetric Analysis The term titrimetric analysis refers
- 14. For use in titrimetric analysis a reaction
- 15. Definition of some terms Titration is the
- 16. Indicators Indicators are often added to
- 17. Titrimetric curve
- 18. Classification of reaction in titrimetric analysis
- 19. Instrumental Methods: Measurements of physical properties
- 20. The advantages of instrumental methods over classical
- 21. Instrumental analysis can be further classified according
- 22. Lists the names of instrumental methods that are based upon various analytical signals.
- 23. Electrochemical methods of analysis in which the
- 24. Spectrochemical methods of analysis in which the
- 25. The technique of mass spectroscopy in which
- 26. Single-Channel vs Multi-Channel Techniques single-channel techniques will
- 27. Multi-channel methods have two important advantages over
- 28. Relative vs Absolute Techniques Another way
- 29. The difference between absolute and relative techniques
- 30. Characterization of analytical techniques
- 31. Calibration Curve Method For any instrumental
- 32. Typical calibration curve The instrument response is
- 33. The following points should be made about
- 34. Electroanalytical methods Electroanalytical methods are a class
- 35. Potentiometry Potentiometry passively measures the potential of


Слайд 3Analytical Chemistry
Internal interfaces with other chemical areas (e.g. organic, inorganic, physical
External interfaces with other scientific and technical disciplines such as biology, biochemistry, mathematics, physics or engineering, where Analytical Chemistry can play an active role (e.g. in the determination of enzyme activities or that of drugs of abuse in biological fluids) or a passive one (e.g. in chemometric developments for data processing or the use of immobilized enzymes in analytical processes).

Слайд 4Analytical Chemistry
the discipline in charge of “Analysis” (the fourth component of
the discipline in charge of the production of so named “(bio)chemical information” or “analytical information”; the discipline of (bio)chemical measurements; and the chemical metrological discipline, which is related to the previous definition.

Слайд 6Definitions:
“Analytical Chemistry is a scientific discipline that develops and applies methods,
“Analytical Chemistry is a metrological discipline that develops, optimizes and applies measurement processes intended to produce quality (bio)chemical information of global and partial type from natural and artificial objects and systems in order to solve analytical problems derived from information needs”.

Слайд 7Analytical Chemistry has two essential aims.
the obtainment of as high
solving analytical problems derived from (bio)chemical information needs posed by “clients” engaged in a great variety of activities (health, general and agrifood industries, the environment).

Слайд 8Quality indicators
Top or capital analytical properties
Accuracy
Reliability
Representativeness
Basic analytical
Precision
Sensitivity
Selectivity
Productivity-related properties
Expeditiousness
Cost-effectiveness
Personnel-related factors

Слайд 9Classification of techniques
by the type of analytical technique – classical
by the nature of the measurement data generated – single-channel or multi-channel techniques;
by the quantitation method (by which the analyte concentration is calculated) – relative or absolute techniques.

Слайд 10Basic Equipment and Instrumentation
Photo of a typical electronic balance.
beaker
graduated cylinder

Слайд 11Basic Equipment and Instrumentation
volumetric flask
dropping pipet
Proper means of reading the meniscus
volumetric flask or pipet.

Слайд 12Classical Methods:
Separation of analytes by precipitation, extraction, or distillation.
Qualitative analysis by
Quantitative analysis by gravimetric or by titrimetric techniques.
In the early years of chemistry, most analyses were carried out by separating components of interest in a sample by precipitation, extraction, or distillation. For quantitative analyses, the separated components were then treated with reagents that yielded products that could be recognized by their colors, boiling points or melting points, their solubility in a series of solvents, their odors, their optical activities, or their refractive indexes. For quantitative analyses, the amount of analyte was determined by gravimetric or by titrimetric measurement.
Gravimetric Methods – the mass of the analyte or some compound produced from the analyte was determined.
Titrimetric Methods – the volume or mass of a standard reagent required to react completely with the analyte was measured.

Слайд 13Titrimetric Analysis
The term titrimetric analysis refers to quantitative chemical analysis carried

Слайд 14For use in titrimetric analysis a reaction must have the following
1- There must be a simple reaction which can be expressed by a chemical equation; the substance to be determined should react completely with the reagent instoichiometric or equivalent properties.
2- The reaction should be relatively fast. (Most ionic reaction satisfy this condition.) In some cases the addition of a catalyst may be necessary to increase the speed of areaction.
3- There must be an alteration in some physical or chemical property of the solution at the equivalence point.
4- An indicator should be available which, by a change in physical properties (color or formation of a precipitate), should sharply define the end point of the reaction.

Слайд 15Definition of some terms
Titration is the process in which the standard
Equivalence point and End point - The equivalence point of a titration is a theoretical point that can not be determine experimentally. Instead, we can only estimate its position by observing some physical change associated with the condition of equivalence. This change is called the end point for titration.
Titration error - The difference between the observed end point and the true equivalence point in a titration.

Слайд 16Indicators
Indicators are often added to analyte solution in order to give


Слайд 18Classification of reaction in titrimetric analysis
Neutralization reaction, or acidimetry and alkalimetry.
2. Precipitation reaction.
These depend upon the combination of ions to form asimple precipitate as in the titration of silver ion with solution of chloride. No changein oxidation state occurs.
3. Complex formation reaction.
These depend upon the combination of ions, other than hydrogen or hydroxide ion, to form a soluble slightly dissociated ion or compound, as in the titration of a solution af a cyanide with silver nitrate.Ethylendiaminetera-acetic acid, largely as the disodium salt of EDTA, is a veryimportant reagent for complex formation titration and has become on of the mostimportant reagents used in titrimetric analysis.
4. Oxidation-reduction reaction.
Under this heading are included all reactionsinvolving change in oxidation number or transfer of electrons among the reactivesubstance. The standard solutions are either oxidizing or reducing agents.

Слайд 19Instrumental Methods:
Measurements of physical properties of analytes, such as
conductivity,
electrode
light absorption,
or emission, mass to charge ratio,
and fluorescence,
began to be used for quantitative analysis of a variety of inorganic, organic, and biochemical analyte. Highly efficient chromatographic and electrophoretic techniques began to replace distillation, extraction, and precipitation for the separation of components of complex mixtures prior to their qualitative or quantitative determination. These newer methods for separating and determining chemical species are known collectively as instrumental methods of analysis.

Слайд 20The advantages of instrumental methods over classical methods include:
1. The ability
2. Generally, large numbers of samples may be analyzed very quickly.
3. Many instrumental methods can be automated.
4. Most instrumental methods are multi-channel techniques (we will discuss these shortly).
5. Less skill and training is usually required to perform instrumental analysis than classicalanalysis.

Слайд 21Instrumental analysis can be further classified according to the principles by
Electrochemical methods of analysis
Spectrochemical methods of analysis
mass spectroscopy
chromatography and electrophoresis.
electrogravimetry, and potentiostatic amperostatic coulometry


Слайд 23Electrochemical methods of analysis
in which the analyte participates in a redox
In potentiometric analysis, the analyte is part of a galvanic cell, which generates a voltage due to a drive to thermodynamic equilibrium. The magnitude of the voltage generated by the galvanic cell depends on the concentration of analyte in the sample solution.
In voltammetric analysis, the analyte is part of an electrolytic cell. Current flows when voltage is applied to the cell due to the participation of the analyte in a redox reaction; the conditions of the electrolytic cell are such that the magnitude of the current is directly proportional to the concentration of analyte in the sample solution.

Слайд 24Spectrochemical methods of analysis
in which the analyte interacts with electromagnetic radiation.
The rest of the methods are generally based on the measurement of light emitted or scattered by a sample; these emission-based techniques include atomic emission, molecular fluorescence, and Raman scatter methods.

Слайд 25The technique of mass spectroscopy
in which the analyte is ionized and

Слайд 26Single-Channel vs Multi-Channel Techniques
single-channel techniques will generate but a single number
• multi-channel techniques will generate a series of numbers for a single analysis. Multi-channel techniques are characterized by the ability to obtain measurements while changing some independently controllable parameter. For example, in a molecular absorption method, an absorption spectrum may be generated, in which the absorbance of a sample is monitored as a function of the avelength of the light transmitted through the sample. Measurement of the sample thus produces a series of absorbance values.

Слайд 27Multi-channel methods have two important advantages over their single-channel counterparts:
1. They
2. Multi-channel methods can detect, and sometimes correct for, the presence of a number of types of interferences in the sample. If uncorrected, the presence of the interference will result in biased estimates of analyte concentration.

Слайд 28Relative vs Absolute Techniques
Another way of classifying analytical techniques is according
in absolute analytical techniques, the analyte concentration can be calculated directly from measurement of the sample. No additional measurements are required (other than ameasurement of sample mass or volume).
in relative analytical techniques, the measurement of the sample must be compared to measurements of additional samples that are prepared with the use of analyte standards (e.g.,solutions of known analyte

Слайд 29The difference between absolute and relative techniques is that the latter


Слайд 31Calibration Curve Method
For any instrumental method used for quantitative chemical analysis,
r = f(CA)
The calibration curve approach to quantitation is an attempt to estimate the nature of this functional relationship. A series of calibration standards are analyzed, and a “best-fit” line or curve is used to describe the relationship between the analyte concentration in the calibration standards and the measured signal. The following figure demonstrates the concept.

Слайд 32Typical calibration curve
The instrument response is measured for a series of
calibration
describes the functional relationship between signal and concentration. Note that the calibration
curve should never be extrapolated (i.e., never extended beyond the range of the calibration
measurements).

Слайд 33The following points should be made about this method of quantitation:
The
A linear relationship between signal and concentration is desirable, generally resulting in the best accuracy and precision using the fewest number of calibration standards.
Ideally, the analyte concentration should only be calculated by interpolation, not by extrapolation. In other words, the analyte concentration should be within the range of concentrations spanned by the calibration standards. If the analyte concentration in thesample is too great, then the sample may be diluted. If the analyte concentration is too small, then additional calibration standards can be prepared. For best precision, the concentration is close to the mean concentration of the calibration standards.

Слайд 34Electroanalytical methods
Electroanalytical methods are a class of techniques in analytical chemistry

Слайд 35Potentiometry
Potentiometry passively measures the potential of a solution between two electrodes,