Jarvis, CCAFS
- Главная
- Разное
- Дизайн
- Бизнес и предпринимательство
- Аналитика
- Образование
- Развлечения
- Красота и здоровье
- Финансы
- Государство
- Путешествия
- Спорт
- Недвижимость
- Армия
- Графика
- Культурология
- Еда и кулинария
- Лингвистика
- Английский язык
- Астрономия
- Алгебра
- Биология
- География
- Детские презентации
- Информатика
- История
- Литература
- Маркетинг
- Математика
- Медицина
- Менеджмент
- Музыка
- МХК
- Немецкий язык
- ОБЖ
- Обществознание
- Окружающий мир
- Педагогика
- Русский язык
- Технология
- Физика
- Философия
- Химия
- Шаблоны, картинки для презентаций
- Экология
- Экономика
- Юриспруденция
Rising to the challenge of establishing a climate smart agriculture презентация
Содержание
- 2. 2013 1. What is Climate Smart Agriculture?
- 3. 2013 Why is CSA important? - Adaptation Global wheat and maize yields: response to warming
- 4. 2013 Why is CSA important? – Food
- 5. 2013 Why is CSA important? - Mitigation
- 6. 2013 Why is CSA important? - Mitigation
- 7. 2013 2. There are significant successes in CSA
- 8. CSA options involve farms, landscapes,
- 9. CSA options for landscapes landscape Ensure
- 10. Example: Sustainable land management in Ethiopia Photos:
- 11. CHINA Paying for ecosystem
- 12. CSA options for crops & fields crops
- 13. AFRICA Drought-tolerant maize boosts food security
- 14. Sequestration of carbon in soil and trees
- 15. CSA options for livestock livestock High-quality diets
- 16. Example: Forest land use and cattle management
- 17. CSA options for fisheries & aquaculture
- 18. CSA options for food systems
- 19. Example: “Love Food Hate Waste” in United
- 20. CSA options for services services
- 21. 12 million farmers & 40 different crops
- 22. Example: Seasonal weather forecasts in Senegal 3
- 23. 2. But major scaling up is needed
- 24. 1.5 billion people depend on Degraded Land
- 25. Target: Half a billion farmers practicing CSA
- 26. Are these targets insurmountable? “63 million customers
- 27. Requires a comprehensive approach Partnerships: research and
- 28. Capacity Building Gender Open
- 29. Alternate-Wetting-and-Drying (AWD) 30% water
- 30. Addressing constraints From national level… to implementation
- 31. Coffee-banana intercropping $ ha yr $ ha
- 32. Fuente: Rincón, 2013 Animal live weight gain
- 33. What if… - we spread
- 34. What if… - we spread
- 35. Cereal production Kahrl et al. 2010 World
- 36. Partnerships for Scaling Climate-smart Agriculture (P4S)
- 37. CSA Alliance Finance working group Policy working
- 38. Research in Development
- 39. CSA Country Profiles Baseline assessment of current
- 40. Scalable climate smart technologies….
- 41. A MAC curve for CSA adaptation
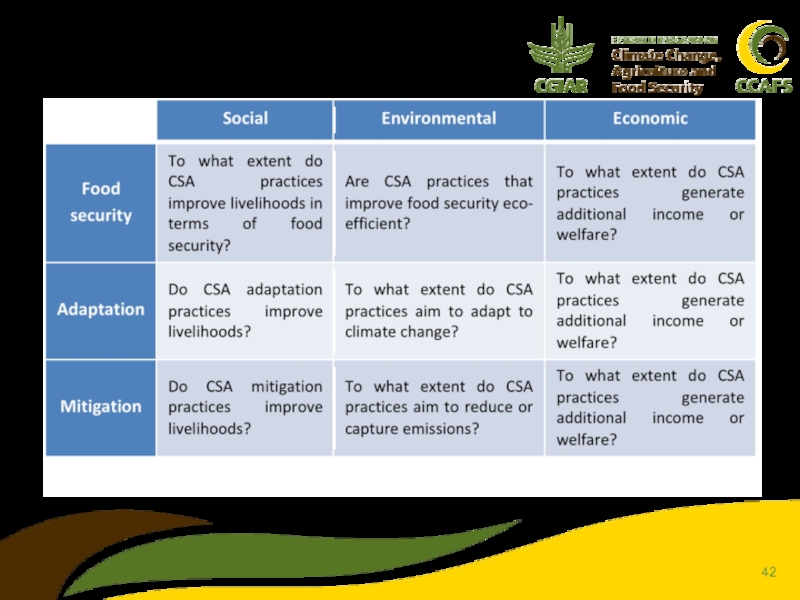
- 43. Some “simple” indicators to start with..
- 44. Quantitative assessment of Farm-level CSA evidence (Meta-analysis) ICRAF, CIAT 1Includes a range of practices
- 45. Crowdsourcing evidence for CSA and climate resilient practice
- 46. CSA Compendium Informs CSA prioritization tool Overcome
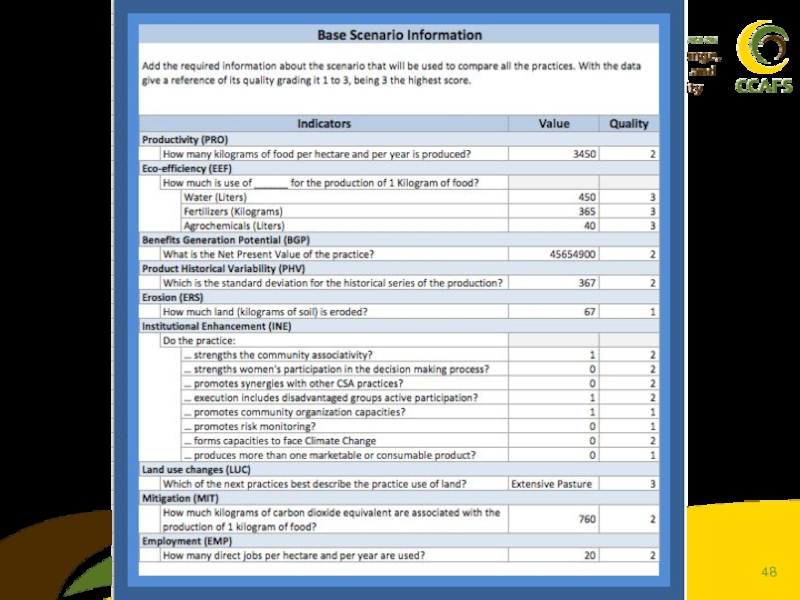
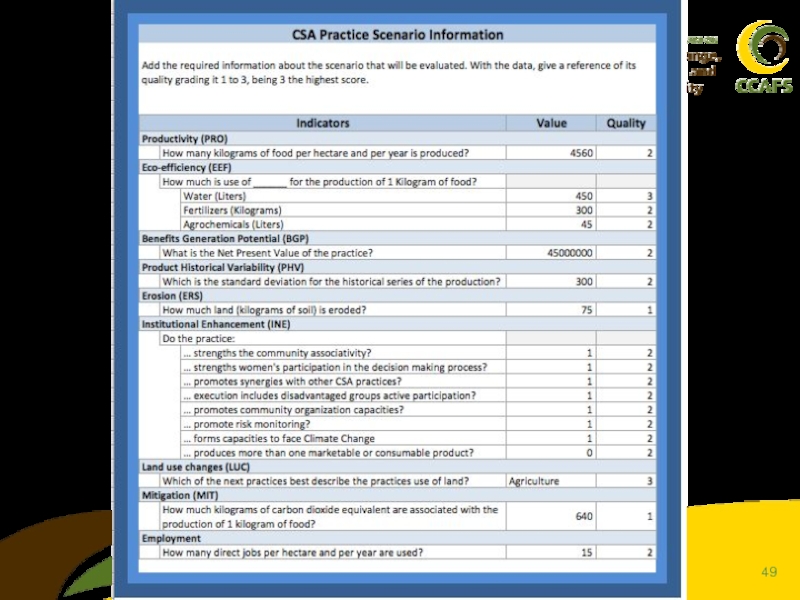
- 47. CSA Prioritization Tool - Process Assess tradeoffs
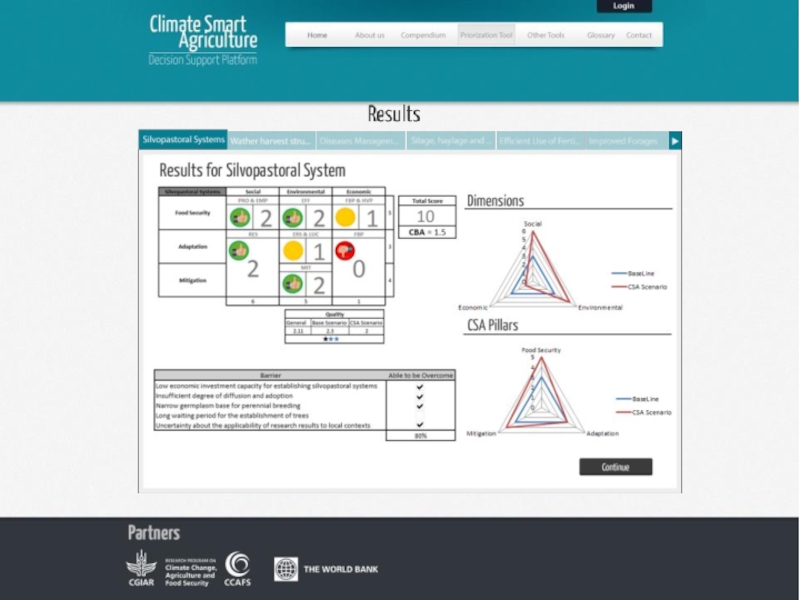
- 51. Ranked List of Practices
- 52. Leb by Climate smart villages: Key agricultural activities for managing risks
- 53. Strong national engagement
- 54. www.aclimatecolombia.org
- 55. What defines yield? 51% of yield variation is caused by climate for rice
- 56. PROBABILISTIC PRECIPITATION FORECAST
- 57. Matching technologies with climate in space and time
- 58. Big opportunities for reducing water dependency
- 59. Pulling the pieces
- 60. Global learning
- 62. Challenge immense, but not insurmountable CSA requires
- 63. www.ccafs.cgiar.org sign up for science, policy and news e-bulletins Twitter: @cgiarclimate


Слайд 42013
Why is CSA important? – Food Security
Climate drives yield variation: our
systems are sensitive to climate, not resilient to it

Слайд 52013
Why is CSA important? - Mitigation
Agriculture-related activities are 19-29% of global
greenhouse gas emissions (2010)
Agriculture production (e.g., fertilizers, rice, livestock, energy)
Land-use change and forestry including drained peatlands
Industrial processes
Waste
Percent, 100% = 50 gigatonnes CO2e per year
Non-Ag Energy
70
11
4
2
Agriculture")
Слайд 62013
Why is CSA important? - Mitigation
“Business as usual” (BAU) agriculture emissions
would comprise >70% of allowable emissions to achieve a 2°C world
Gt CO2e per year
Non-agricultural emissions
Agricultural and land-use change emissions
>70%
48
85
21
 agriculture emissions would comprise >70% of")

Слайд 8
CSA options involve farms, landscapes, food systems and services
landscape
crops
livestock
fish
food system
services
Photo: N.
Palmer, CIAT

Слайд 9
CSA options for landscapes
landscape
Ensure close links between practice and policy (e.g.
land use zoning)
Manage livestock & wildlife over wide areas
Increase cover of trees and perennials
Restore degraded wetlands, peatlands, grasslands and watersheds
Create diversity of land uses
Harvest floods & manage groundwater
Address coastal salinity &
sea surges
Protect against large-scale erosion
Manage livestock")
Слайд 10Example: Sustainable land management in Ethiopia
Photos: W. Bewket, AAU
190,000 ha rehabilitated
98,000
households benefit
Cut-and-carry feed for livestock
380,000 m3 waterways
900,000 m3 compost
Cut-and-carry feed for livestock
380,000 m3 waterways
900,000 m3 compost

Слайд 11 CHINA
Paying for ecosystem services
2.5 million farmers paid to
set aside land and plant trees
Sequestered over 700,000 tonnes of carbon
2 million ha rehabilitated – reducing erosion
Increased yields

Слайд 12CSA options for crops & fields
crops
Crop diversification and “climate-ready” species and
cultivars
Altering cropping patterns & planting dates
Better soil and nutrient management e.g. erosion control and micro-dosing
Improved water use efficiency (irrigation systems, water micro-harvesting)
Monitoring & managing new trends in pests and diseases
Agroforestry, intercropping & on-farm biodiversity

Слайд 13 AFRICA
Drought-tolerant maize boosts food security
DTMA has developed 100 new varieties
released across 13 countries; 2 million smallholders
Reduces need to use more land
Resilience to drought
Yields up to 35% more grain

Слайд 14Sequestration of carbon in soil and trees
NIGER
Bringing back the Sahel’s
‘underground forest’
5 million ha of land restored, over 200 million trees re-established
Reduces drought impacts
Additional half a million tonnes of grain per year

Слайд 15CSA options for livestock
livestock
High-quality diets that increase conversion efficiency and reduce
emissions
Herd management e.g. sale or slaughter at different ages
Changing patterns of pastoralism and use of water points
Livestock diversification and “climate-ready” species and breeds
Improved pasture management
Use of human food waste for pigs & chickens

Слайд 16Example: Forest land use and cattle management in Brazil
Photo: N. Palmer,
CIAT
45% higher stocking density
no increase in pasture area
better pasture quality
40% reduction in emissions
agriculture decoupled from deforestation

Слайд 17CSA options for fisheries
& aquaculture
fish
Better physical defences against sea surges
Quota
schemes matched to monitoring of fish stocks
Greater energy efficiency in harvesting
Rehabilitation of mangroves & breeding grounds
Less dependence of aquaculture on marine fish feed
Reducing losses and wastage

Слайд 18
CSA options for food systems
food system
More creative and efficient use
of by-products
Less energy-intensity in fertilizer production
Improving resilience of infrastructure for storage & transport (e.g. roads, ports)
Changing diets
Greater attention to food safety
Reducing post-harvest losses & consumer wastage

Слайд 19Example: “Love Food Hate Waste”
in United Kingdom
13 % less household food
waste
consumers saving $4 billion
national water footprint down 4%
3.6 million tonnes CO2eq less per year
consumers saving $4 billion
national water footprint down 4%
3.6 million tonnes CO2eq less per year

Слайд 20
CSA options for services
services
Monitoring & data for food security, climate &
ecosystems
Early warning systems & weather forecasts
Mobile phone, radio & other extension or information for farmers
Research that links farmers & science
Weather insurance & micro-finance
Financial transfers & other “safety nets” for climate shocks

Слайд 2112 million farmers & 40 different crops insured
INDIA
Weather-based insurance
Reduces pressure to bring more land under cultivation
Reduces risks
Allows farmers to access fertilizer and better seed

Слайд 22Example: Seasonal weather forecasts in Senegal
3 million farmers get forecasts
70 community
radio stations
better food security outcomes
better food security outcomes


Слайд 241.5 billion people depend on Degraded Land
USD 7.5 billion lost
to extreme Weather (2010)
1 billion more People by 2030
1.4 billion living in Poverty
14% more Food needed per decade
Nearly 1 billion going Hungry
1")
Слайд 25Target: Half a billion farmers practicing CSA
Mitigation targets?
Scholes et al., 2013.
Agriculture and Climate Change Mitigation in the Developing World
DC Targets (2035)
22% reduction in agricultural emissions relative to the ‘business as usual’ baseline
46% reduction in forestry and land use change, relative to a projection of current trends
Target: Half a billion with enhanced adaptive capacity
So what are the targets?

Слайд 26Are these targets insurmountable?
“63 million customers per day, so 500 million
smallholders in the next decade is easy!”
Global Harvest Initiative 2013
FAOSTAT
World Bank/Standard Chartered
GSMA/Deloitte
Sub-Saharan Africa

Слайд 27Requires a comprehensive approach
Partnerships: research and development, science and policy, public
and private
Knowledge generation: practices/technologies, programmatic elements (insurance, climate information services)
Work on CSA enablers: (sub-)National policies, UNFCCC global process, donor agendas
Incentive mechanisms: innovative finance, private sector
Knowledge generation: practices/technologies, programmatic elements (insurance, climate information services)
Work on CSA enablers: (sub-)National policies, UNFCCC global process, donor agendas
Incentive mechanisms: innovative finance, private sector

Слайд 28
Capacity Building
Gender
Open Data
& Action
Learning
Research
Evidence of what works in CSA
Research Evidence
Climate
smart villages & broadscale adoption
CSA Roll Out
Key
Working with partners to collect the evidence and to change opinions and worldviews
Working with partners to understand what works
Working with partners to make it happen
Enhanced local adaptation planning processes
Policy & Institutional Change
Flagship 1: Climate –smart agricultural practices

Слайд 29
Alternate-Wetting-and-Drying
(AWD)
30% water
20-50% GHG
Without compromising yield
Keep flooded for 1st 15 days
and at flowering
Irrigate when water drops to 15 cm below the surface
Irrigate when water drops to 15 cm below the surface
-22%
-28%
6.0
4.7
6.4
4.6
Hilly mid-slopes
Delta low-lying
Summer-Autumn
Winter-Spring
Sander et al. in press IRRI
AWD
Conventional
30% water20-50% GHGWithout compromising yieldKeep flooded for 1st 15 days and at flowering Irrigate")
Слайд 30Addressing constraints
From national level…
to implementation at provincial level….
Slide by Bjoern Ole
Sander, IRRI

Слайд 31Coffee-banana intercropping
$ ha yr
$ ha yr
More carbon in the system
Diversification
Decreases drought
impacts
Increased income
Enhanced food security

Слайд 32Fuente: Rincón, 2013
Animal live weight gain
(kg/ha/year)
Crop-livestock integration to increase
animal live weight gain (kg/ha/year) in the acid soil savannas of Colombia
 Crop-livestock integration to increase animal live weight gain")
Слайд 33
What if…
- we spread agroforestry across Africa?
Most of the technologies
and practices that mitigate emissions also improve productivity and can contribute to food security and poverty alleviation.
PRODUCTIVITY
Higher incomes for farmers
Healthier animals
Biodiversity conservation due to reduced land pressure
RESILIENCE
Emission Reduction
Potential:
- 1.8 Gt CO2-eq/yr in 2010 (FAO)
- 3.3 Gt CO2-eq/yr in 2050
FOOTPRINT
-30%
Emissions (Gt CO2-eq/yr)
Remaining Gap to 2C Pathway:
3.1 Gt CO2-eq/yr
-30%
Using already wide-spread technologies currently available: Feeding practices, Animal husbandry, Health management
Result: Reduced unproductive share of animals in the herd, higher resource efficiency.
Livestock: Higher productivity ⇒ Lower Emission Intensity
Based on results of the GLEAM Model, FAO 2013, Extrapolations
BAU
With CSA
2C Pathway
Emissions (kg CO2-eq/kg Milk)
Milk Production per Cow
Example Dairy:
Below 2000 kg milk/cow/year, productivity increases correlate with very significant reductions in emissions intensity.
Analysis based on WRI 2013
Approximate area suitable for Agroforestry in Africa:
~ 300 Million Ha
140+ Million People below $1.25 per day

Слайд 34
What if…
- we spread agroforestry across Africa?
Most of the technologies
and practices that mitigate emissions also improve productivity and can contribute to food security and poverty alleviation.
PRODUCTIVITY
Higher incomes for farmers
Healthier animals
Biodiversity conservation due to reduced land pressure
RESILIENCE
Emission Reduction
Potential:
- 1.8 Gt CO2-eq/yr in 2010 (FAO)
- 3.3 Gt CO2-eq/yr in 2050
FOOTPRINT
-30%
Emissions (Gt CO2-eq/yr)
Remaining Gap to 2C Pathway:
3.1 Gt CO2-eq/yr
-30%
Using already wide-spread technologies currently available: Feeding practices, Animal husbandry, Health management
Result: Reduced unproductive share of animals in the herd, higher resource efficiency.
Livestock: Higher productivity ⇒ Lower Emission Intensity
Carbon sequestration potential (2t C/ha/yr.) above and below ground with low growth habit, low tree density and poor site quality, Nair et al. 2009
Underlying area 300 million ha, 285 million people, assumed increase in yields +50% (conservative), Analysis based on WRI 2013
BAU
With CSA
2C Pathway
Emissions (kg CO2-eq/kg Milk)
Milk Production per Cow
Example Dairy:
Below 2000 kg milk/cow/year, productivity increases correlate with very significant reductions in emissions intensity.
Approximation of area suitable for Agroforestry and Water Harvesting in Africa:
~ 300 Million Ha
PRODUCTIVITY
Multiple benefits include:
Reduced soil erosion
Additional diversified income from wood products
Strengthened draught resistance from increased water storage
RESILIENCE
FOOTPRINT
+615 Calories per person/day for 140+ Million poor people
Average yield
increase 50%
Savings of over
6 Million tons of synthetic fertilizer
Adoption on
150 Million Ha
Adoption on
300 Million Ha
+44 Million Tons
+88 Million Tons
Food Production
Carbon Sequestration
- 1 Gt of CO2e
per year
- 2 Gt of CO2e
per year
Adoption on
150 Million Ha
Adoption on
300 Million Ha
2 Gt Co2e storage per year corresponds to ~1/3 of Global Direct Ag Emissions
Significantly higher mitigation potential by further increasing tree density and in humid systems
Agroforestry can be combined with other practices such as water harvesting for additional impact.

Слайд 35Cereal production
Kahrl et al. 2010 World Agroforestry Centre
Back of envelope calculations
Nitrogen
use
kg N / ha
g N / t
? > US$ 1.5 billion saved
Emissions ↓ by 32-67 Mt CO2e yr-1
(20-41% of economic potential for N management)
If nitrogen use efficiency could be improved by 5 % points

")
Слайд 37CSA Alliance
Finance working group
Policy working group
Knowledge working group (FAO & CCAFS)
UN
SG Climate Summit in Sept
One element: CSA
One element: CSA
Separate, but related:
CSA Science Conference March 2015 France
UN SG Climate Summit in")

Слайд 39CSA Country Profiles
Baseline assessment of current status of CSA
WB priorities:
engage donors
and governments on CSA concept
identify entry points for research and investment
identify entry points for research and investment


Слайд 44Quantitative assessment of Farm-level CSA evidence
(Meta-analysis)
ICRAF, CIAT
1Includes a range of
practices
ICRAF, CIAT1Includes a range of practices")

Слайд 46CSA Compendium
Informs CSA prioritization tool
Overcome barrier of lack of information about
possible CSA options in a given context
Informs future research agendas
Identify gaps in the literature based on CSA pillar, CSA practice, geographic region, etc.
Knowledge Hub for CSA researchers and practitioners
Crowdsourcing to develop database, with reliability of data marked
Informs future research agendas
Identify gaps in the literature based on CSA pillar, CSA practice, geographic region, etc.
Knowledge Hub for CSA researchers and practitioners
Crowdsourcing to develop database, with reliability of data marked

Слайд 47CSA Prioritization Tool - Process
Assess tradeoffs
for each practice between indicators of
CSA pillars and social, economic, and environmental domains
between practices within a portfolio
between practices within a portfolio
Pilots will be conducted starting mid-2014 in Mali, Viet Nam, and Colombia


Слайд 56
PROBABILISTIC PRECIPITATION FORECAST
33
33
33
Above
Normal
Below
38
31
31
22
27
51
37
33
31
39
33
28
Agroclimatic Seasonal forecasting


Слайд 59
Pulling the pieces together
Climate resilience
Baseline
Adapted technologies
Adapted technologies
+
Climate-specific management
Adapted technologies
+
Climate-specific management
+
Seasonal agroclimatic
forecasts
Adapted technologies
+
Climate-specific management
+
Seasonal agroclimatic forecasts
+
Efficient resource use
+
Enabling environment NAPs and NAMAs
Climate smartness


Слайд 62Challenge immense, but not insurmountable
CSA requires a comprehensive approach. Line up:
Technical
Financial
Policy
Two
key factors for success:
Successfully building a business case for CSA
Addressing the constraints head on
Successfully building a business case for CSA
Addressing the constraints head on
In summary….