- Главная
- Разное
- Дизайн
- Бизнес и предпринимательство
- Аналитика
- Образование
- Развлечения
- Красота и здоровье
- Финансы
- Государство
- Путешествия
- Спорт
- Недвижимость
- Армия
- Графика
- Культурология
- Еда и кулинария
- Лингвистика
- Английский язык
- Астрономия
- Алгебра
- Биология
- География
- Детские презентации
- Информатика
- История
- Литература
- Маркетинг
- Математика
- Медицина
- Менеджмент
- Музыка
- МХК
- Немецкий язык
- ОБЖ
- Обществознание
- Окружающий мир
- Педагогика
- Русский язык
- Технология
- Физика
- Философия
- Химия
- Шаблоны, картинки для презентаций
- Экология
- Экономика
- Юриспруденция
Hierarchies in Systems Biology презентация
Содержание
- 1. Hierarchies in Systems Biology
- 2. Mark A. Knepper, MD, PhD
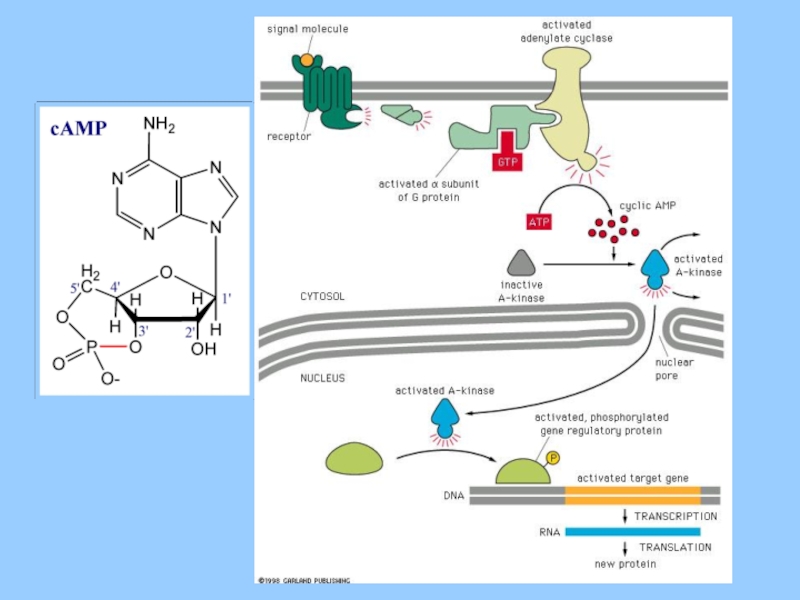
- 3. Reception of extracellular signal by cell Transduction
- 4. Transduction of signal from outside of cell
- 6. Correspondence: Dr. David Pearce, Division of Nephrology,
- 7. Three general categories of chemical signaling: Cytoplasmic
- 9. Природа биологических сигналов Chemical Signaling Between Cells
- 10. Высокая аффинность рецептора и лиганда , по-видимому,
- 11. Принципиальный момент: Передача сигнала происходит
- 12. Константа аффинности отражает энергию связи лиганд-рецептор.
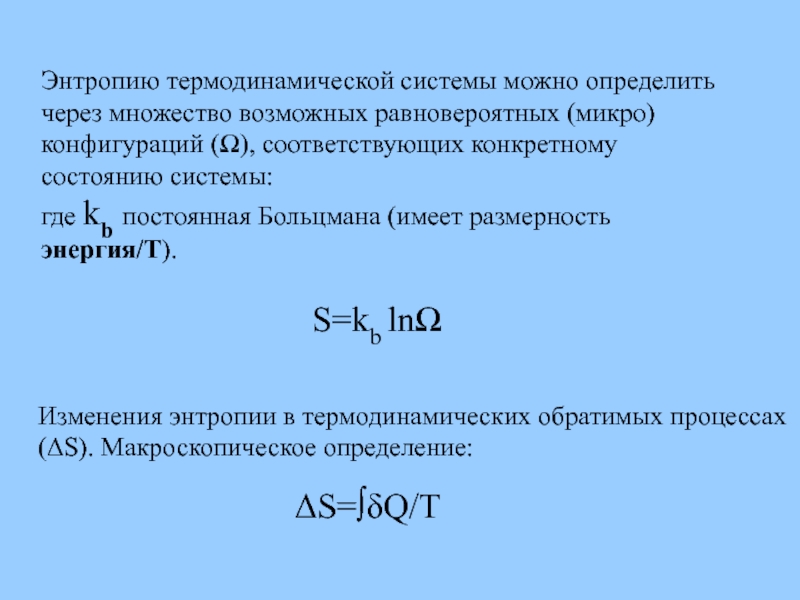
- 13. Энтропию термодинамической системы можно определить через множество
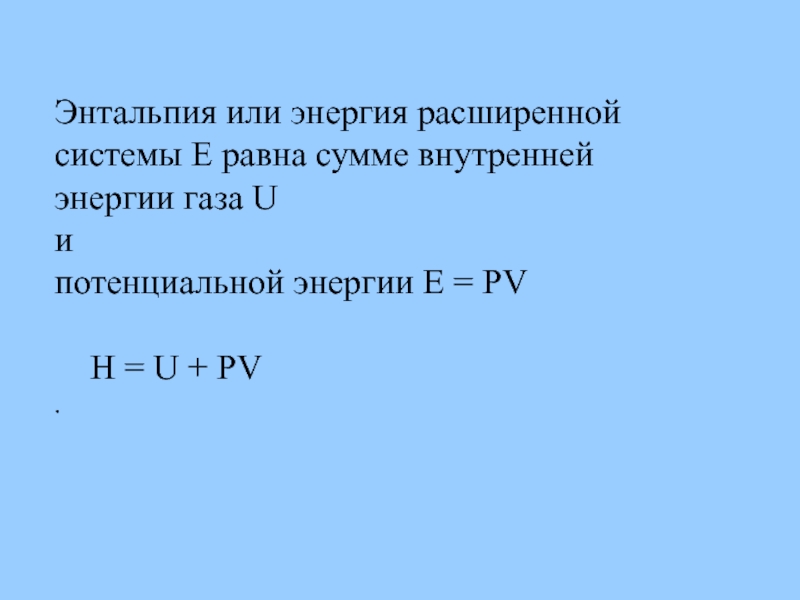
- 14. Энтальпия или энергия расширенной системы E равна
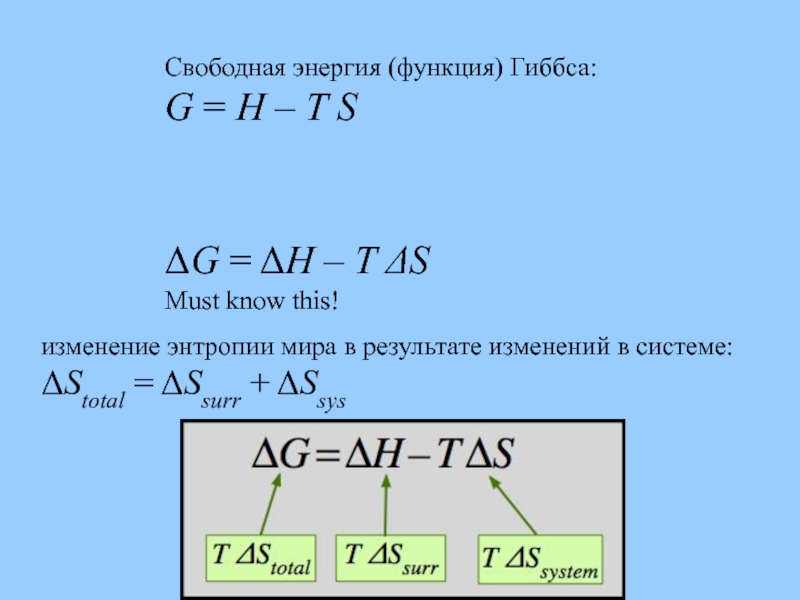
- 15. Свободная энергия (функция) Гиббса: G =
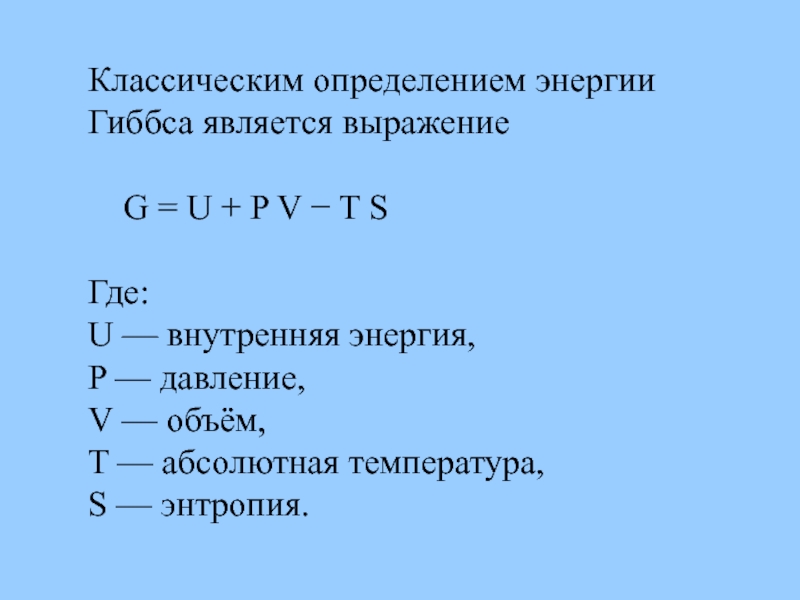
- 16. Классическим определением энергии Гиббса является выражение
- 17. The free energy enables us to do
- 18. Clark’s Theory Условия применимости классической модели взаимодействия лиганд-рецептор
- 19. 1 обратимость связывания 2 все рецепторы
- 20. signals that are released from one cell
- 21. Взаимодействие молекулы лиганда (l) со связывающей молекулой
- 22. Ka (B0 - [bl])
- 23. Размерность константы ассоциации – обратные моли
- 24. The equilibrium constant (association constant): Keq =
- 25. Multiple Independent Binding Sites ν = nY
- 26. Ингибитор снижает Кass [I] - inhibitor
- 27. Cooperative Binding · Positive cooperativity is observed
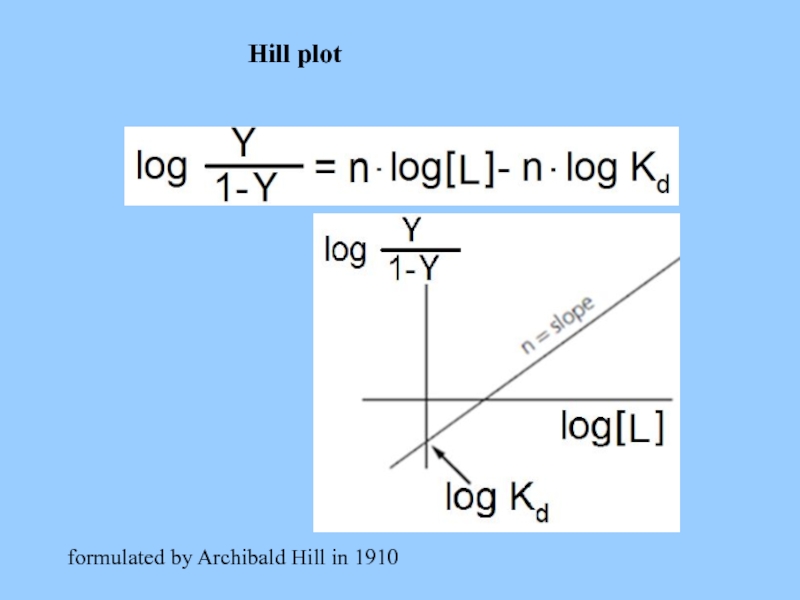
- 28. Hill plot formulated by Archibald Hill in 1910
- 30. Independent sites - microscopic and macroscopic binding
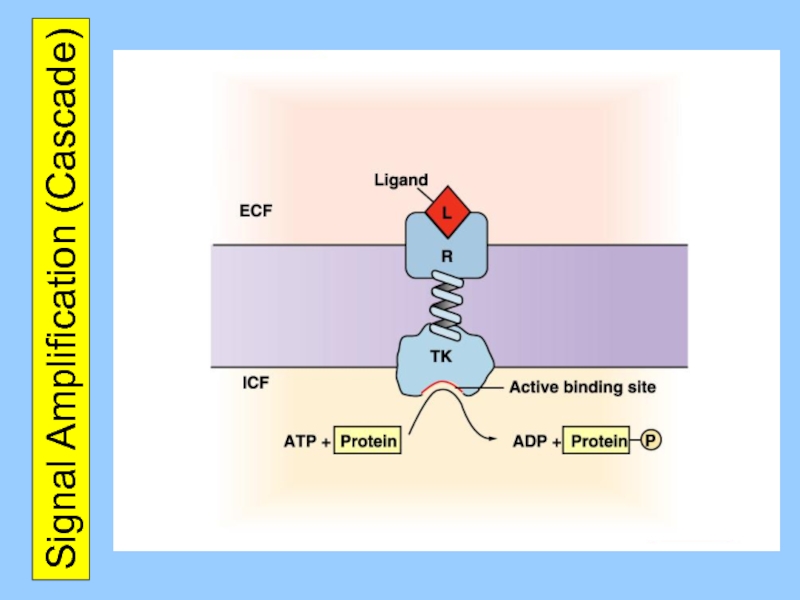
- 31. Signal Amplification (Cascade)
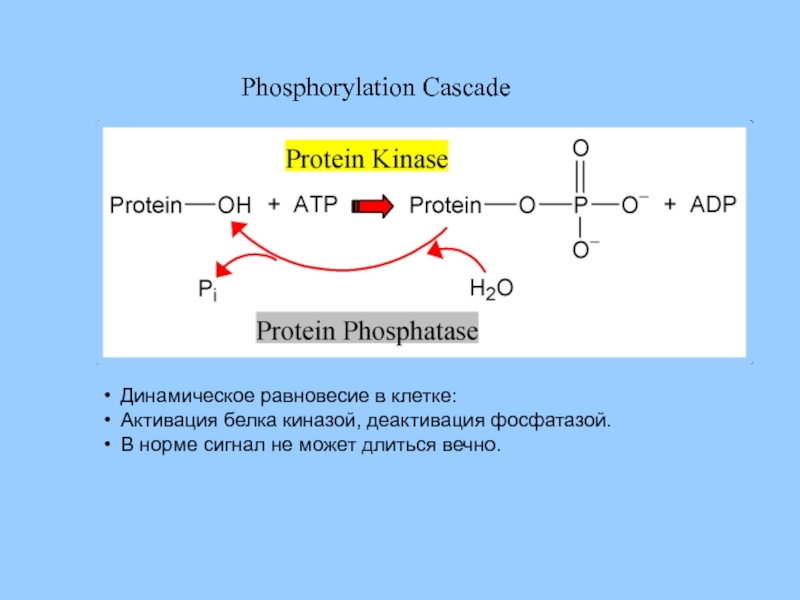
- 32. Динамическое равновесие в клетке: Активация белка киназой,
- 33. A simple model of enzyme action:
- 34. Скорость образования: [ES] = k1[E][S]. Скорость
- 35. Цель, определить [ES] через измеряемые величины.
- 37. Km = ([E]total - [ES]) [S]/[ES]
- 38. В условиях насыщения субстратом, когда [ES] =
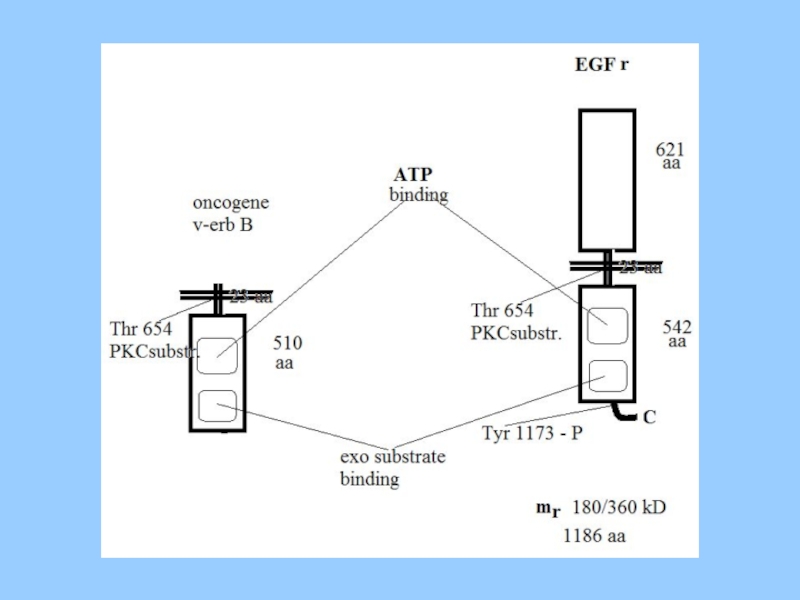
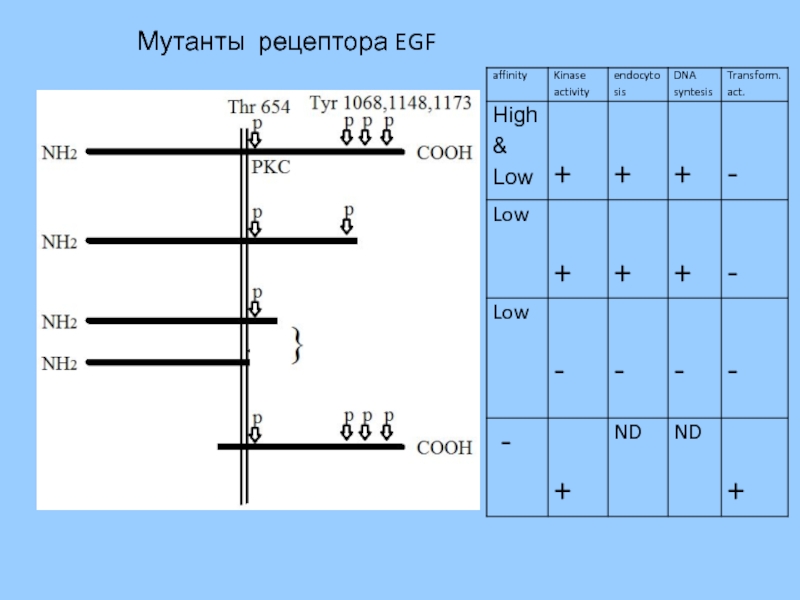
- 41. Мутанты рецептора EGF
- 42. About 70 to 80 percent breast precancers
- 43. One of the fascinating things that
- 45. Настоящий инженер немедленно начнет писать функцию с
- 46. Ингибитор снижает Кass [I] - inhibitor
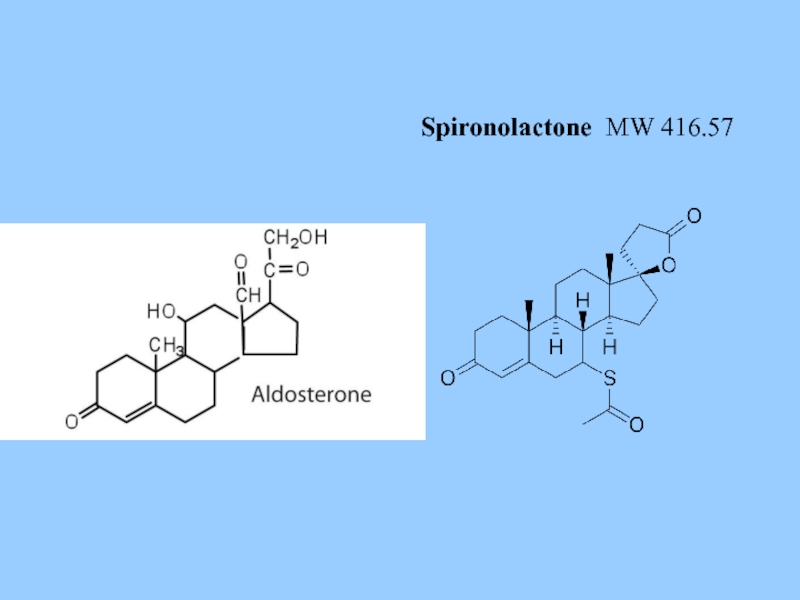
- 47. Spironolactone MW 416.57
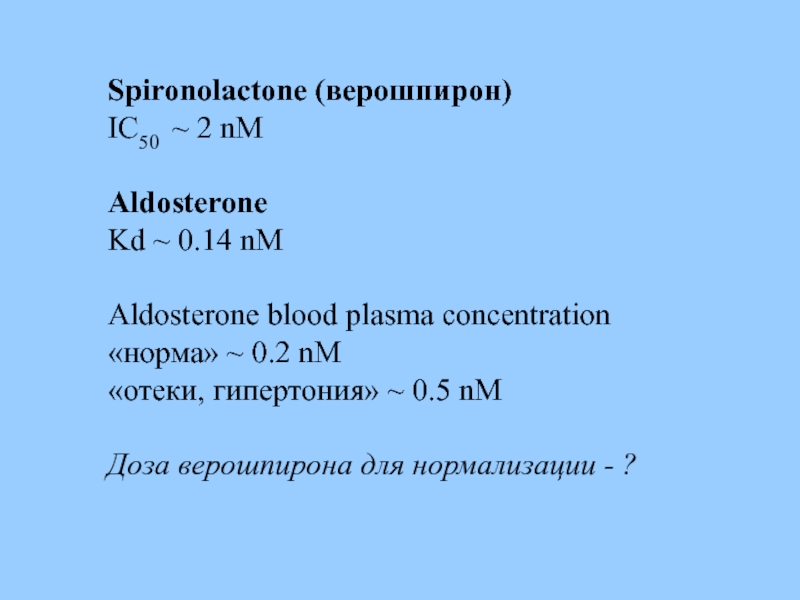
- 48. Spironolactone (верошпирон) IC50 ~ 2 nM
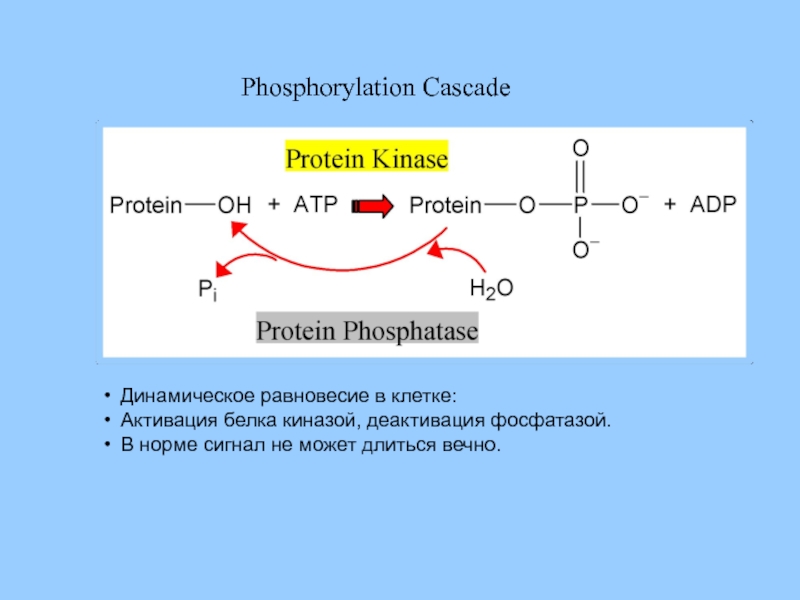
- 51. Динамическое равновесие в клетке: Активация белка киназой,
- 52. A simple model of enzyme action:
- 53. Скорость образования: [ES] = k1[E][S]. Скорость
- 54. Цель, определить [ES] через измеряемые величины.
- 56. Km = ([E]total - [ES]) [S]/[ES]
- 57. В условиях насыщения субстратом, когда [ES] =
- 64. Studies of water transport across cell plasma membrane. Schematic diagram of the experimental setup
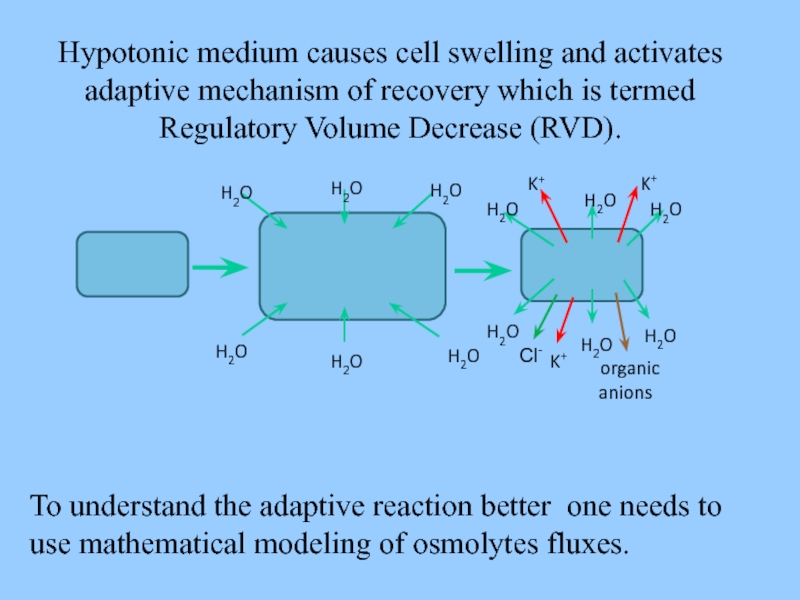
- 65. To understand the adaptive reaction better one
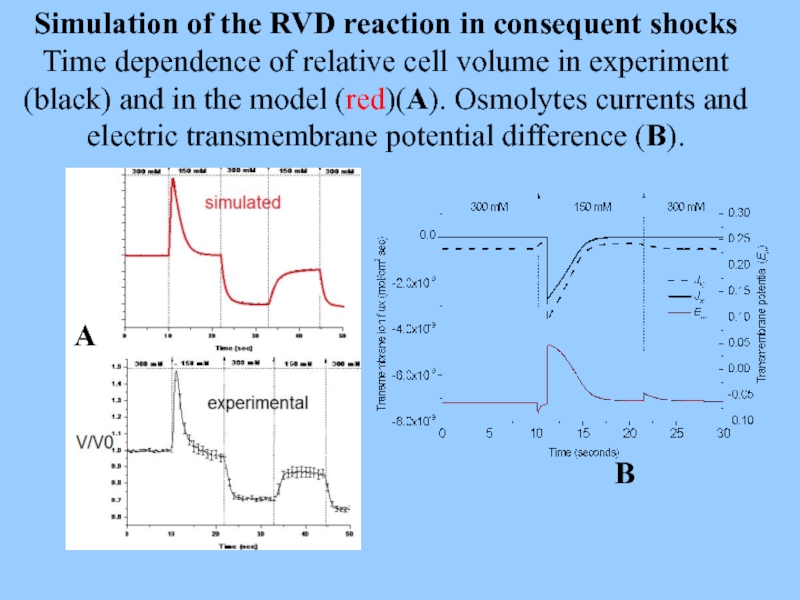
- 67. Simulation of the RVD reaction in consequent
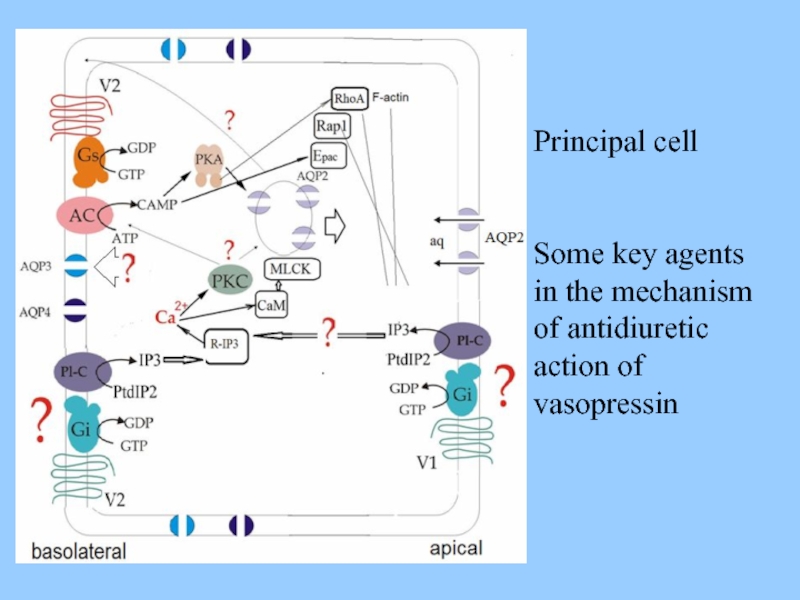
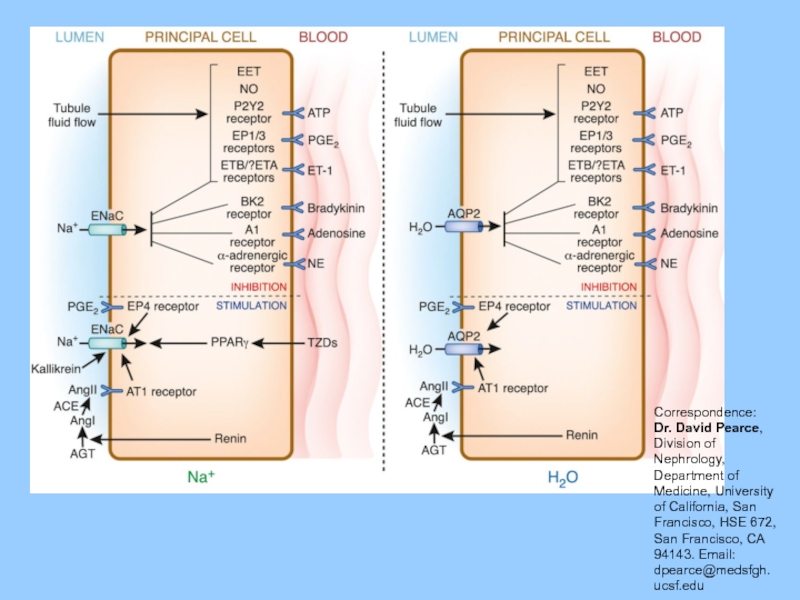
- 68. Principal cell Some key agents
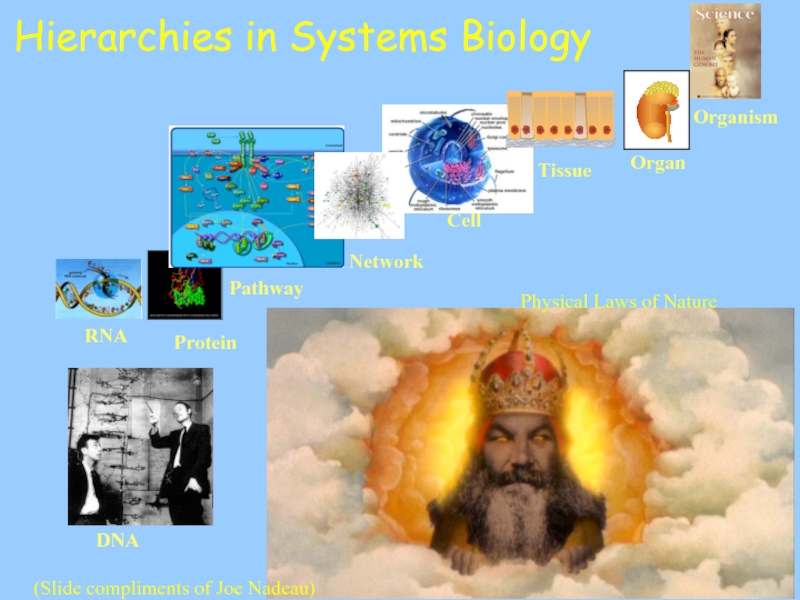
Слайд 1DNA
RNA
Protein
Pathway
Cell
Tissue
Network
Hierarchies in Systems Biology
(Slide compliments of Joe Nadeau)
Organism
Organ
Physical Laws of Nature
Слайд 2
Mark A. Knepper, MD, PhD
Laboratory of Kidney & Electrolyte Metabolism
National Heart,
NIH
Bethesda, Maryland, USA
Johns Hopkins, 2010
1. Data acquisition;
2. Data organization and integration;
3. Computation (mathematical modeling).
Systems biology involves
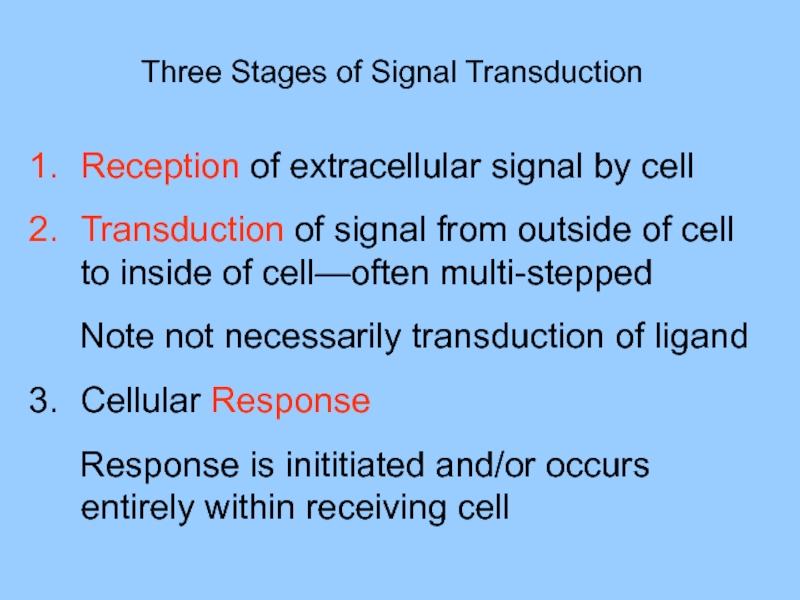
Слайд 3Reception of extracellular signal by cell
Transduction of signal from outside of
Note not necessarily transduction of ligand
Cellular Response
Response is inititiated and/or occurs entirely within receiving cell
Three Stages of Signal Transduction
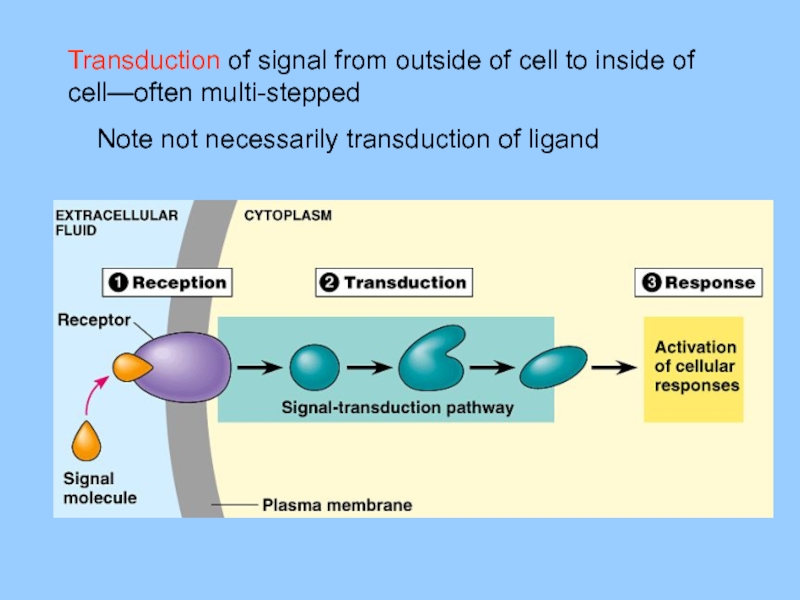
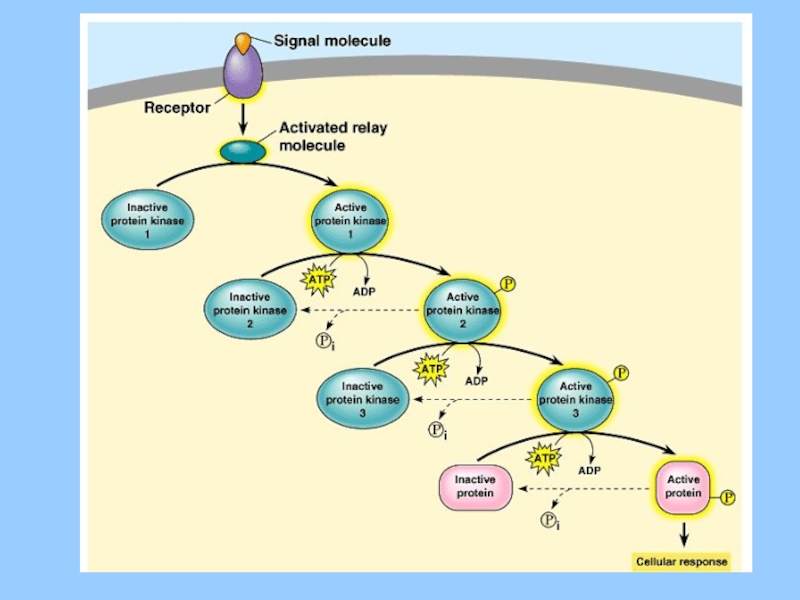
Слайд 4Transduction of signal from outside of cell to inside of cell—often
Note not necessarily transduction of ligand
Слайд 6Correspondence:
Dr. David Pearce,
Division of
Nephrology,
Department of
Medicine, University
of California, San
Francisco, HSE 672,
San Francisco,
94143. Email:
dpearce@medsfgh.
ucsf.edu
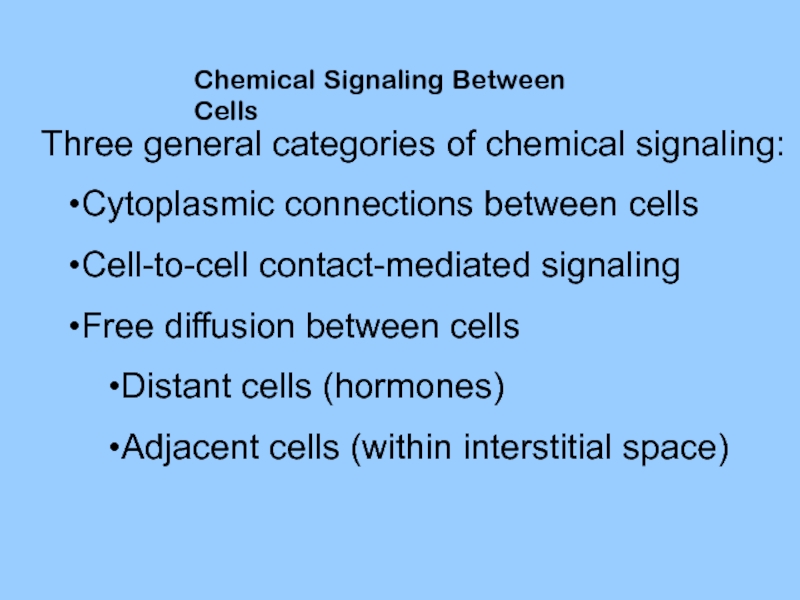
Слайд 7Three general categories of chemical signaling:
Cytoplasmic connections between cells
Cell-to-cell contact-mediated signaling
Free
Distant cells (hormones)
Adjacent cells (within interstitial space)
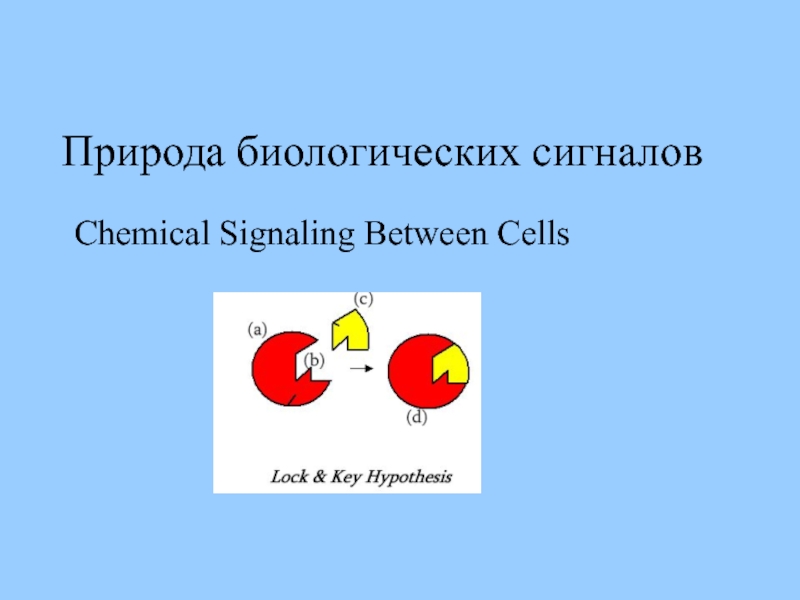
Chemical Signaling Between Cells
Слайд 10Высокая аффинность рецептора и лиганда , по-видимому, достигается за счет конгруэнтности
И.М. Мечниковым и П. Эрлихом. Существование таких специализированных доменов в молекулах рецепторов подтверждено современными исследованиями.
Слайд 11
Принципиальный момент:
Передача сигнала происходит в результате физического контакта лиганда с
All of latter involves the physical movement of Ligands.
That is, Ligand Reception by a Protein
Note that Reception means Molecule-to-Molecule Contact
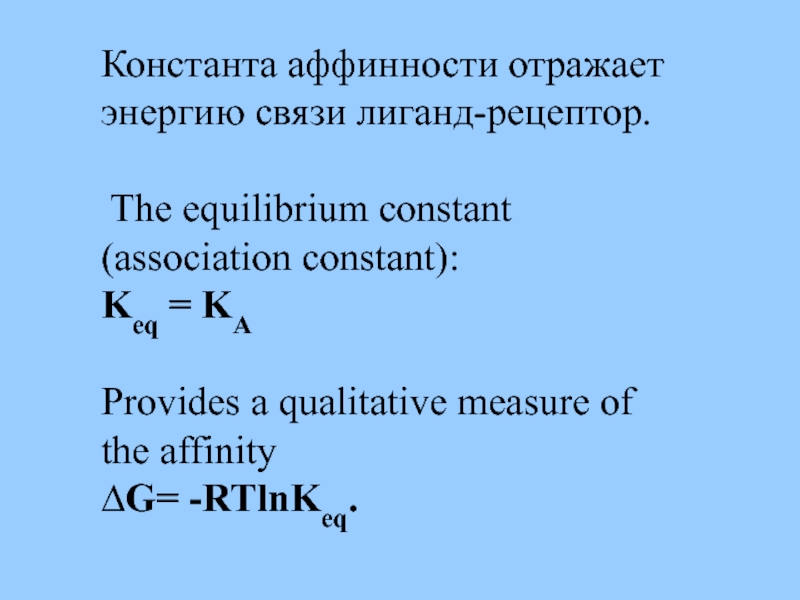
Слайд 12Константа аффинности отражает энергию связи лиганд-рецептор.
The equilibrium constant (association
Keq = KA
Provides a qualitative measure of the affinity
∆G= -RTlnKeq.
Слайд 13Энтропию термодинамической системы можно определить через множество возможных равновероятных (микро) конфигураций
где kb постоянная Больцмана (имеет размерность энергия/Т).
S=kb lnΩ
Изменения энтропии в термодинамических обратимых процессах (ΔS). Макроскопическое определение:
ΔS=∫δQ/T
Слайд 14Энтальпия или энергия расширенной системы E равна сумме внутренней энергии газа
и
потенциальной энергии E = PV
H = U + PV
.
Слайд 15Свободная энергия (функция) Гиббса:
G = H – T S
ΔG
Must know this!
изменение энтропии мира в результате изменений в системе:
ΔStotal = ΔSsurr + ΔSsys
Слайд 16Классическим определением энергии Гиббса является выражение
G = U +
Где:
U — внутренняя энергия,
P — давление,
V — объём,
T — абсолютная температура,
S — энтропия.
Слайд 17The free energy enables us to do changes that occur at
The Helmholtz free energy is of interest mainly to chemical engineers
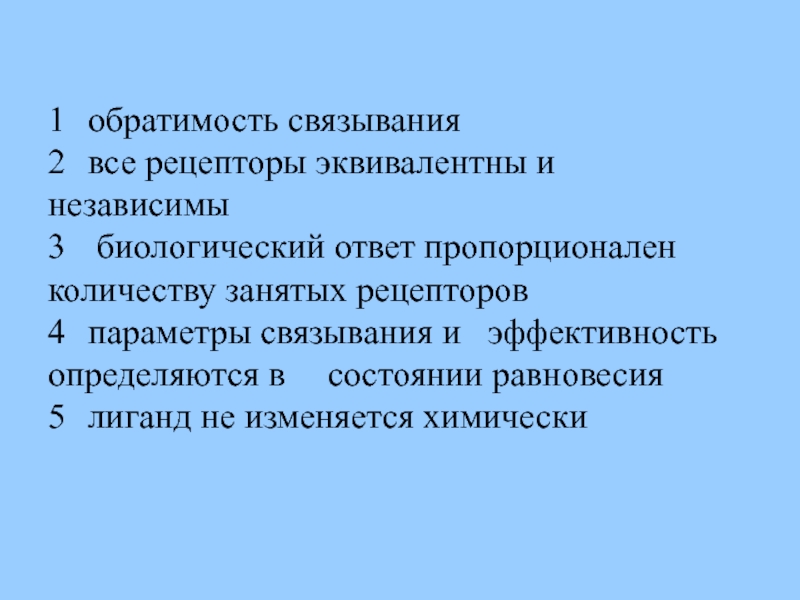
Слайд 191 обратимость связывания
2 все рецепторы эквивалентны и независимы
3 биологический
4 параметры связывания и эффективность определяются в состоянии равновесия
5 лиганд не изменяется химически
Слайд 20signals that are released from one cell and allowed to freely
We will consider in particular those events that follow the reception of chemical signals
We will not dwell on the purpose of the signal
Signal-Transduction Emphasis
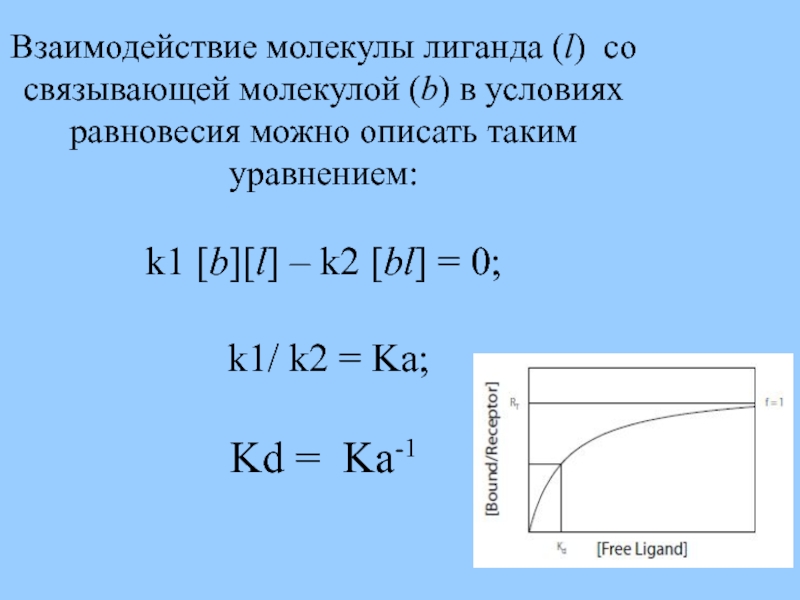
Слайд 21Взаимодействие молекулы лиганда (l) со связывающей молекулой (b) в условиях равновесия
k1 [b][l] – k2 [bl] = 0;
k1/ k2 = Ka;
Kd = Ka-1
Слайд 22
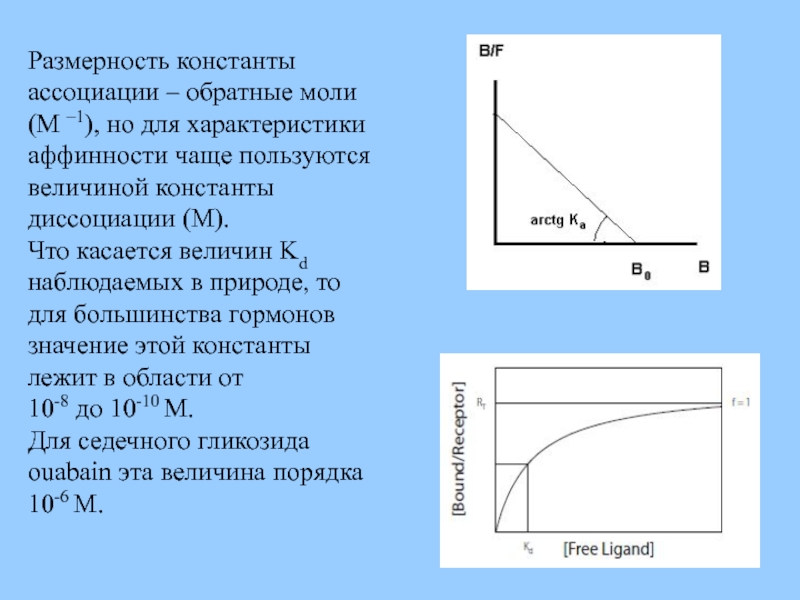
Ka (B0 - [bl]) = [bl]/ [l] ;
Если:
То: B/ F = Ka (B0 – B)
получаем уравнение Скетчарда
Слайд 23
Размерность константы ассоциации – обратные моли (M –1), но для характеристики
Что касается величин Kd наблюдаемых в природе, то для большинства гормонов значение этой константы лежит в области от
10-8 до 10-10 M.
Для седечного гликозида ouabain эта величина порядка 10-6 M.
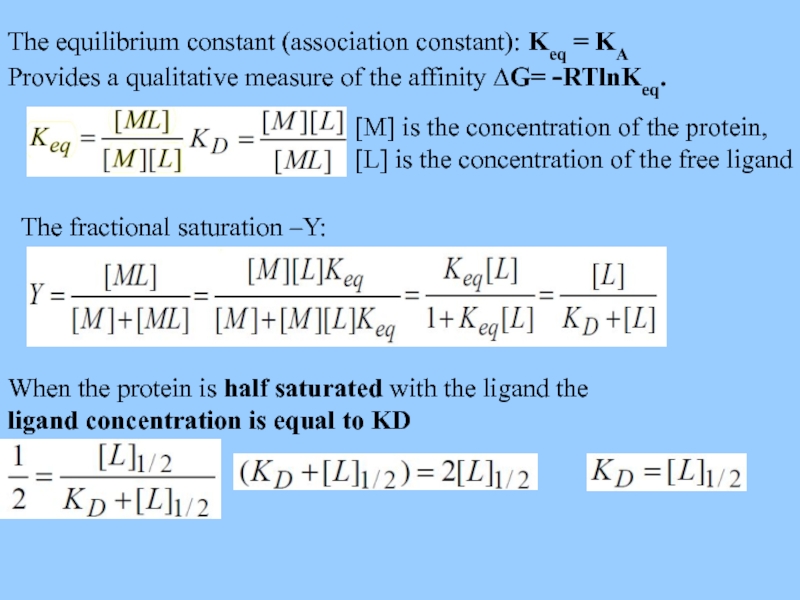
Слайд 24The equilibrium constant (association constant): Keq = KA
Provides a qualitative
[M] is the concentration of the protein,
[L] is the concentration of the free ligand
The fractional saturation –Y:
When the protein is half saturated with the ligand the
ligand concentration is equal to KD
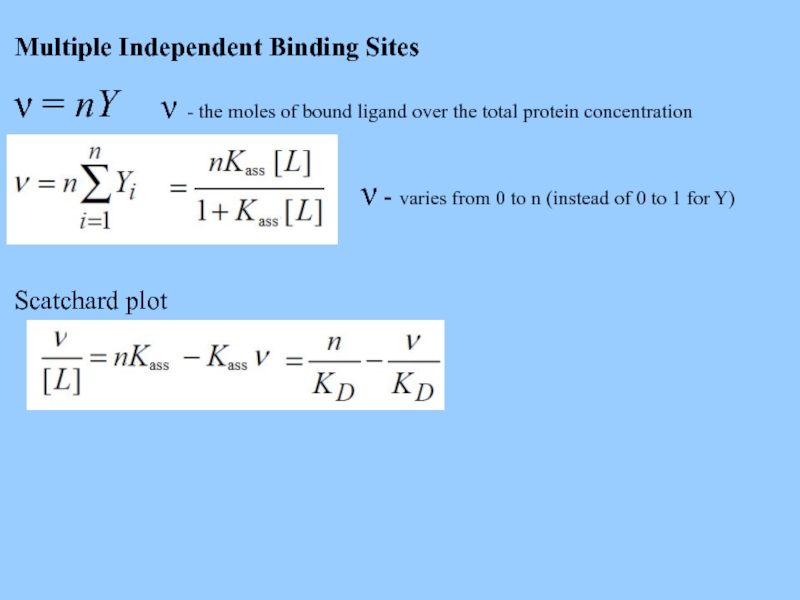
Слайд 25Multiple Independent Binding Sites
ν = nY
ν - the moles of bound
ν - varies from 0 to n (instead of 0 to 1 for Y)
Scatchard plot
Слайд 26Ингибитор снижает Кass
[I] - inhibitor concentration,
KI - association constant of
The fractional saturation –Y:
Конкурентное ингибиторование
Слайд 27Cooperative Binding
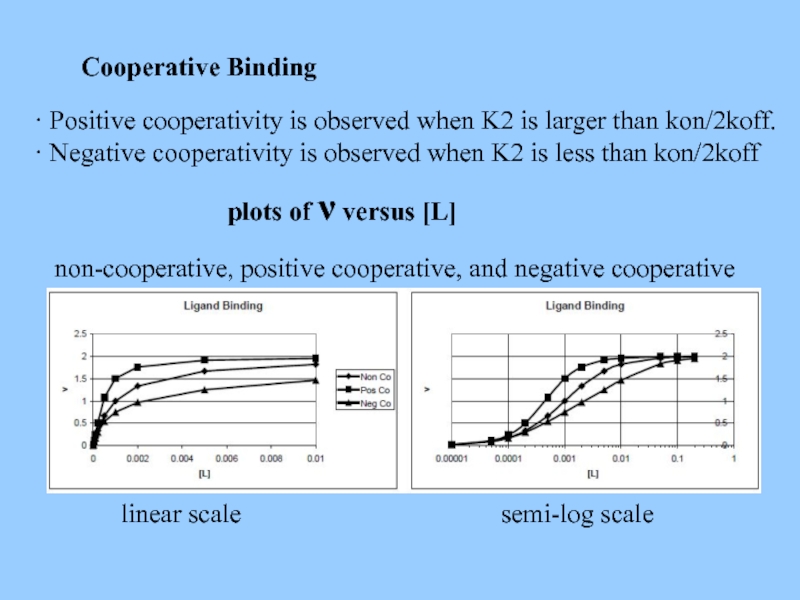
· Positive cooperativity is observed when K2 is larger than
· Negative cooperativity is observed when K2 is less than kon/2koff
plots of ν versus [L]
non-cooperative, positive cooperative, and negative cooperative
linear scale
semi-log scale
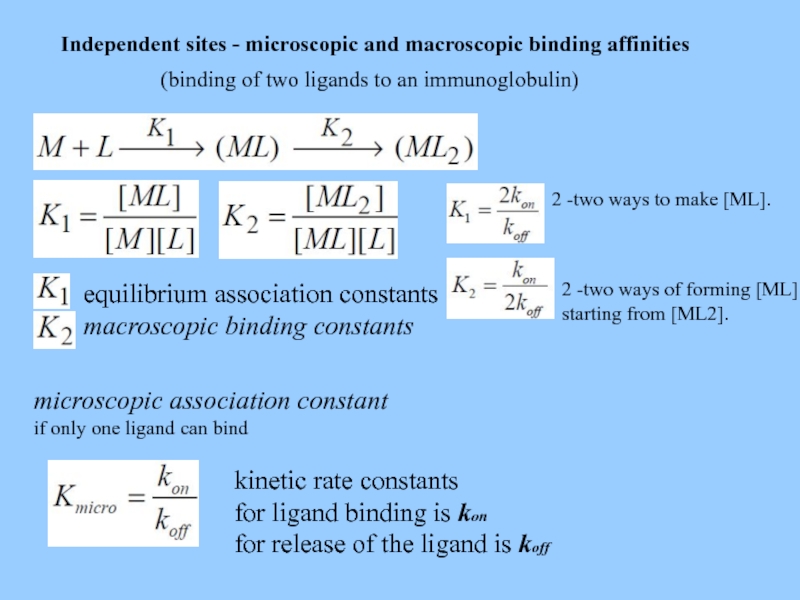
Слайд 30Independent sites - microscopic and macroscopic binding affinities
(binding of two ligands
equilibrium association constants
macroscopic binding constants
microscopic association constant
if only one ligand can bind
kinetic rate constants
for ligand binding is kon
for release of the ligand is koff
2 -two ways to make [ML].
2 -two ways of forming [ML]
starting from [ML2].
Слайд 32Динамическое равновесие в клетке:
Активация белка киназой, деактивация фосфатазой.
В норме сигнал не
Phosphorylation Cascade
Слайд 33A simple model of enzyme action:
V0 = kcat[ES]
Начальная скорость
продукта ([P] << [S]) и
фермента ([E] << [S]).
Слайд 34Скорость образования: [ES] = k1[E][S].
Скорость убывания: [ES] = k-1[ES] +
Стационарное состояние: k-1[ES] + kcat[ES] = k1[E][S]
Условия ([P] << [S]) и ([E] << [S]).
обычно создаются в эксперименте и тогда согласно закону сохранения массы:
[S]0 = [S]free + [ES] + [P] ,
тогда приближенно - [S]0 = [S]
для фермента - [E]total = [E]free + [ES]
Слайд 35Цель, определить [ES] через измеряемые величины.
Сгруппируем константы (кинетические) и
(k-1 + kcat) [ES] = k1 [E][S],
(k-1 + kcat)/k1 = [E][S]/[ES] ;
Km = (k-1 + kcat)/k1
Слайд 37Km = ([E]total - [ES]) [S]/[ES]
[ES] Km = [E]total[S] -
[ES](Km + [S]) = [E]total[S] [ES] = [E]total [S]/(Km + [S])
V0 = kcat[E]total [S]/(Km + [S]) (подставляя в V0 = kcat[ES] )
Слайд 38В условиях насыщения субстратом, когда [ES] = [E]total
Vmax = kcat
V0 = Vmax [S]/(Km + [S])
Это выражение скорости реакции через концентрацию субстрата и Km
Физический смысл Km
При [S] = Km V0 = 1/2 Vmax ; при малых [S]
V0 стремится к Vmax[S] /Km
Vmax /Km (или kcat /Km ) - «каталитическая сила»
Слайд 42About 70 to 80 percent breast precancers have over expression of
Слайд 43One of the fascinating things that
have happened in recent years
an antibody to counteract the
Her-2/neu receptor, can be given intravenously. It has quite a unique mechanism of action. It attaches only to cells with too much Her-2/neu receptor, not the normal ones. Unlike chemotherapy, with which case most dividing cells are destroyed, it is a targeted therapy.
http://EzineArticles.com/?expert=Michael_Russell
Слайд 45Настоящий инженер немедленно начнет писать функцию с 7-ю переменными и минимизировать
Слайд 46Ингибитор снижает Кass
[I] - inhibitor concentration,
KI - association constant of
The fractional saturation –Y:
Слайд 48Spironolactone (верошпирон)
IC50 ~ 2 nM
Aldosterone
Kd ~ 0.14 nM
Aldosterone blood plasma concentration
«норма» ~ 0.2 nM
«отеки, гипертония» ~ 0.5 nM
Доза верошпирона для нормализации - ?
Слайд 51Динамическое равновесие в клетке:
Активация белка киназой, деактивация фосфатазой.
В норме сигнал не
Phosphorylation Cascade
Слайд 52A simple model of enzyme action:
V0 = kcat[ES]
Начальная скорость
продукта ([P] << [S]) и
фермента ([E] << [S]).
Слайд 53Скорость образования: [ES] = k1[E][S].
Скорость убывания: [ES] = k-1[ES] +
Стационарное состояние: k-1[ES] + kcat[ES] = k1[E][S]
Условия ([P] << [S]) и ([E] << [S]).
обычно создаются в эксперименте и тогда согласно закону сохранения массы:
[S]0 = [S]free + [ES] + [P] ,
тогда приближенно - [S]0 = [S]
для фермента - [E]total = [E]free + [ES]
Слайд 54Цель, определить [ES] через измеряемые величины.
Сгруппируем константы (кинетические) и
(k-1 + kcat) [ES] = k1 [E][S],
(k-1 + kcat)/k1 = [E][S]/[ES] ;
Km = (k-1 + kcat)/k1
Слайд 56Km = ([E]total - [ES]) [S]/[ES]
[ES] Km = [E]total[S] -
[ES](Km + [S]) = [E]total[S] [ES] = [E]total [S]/(Km + [S])
V0 = kcat[E]total [S]/(Km + [S]) (подставляя в V0 = kcat[ES] )
Слайд 57В условиях насыщения субстратом, когда [ES] = [E]total
Vmax = kcat
V0 = Vmax [S]/(Km + [S])
Это выражение скорости реакциичерез концентрацию субстрата и Km
Физический смысл Km
При [S] = Km V0 = 1/2 Vmax ; при малых [S]
V0 стремится к Vmax[S] /Km
Vmax /Km (или kcat /Km ) - «каталитическая сила»
Слайд 64Studies of water transport across cell plasma membrane.
Schematic diagram of the
Слайд 65To understand the adaptive reaction better one needs to use mathematical
Hypotonic medium causes cell swelling and activates adaptive mechanism of recovery which is termed Regulatory Volume Decrease (RVD).
Слайд 66
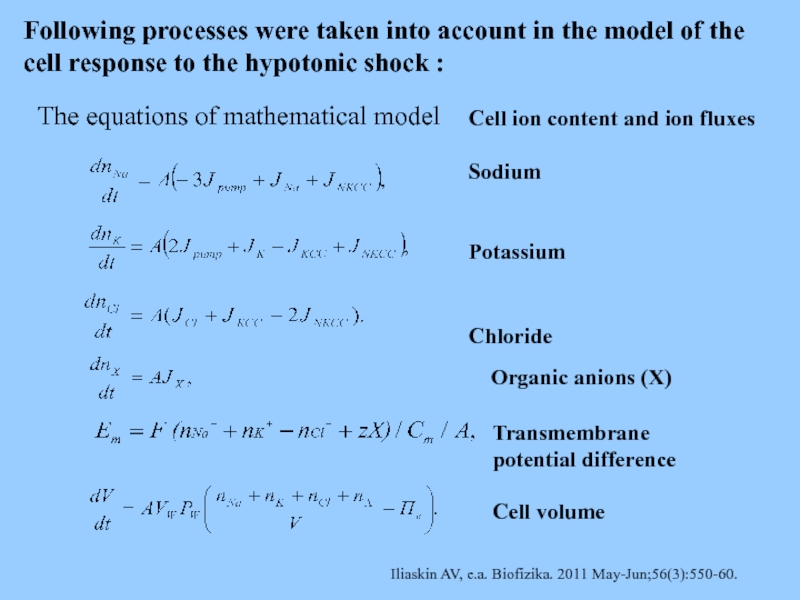
The equations of mathematical model
Transmembrane potential difference
Cell volume
Cell ion content
Sodium
Potassium
Chloride
Organic anions (X)
Iliaskin AV, e.a. Biofizika. 2011 May-Jun;56(3):550-60.
Following processes were taken into account in the model of the cell response to the hypotonic shock :
Слайд 67Simulation of the RVD reaction in consequent shocks Time dependence of relative
B
A
![Ka (B0 - [bl]) = [bl]/ [l] ; Если: [bl] = B ; [l]](/img/tmb/5/474088/f212828d7097923cdd66f8b41a5a7af1-800x.jpg)
![Ингибитор снижает Кass[I] - inhibitor concentration, KI - association constant of the inhibitor.The fractional saturation](/img/tmb/5/474088/04237a1471d775542d9dc5ae3c50b8c7-800x.jpg)
![A simple model of enzyme action: V0 = kcat[ES] Начальная скорость реакции – концентрация продукта](/img/tmb/5/474088/4ede945e604e7a0837eea40601317265-800x.jpg)
![Скорость образования: [ES] = k1[E][S]. Скорость убывания: [ES] = k-1[ES] + kcat [ES]. Стационарное состояние: k-1[ES]](/img/tmb/5/474088/10744e531897248da3aa99e96c1c428b-800x.jpg)
![Цель, определить [ES] через измеряемые величины. Сгруппируем константы (кинетические) и переменные (концентрации): (k-1 + kcat)](/img/tmb/5/474088/082a2bb0df7846b46fa3422efa5ce432-800x.jpg)
![Выразим [E] через [ES] и [E]total: [E] = [E]total -](/img/tmb/5/474088/42b20e8a6891491be87bc340f5ee7e3f-800x.jpg)
![Km = ([E]total - [ES]) [S]/[ES] [ES] Km = [E]total[S] - [ES][S] [ES] Km +](/img/tmb/5/474088/0cfb77532d86b33da4d9d9ade4723abf-800x.jpg)
![В условиях насыщения субстратом, когда [ES] = [E]total Vmax = kcat [E]total подставляем в V0](/img/tmb/5/474088/2f36a80349d823ddf5e934ed31600275-800x.jpg)

![Ингибитор снижает Кass[I] - inhibitor concentration, KI - association constant of the inhibitor.The fractional saturation –Y:](/img/tmb/5/474088/9dee1136775f4797aa3b90463a14fbc4-800x.jpg)


![A simple model of enzyme action: V0 = kcat[ES] Начальная скорость реакции – концентрация продукта](/img/tmb/5/474088/a5d58db1f0755c3649b3040d2aa71bfa-800x.jpg)
![Скорость образования: [ES] = k1[E][S]. Скорость убывания: [ES] = k-1[ES] + kcat [ES]. Стационарное состояние: k-1[ES]](/img/tmb/5/474088/df72666b06b6014f036d4ff522a52d33-800x.jpg)
![Цель, определить [ES] через измеряемые величины. Сгруппируем константы (кинетические) и переменные (концентрации): (k-1 + kcat)](/img/tmb/5/474088/da12983445f0f6f40a7f361d39a3ae39-800x.jpg)
![Выразим [E] через [ES] и [E]total: [E] = [E]total -](/img/tmb/5/474088/c38ffa606c82e318d0ccc2d78b86b8df-800x.jpg)
![Km = ([E]total - [ES]) [S]/[ES] [ES] Km = [E]total[S] - [ES][S] [ES] Km +](/img/tmb/5/474088/ecb954a07c305e3fe661d54b833d9a82-800x.jpg)
![В условиях насыщения субстратом, когда [ES] = [E]total Vmax = kcat [E]total подставляем в V0](/img/tmb/5/474088/bfd0f48868335c500285b24e4bbc4981-800x.jpg)
