- Главная
- Разное
- Дизайн
- Бизнес и предпринимательство
- Аналитика
- Образование
- Развлечения
- Красота и здоровье
- Финансы
- Государство
- Путешествия
- Спорт
- Недвижимость
- Армия
- Графика
- Культурология
- Еда и кулинария
- Лингвистика
- Английский язык
- Астрономия
- Алгебра
- Биология
- География
- Детские презентации
- Информатика
- История
- Литература
- Маркетинг
- Математика
- Медицина
- Менеджмент
- Музыка
- МХК
- Немецкий язык
- ОБЖ
- Обществознание
- Окружающий мир
- Педагогика
- Русский язык
- Технология
- Физика
- Философия
- Химия
- Шаблоны, картинки для презентаций
- Экология
- Экономика
- Юриспруденция
G11.4A- Statistics: Standard Deviation, Error and t-test презентация
Содержание
- 1. G11.4A- Statistics: Standard Deviation, Error and t-test
- 5. Sample Population
- 6. 1 mean of sample 1 2
- 7. The t-test Degrees of freedom Critical
- 8. T-test - Is there significant difference between
- 9. Standard Deviation A graphical expression of the
- 10. Describing the results We can draw a
- 11. There is an overlap in the
- 12. Alternative Hypothesis vs Null Hypothesis Our
- 16. Woodland vs garden petals woodland
- 17. Calculating Standard Deviation Step 1: Find the
- 18. Calculate Standard Error
- 19. Calculate t-test Degrees of freedoms for t-test
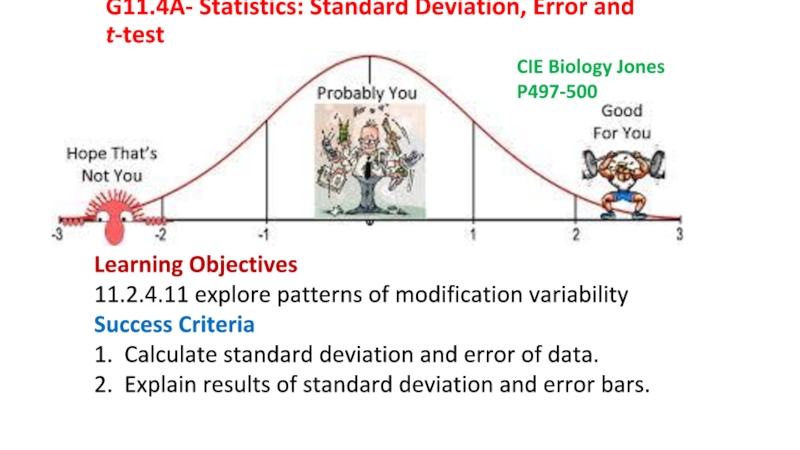
Слайд 1G11.4A- Statistics: Standard Deviation, Error and t-test
CIE Biology Jones
P497-500
Learning
11.2.4.11 explore patterns of modification variability
Success Criteria
1. Calculate standard deviation and error of data.
2. Explain results of standard deviation and error bars.
Слайд 6
1 mean of sample 1
2 mean of sample 2
n1 is number
n2 is number subjects in sample 2
s1 is the standard deviation of sample 1
s2 is the standard deviation of sample 2
Leaf tip to base
Do you remember? Ecology Practical Term 1? T-test and Standard Deviation?
Слайд 7
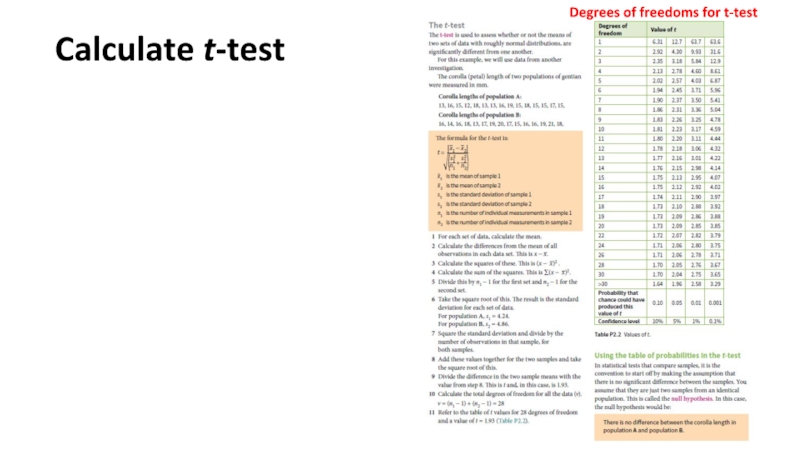
The t-test
Degrees of freedom
Critical
Value
Standard deviation formula is also needed to
between 10-30
Слайд 8T-test - Is there significant difference between two means?
Set up
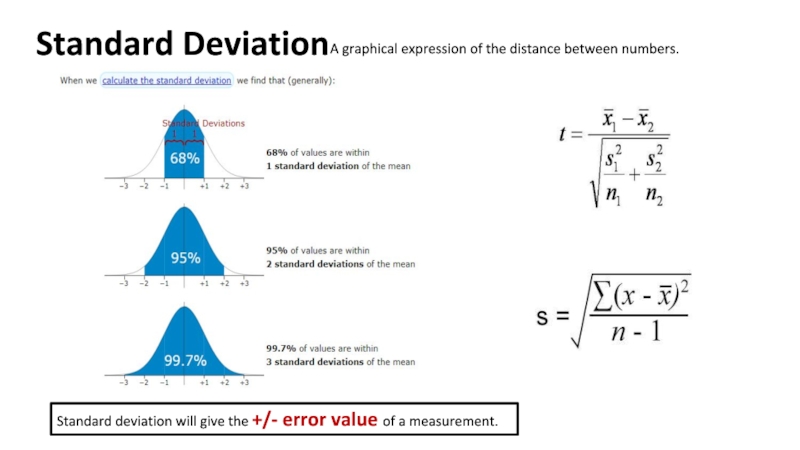
Слайд 9Standard Deviation
A graphical expression of the distance between numbers.
Standard deviation
Слайд 10Describing the results
We can draw a bar chart of the mean
There is no overlap in the (±2 SD) bars.
This indicates that the differences in the means the size of male and females is unlikely to be due to chance.
Note: You cannot say how ‘unlikely’ this is due to chance – just that it is unlikely!
Error Bars
+/-
If there is NO overlap of the error bars overlap, then there is IS significant difference between the two samples.
Слайд 11
There is an overlap in the (±2 SD)
This indicates that the differences in the means between A and B are likely to be due to chance.
Note: You cannot say how ‘likely’ this is due to chance – just that it is likely!
Describing the results
We can draw a bar chart of the mean and plot the ± 2 Standard deviations from the mean and look at the overlap of the bars.
A
B
If error bars overlap, then there is no significant difference between the two samples.
Слайд 12Alternative Hypothesis vs Null Hypothesis
Our calculated value of Chi-squared is
There is less than 5% probability that the differences (between the observed and expected data) are due to chance.
We reject our null hypothesis.
Our calculated value of t is less than the critical value of t.
There is more than 5% probability that the differences in the means (mean of A and the mean of B) are due to chance.
We accept our null hypothesis.
Acceptance or Rejection of the of the Null Hypothesis
Слайд 17Calculating Standard Deviation
Step 1: Find the mean.
Step 2: For each data point, find
Step 3: Sum the values from Step 2.
Step 4: Divide by the number of data points.
Step 5: Take the square root
