- Главная
- Разное
- Дизайн
- Бизнес и предпринимательство
- Аналитика
- Образование
- Развлечения
- Красота и здоровье
- Финансы
- Государство
- Путешествия
- Спорт
- Недвижимость
- Армия
- Графика
- Культурология
- Еда и кулинария
- Лингвистика
- Английский язык
- Астрономия
- Алгебра
- Биология
- География
- Детские презентации
- Информатика
- История
- Литература
- Маркетинг
- Математика
- Медицина
- Менеджмент
- Музыка
- МХК
- Немецкий язык
- ОБЖ
- Обществознание
- Окружающий мир
- Педагогика
- Русский язык
- Технология
- Физика
- Философия
- Химия
- Шаблоны, картинки для презентаций
- Экология
- Экономика
- Юриспруденция
“Meet the Millennials” презентация
Содержание
- 1. “Meet the Millennials”
- 2. Background & Methodology This special report presents
- 3. Open to experiences: a big 5 personality
- 4. What influences Millennial lifestyles and decisions? International Food Information Council Foundation
- 5. Millennials are trying hardest to control happiness
- 6. Millennials who are open to experiences are
- 7. How much of an impact do the
- 8. How much of an impact do the
- 9. How much of an impact do the
- 10. Nearly 40% of Millennials believe a sustainable
- 11. Which of the following, if any, do
- 12. Income drives Millennial purchasing of certain labeled foods.
- 13. What are Millennials’ thoughts on money, time, and the future? International Food Information Council Foundation
- 14. If you had an extra $100 to
- 15. Millennials are equally divided when asked to
- 16. If you suddenly had an extra 4
- 17. If you suddenly had an extra 4
- 18. 2015 n=299; If made resolution n=133
- 19. If you time-traveled 30 years into the
- 20. What are Millennials’ perspectives on cooking and health? International Food Information Council Foundation
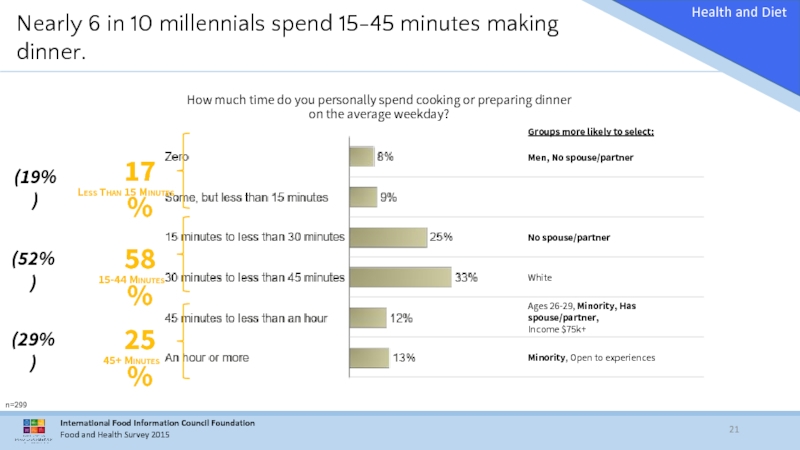
- 21. How much time do you personally spend
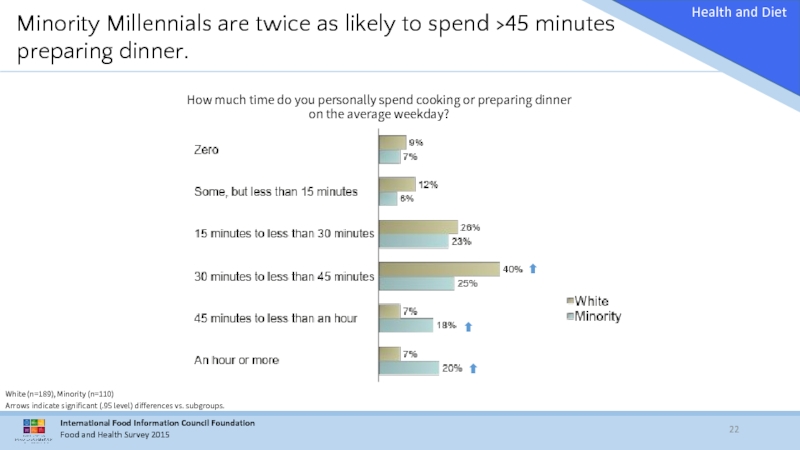
- 22. Minority Millennials are twice as likely to
- 23. How important is it to you to
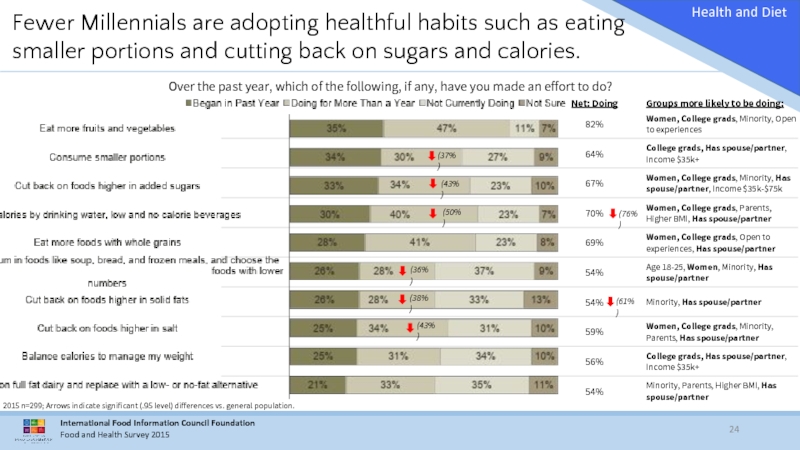
- 24. Over the past year, which of the
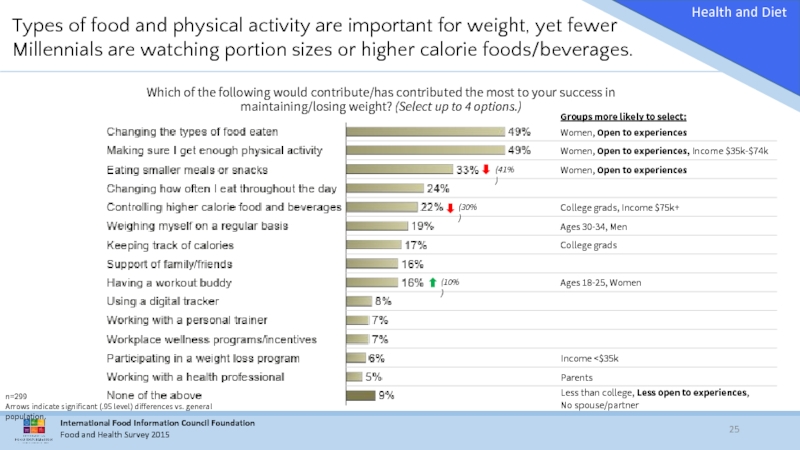
- 25. Which of the following would contribute/has contributed
- 26. In an effort to lose/maintain weight, which
- 27. Which of the following, if any, have
- 28. Millennials trust a variety of sources for
- 29. What do Millennials think about nutrients? International Food Information Council Foundation
- 30. What source of calories are the most
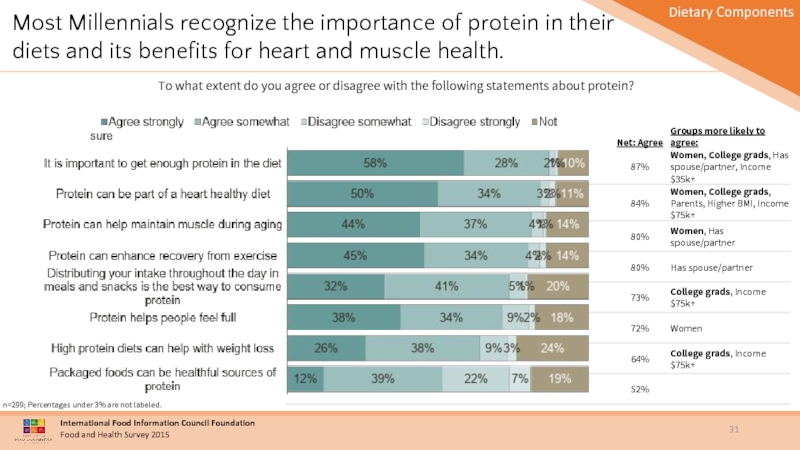
- 31. To what extent do you agree or
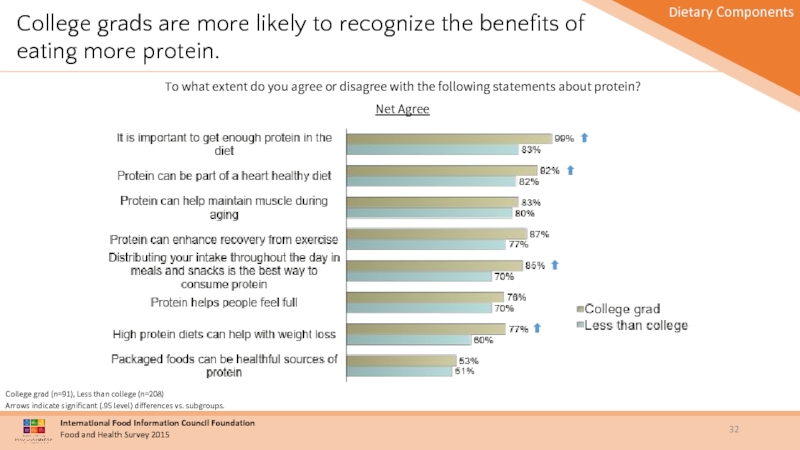
- 32. College grads are more likely to recognize
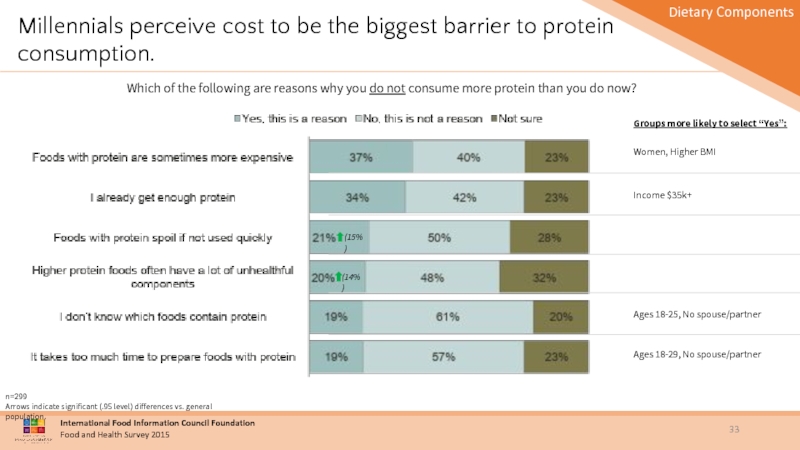
- 33. Which of the following are reasons why
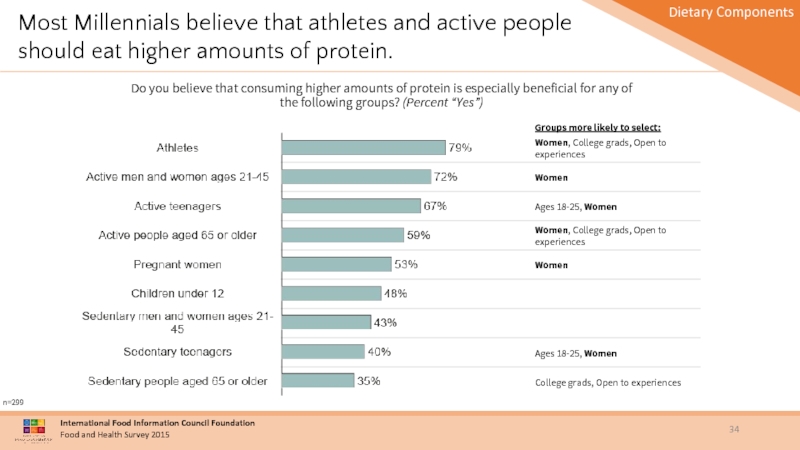
- 34. Do you believe that consuming higher amounts
- 35. Women Millennials are more likely to think that protein
- 36. How would you rate the healthfulness of
- 37. If yes Thinking about the last year,
- 38. How would you rate the healthfulness of
- 39. If yes Thinking about the last year,
- 40. How concerned are you, if at all,
- 41. Millennial women and those with higher incomes
- 42. As far as you know, which of
- 43. ✓ Indicates true statement ✓ ✓ ✓
- 44. What are Millennials avoiding and/or consuming? n=299,
- 45. What are Millennials avoiding and/or consuming? To
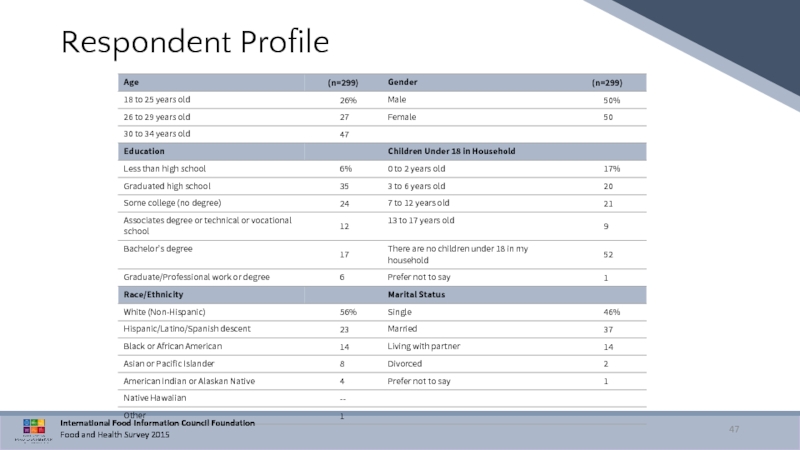
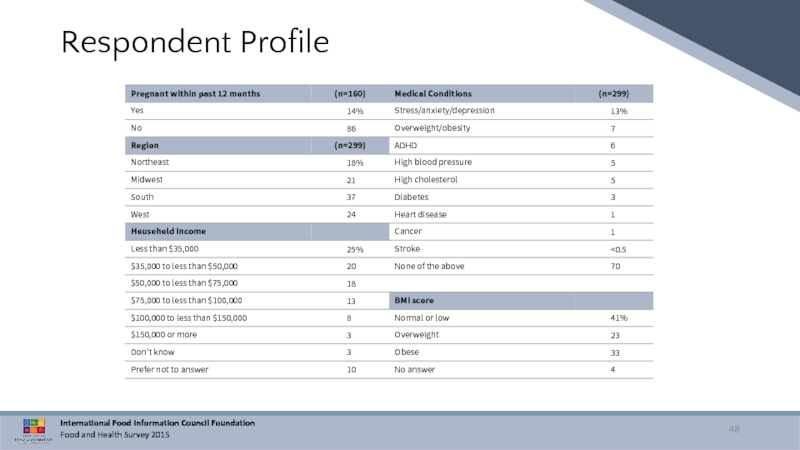
- 46. Respondent Profile International Food Information Council Foundation Food and Health Survey 2015
- 47. International Food Information Council Foundation Food and Health Survey 2015 Respondent Profile
- 48. International Food Information Council Foundation Food and Health Survey 2015 Respondent Profile
Слайд 2Background & Methodology
This special report presents the results of the 2015
For this report, Millennials are defined as those between the ages of 18 and 34. In addition, this report also highlights subgroup differences within the Millennial generation. These subgroups include:
Age groups (18-25, 26-29, 30-34)
Male vs. Female
Education (College grad vs. less than college)
Race/Ethnicity (White vs. minority)
Parents vs. non-parents
The survey was conducted by Greenwald & Associates, using ResearchNow’s consumer panel. Fielding took place from March 13 to March 26, 2015. The duration of the survey was 29 minutes, on average.
The results were weighted to ensure that they are reflective of the American population, as seen in the 2014 Current Population Survey. Specifically, they were weighted by age, education, gender, race/ethnicity, and region.
Those married (or living with a partner) vs. those who are not
Higher (Overweight/Obese) vs. Lower (Normal/Low) BMI
Household Income (Less than $35K, $35K-$74K, $75K or more)
Open to experiences vs. less open to experiences (constructed using the Ten-Item Personality Inventory (TIPI))
Слайд 3Open to experiences: a big 5 personality trait
Openness to Experiences
Open-minded
Curious
Reflective
Creative
The Big
Слайд 4What influences Millennial lifestyles and decisions?
International Food Information Council Foundation
Слайд 5Millennials are trying hardest to control happiness and income.
How much do
n=299; Percentages under 3% are not labeled.
Arrows indicate significant (.95 level) differences vs. general population.
(55%)
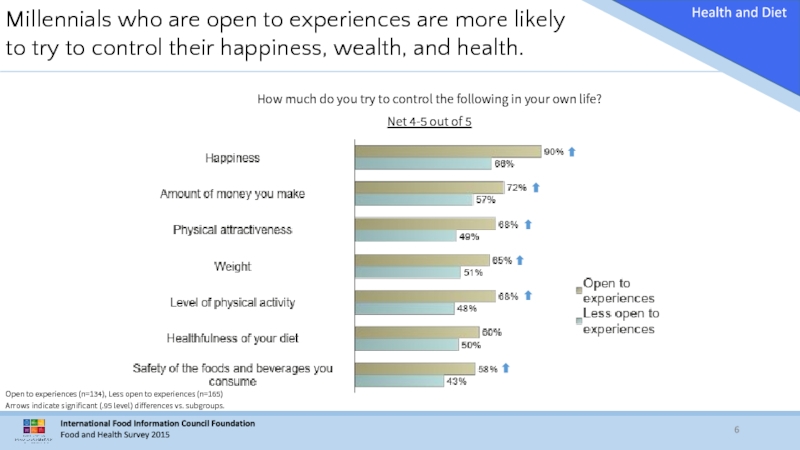
Слайд 6Millennials who are open to experiences are more likely to try
Open to experiences (n=134), Less open to experiences (n=165)
Arrows indicate significant (.95 level) differences vs. subgroups.
How much do you try to control the following in your own life?
Net 4-5 out of 5
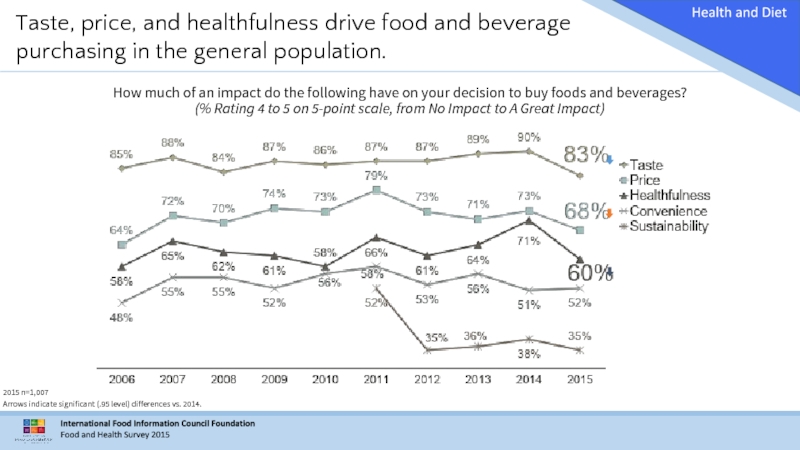
Слайд 7How much of an impact do the following have on your
2015 n=1,007
Arrows indicate significant (.95 level) differences vs. 2014.
Taste, price, and healthfulness drive food and beverage purchasing in the general population.
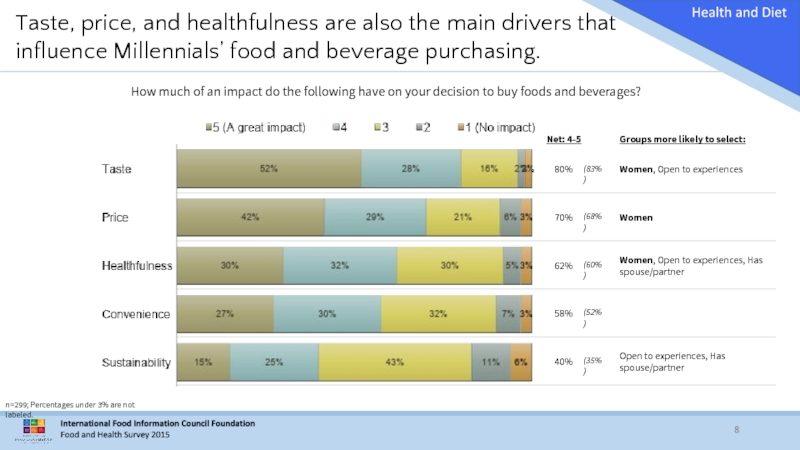
Слайд 8How much of an impact do the following have on your
Taste, price, and healthfulness are also the main drivers that influence Millennials’ food and beverage purchasing.
n=299; Percentages under 3% are not labeled.
(83%)
(68%)
(60%)
(52%)
(35%)
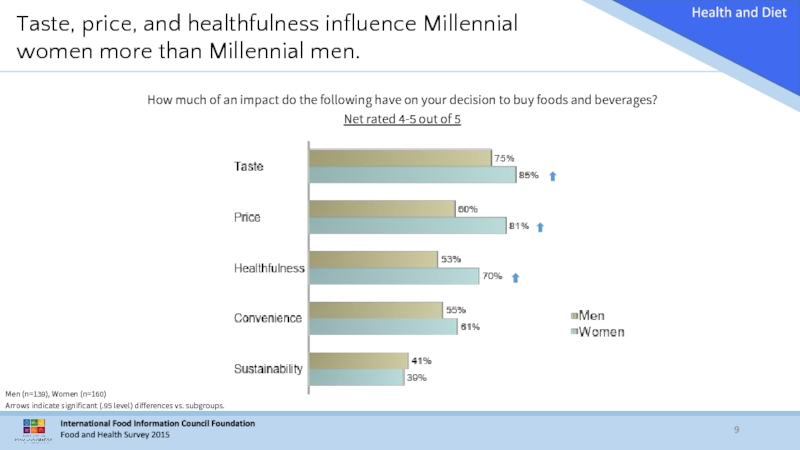
Слайд 9How much of an impact do the following have on your
Net rated 4-5 out of 5
Taste, price, and healthfulness influence Millennial women more than Millennial men.
Men (n=139), Women (n=160)
Arrows indicate significant (.95 level) differences vs. subgroups.
Слайд 10Nearly 40% of Millennials believe a sustainable diet means eating balanced,
A sustainable diet means that the foods you eat…
(Please select up to 3.)
n=299
Arrows indicate significant (.95 level) differences vs. general population.
(13%)
(8%)
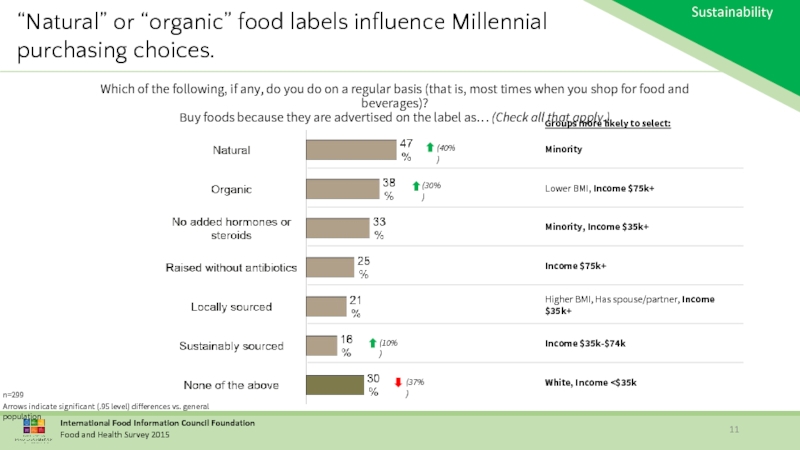
Слайд 11Which of the following, if any, do you do on a
Buy foods because they are advertised on the label as… (Check all that apply.)
n=299
Arrows indicate significant (.95 level) differences vs. general population
“Natural” or “organic” food labels influence Millennial purchasing choices.
(40%)
(30%)
(10%)
(37%)
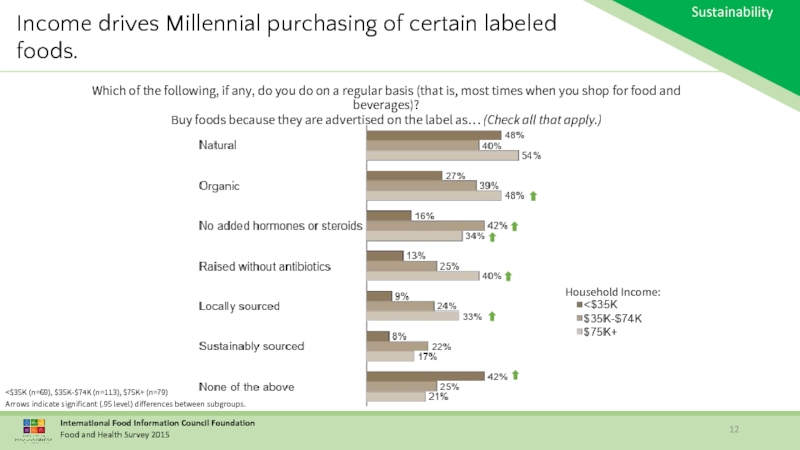
Слайд 12Income drives Millennial purchasing of certain labeled foods.
Arrows indicate significant (.95 level) differences between subgroups.
Which of the following, if any, do you do on a regular basis (that is, most times when you shop for food and beverages)?
Buy foods because they are advertised on the label as… (Check all that apply.)
Household Income:
Слайд 13What are Millennials’ thoughts on money, time, and the future?
International Food
Слайд 14If you had an extra $100 to spend every month, what
n=299
Arrows indicate significant (.95 level) differences vs. general population.
If given extra money, Millennials would spend it on groceries, entertainment, or fitness.
(13%)
(13%)
(9%)
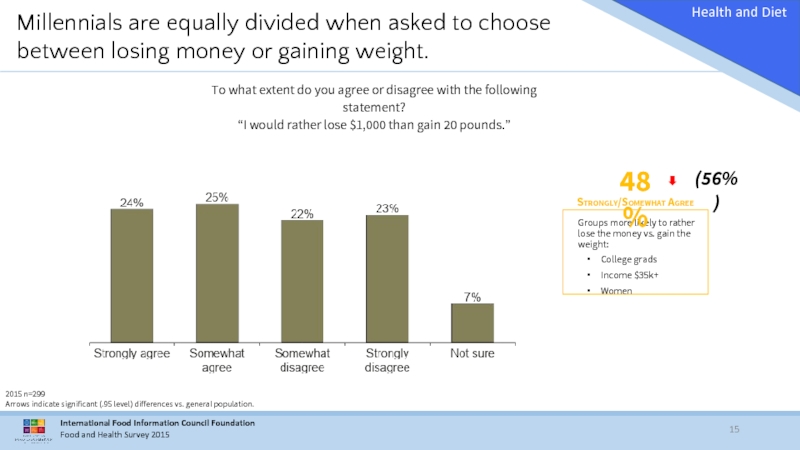
Слайд 15Millennials are equally divided when asked to choose between losing money
To what extent do you agree or disagree with the following statement?
“I would rather lose $1,000 than gain 20 pounds.”
2015 n=299
Arrows indicate significant (.95 level) differences vs. general population.
Groups more likely to rather lose the money vs. gain the weight:
College grads
Income $35k+
Women
48%
Strongly/Somewhat Agree
(56%)
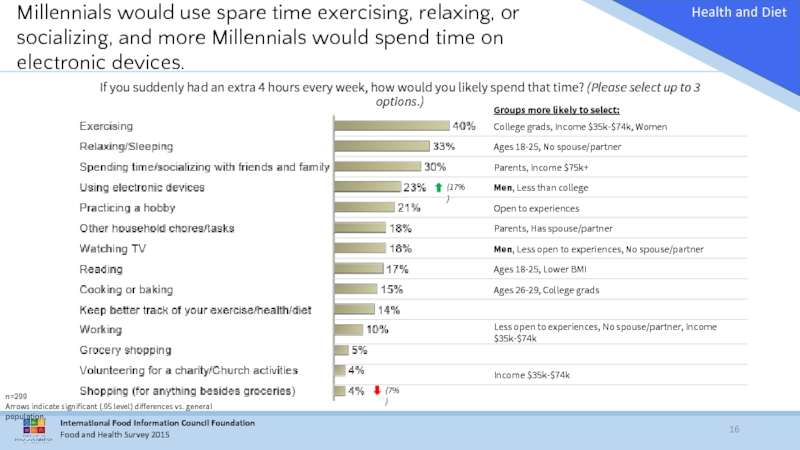
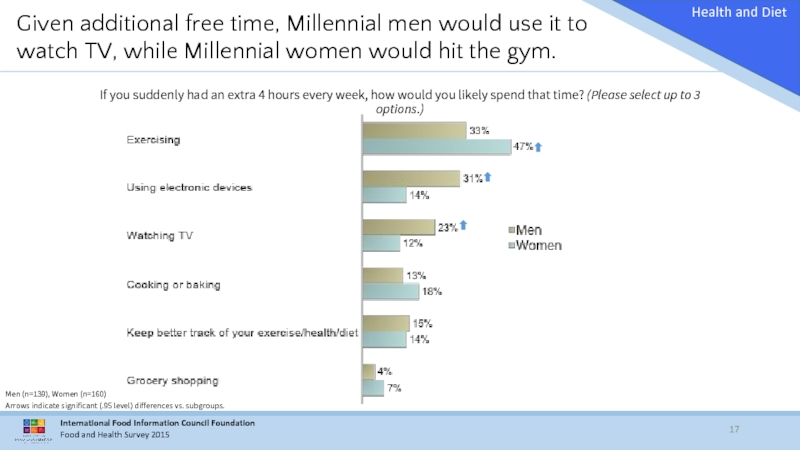
Слайд 16If you suddenly had an extra 4 hours every week, how
Millennials would use spare time exercising, relaxing, or socializing, and more Millennials would spend time on electronic devices.
n=299
Arrows indicate significant (.95 level) differences vs. general population.
(17%)
(7%)
Слайд 17If you suddenly had an extra 4 hours every week, how
Given additional free time, Millennial men would use it to watch TV, while Millennial women would hit the gym.
Men (n=139), Women (n=160)
Arrows indicate significant (.95 level) differences vs. subgroups.
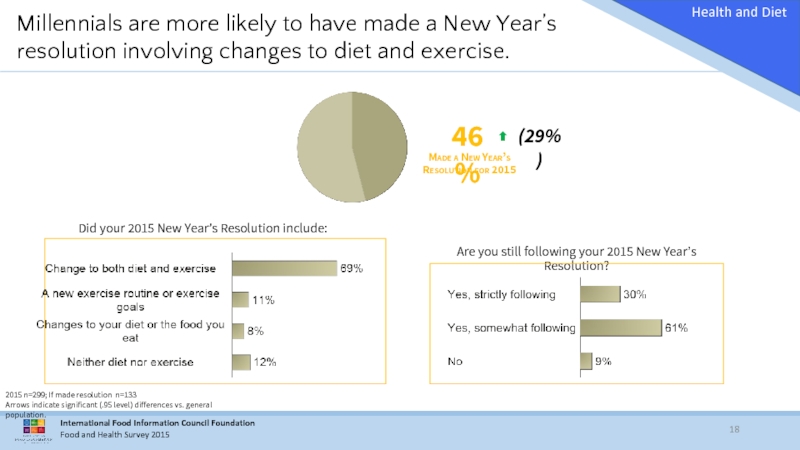
Слайд 18
2015 n=299; If made resolution n=133
Arrows indicate significant (.95 level)
Did your 2015 New Year’s Resolution include:
Are you still following your 2015 New Year’s Resolution?
Millennials are more likely to have made a New Year’s resolution involving changes to diet and exercise.
46%
Made a New Year’s Resolution for 2015
(29%)
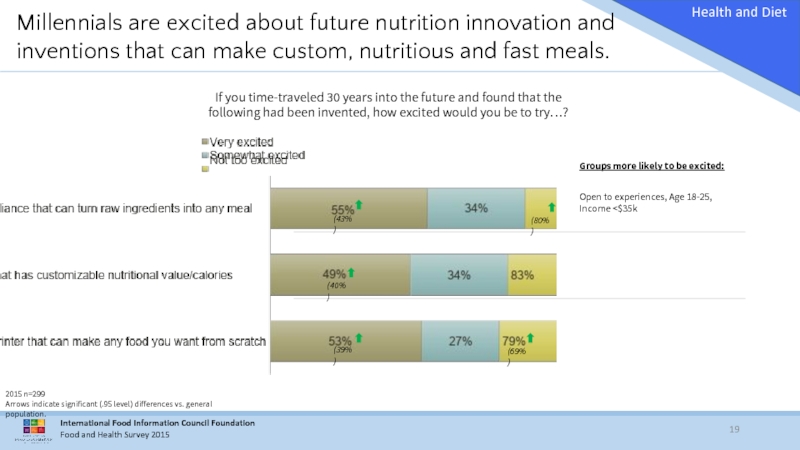
Слайд 19If you time-traveled 30 years into the future and found that
2015 n=299
Arrows indicate significant (.95 level) differences vs. general population.
Millennials are excited about future nutrition innovation and inventions that can make custom, nutritious and fast meals.
(43%)
(40%)
(39%)
(69%)
(80%)
Слайд 20What are Millennials’ perspectives on cooking and health?
International Food Information Council
Слайд 21How much time do you personally spend cooking or preparing dinner
n=299
Nearly 6 in 10 millennials spend 15-45 minutes making dinner.
17%
Less Than 15 Minutes
58%
15-44 Minutes
25%
45+ Minutes
(19%)
(52%)
(29%)
Слайд 22Minority Millennials are twice as likely to spend >45 minutes preparing
White (n=189), Minority (n=110)
Arrows indicate significant (.95 level) differences vs. subgroups.
How much time do you personally spend cooking or preparing dinner on the average weekday?
Слайд 23How important is it to you to be able to customize
Millennials want to customize their food at restaurants.
2015 n=299, Arrows indicate significant (.95 level) differences vs. general population.
69%
Want to Customize Food
Who is more likely to see it as important?
Women
Слайд 24Over the past year, which of the following, if any, have
Fewer Millennials are adopting healthful habits such as eating smaller portions and cutting back on sugars and calories.
2015 n=299; Arrows indicate significant (.95 level) differences vs. general population.
(37%)
(43%)
(50%)
(36%)
(38%)
(43%)
(76%)
(61%)
Слайд 25Which of the following would contribute/has contributed the most to your
Types of food and physical activity are important for weight, yet fewer Millennials are watching portion sizes or higher calorie foods/beverages.
n=299
Arrows indicate significant (.95 level) differences vs. general population.
(41%)
(30%)
(10%)
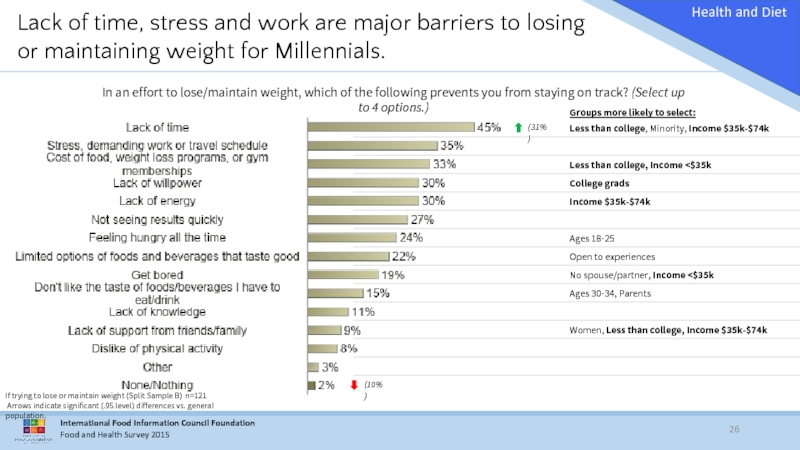
Слайд 26In an effort to lose/maintain weight, which of the following prevents
If trying to lose or maintain weight (Split Sample B) n=121
Arrows indicate significant (.95 level) differences vs. general population.
Lack of time, stress and work are major barriers to losing or maintaining weight for Millennials.
(31%)
(10%)
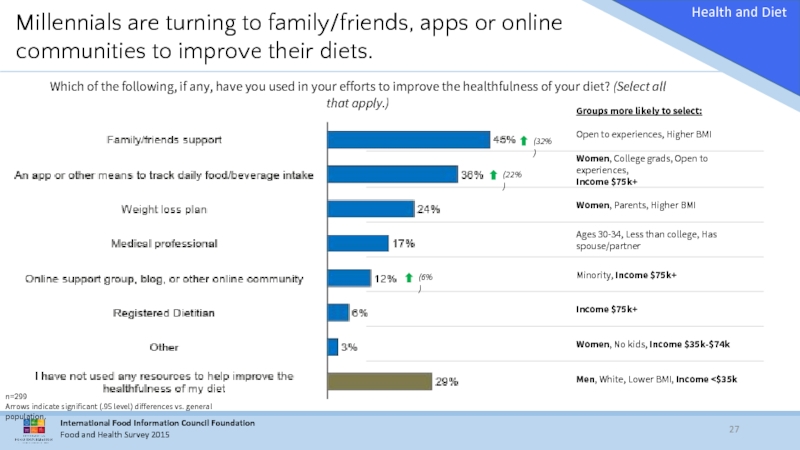
Слайд 27Which of the following, if any, have you used in your
Millennials are turning to family/friends, apps or online communities to improve their diets.
n=299
Arrows indicate significant (.95 level) differences vs. general population.
(32%)
(22%)
(6%)
Слайд 28Millennials trust a variety of sources for accurate nutrition information, especially
Which one of these sources would you trust the most to provide accurate information about the types of food you should be eating? (Please select up to 3.)
n=299
Arrows indicate significant (.95 level) differences vs. general population.
(34%)
(24%)
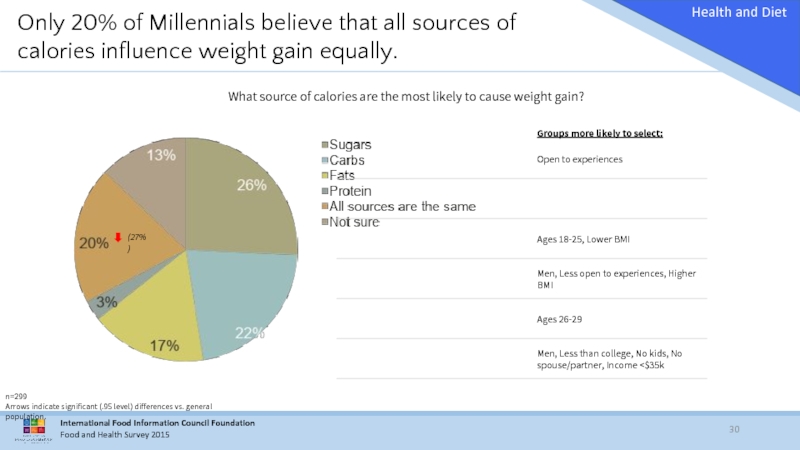
Слайд 30What source of calories are the most likely to cause weight
Only 20% of Millennials believe that all sources of calories influence weight gain equally.
n=299
Arrows indicate significant (.95 level) differences vs. general population.
(27%)
Слайд 31To what extent do you agree or disagree with the following
Most Millennials recognize the importance of protein in their diets and its benefits for heart and muscle health.
n=299; Percentages under 3% are not labeled.
Слайд 32College grads are more likely to recognize the benefits of eating
College grad (n=91), Less than college (n=208)
Arrows indicate significant (.95 level) differences vs. subgroups.
To what extent do you agree or disagree with the following statements about protein?
Net Agree
Слайд 33Which of the following are reasons why you do not consume
Millennials perceive cost to be the biggest barrier to protein consumption.
n=299
Arrows indicate significant (.95 level) differences vs. general population.
(15%)
(14%)
Слайд 34Do you believe that consuming higher amounts of protein is especially
n=299
Most Millennials believe that athletes and active people should eat higher amounts of protein.
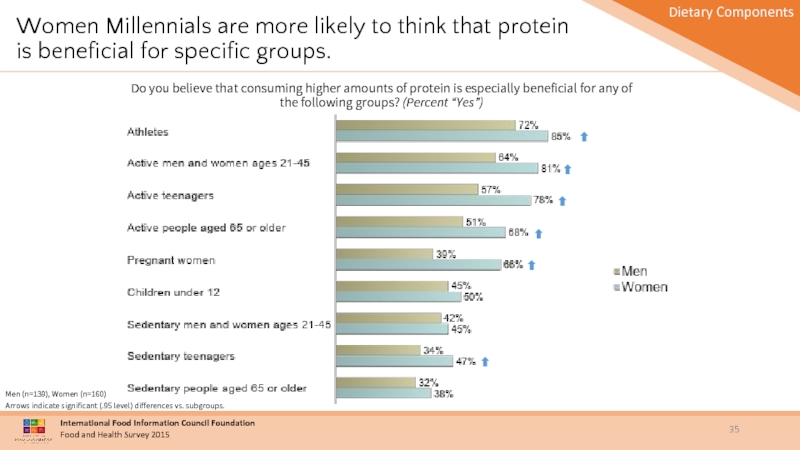
Слайд 35Women Millennials are more likely to think that protein is beneficial for specific groups.
Men
Arrows indicate significant (.95 level) differences vs. subgroups.
Do you believe that consuming higher amounts of protein is especially beneficial for any of the following groups? (Percent “Yes”)
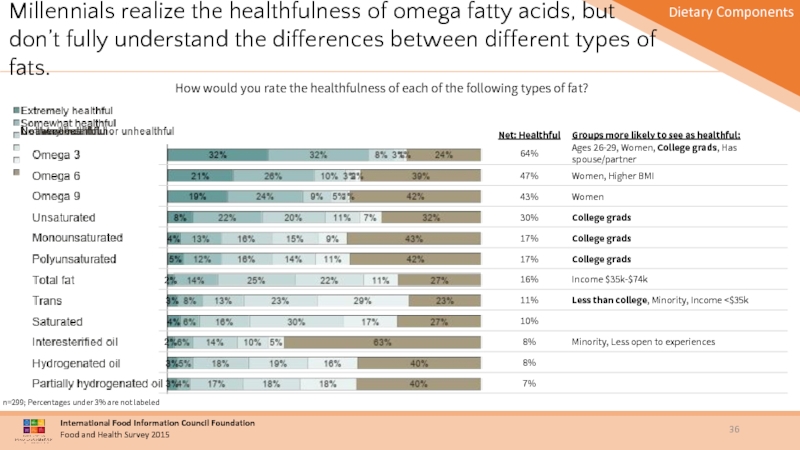
Слайд 36How would you rate the healthfulness of each of the following
Millennials realize the healthfulness of omega fatty acids, but don’t fully understand the differences between different types of fats.
n=299; Percentages under 3% are not labeled
Слайд 37If yes
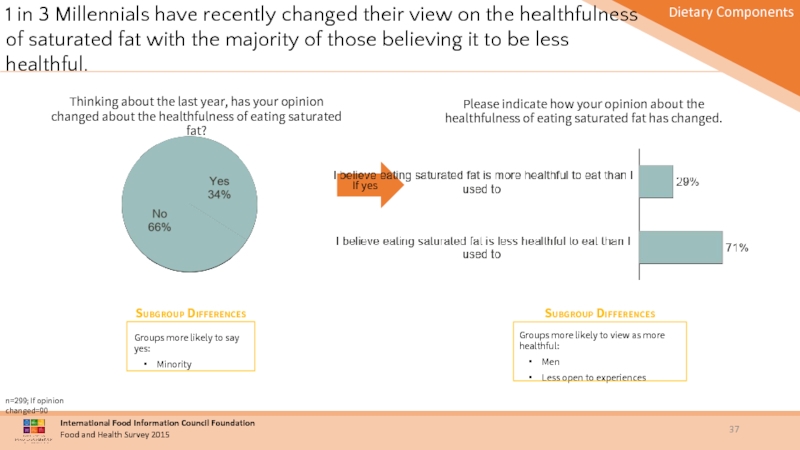
Thinking about the last year, has your opinion changed about
n=299; If opinion changed=90
Please indicate how your opinion about the healthfulness of eating saturated fat has changed.
1 in 3 Millennials have recently changed their view on the healthfulness of saturated fat with the majority of those believing it to be less healthful.
Groups more likely to say yes:
Minority
Groups more likely to view as more healthful:
Men
Less open to experiences
Subgroup Differences
Subgroup Differences
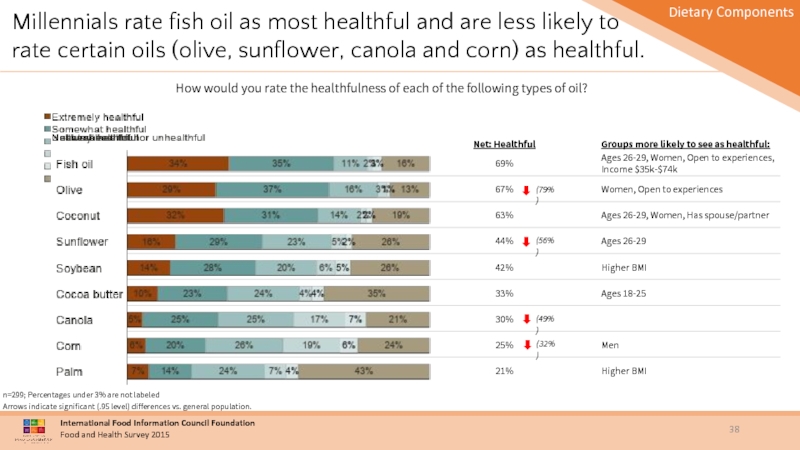
Слайд 38How would you rate the healthfulness of each of the following
n=299; Percentages under 3% are not labeled
Arrows indicate significant (.95 level) differences vs. general population.
Millennials rate fish oil as most healthful and are less likely to rate certain oils (olive, sunflower, canola and corn) as healthful.
(79%)
(56%)
(49%)
(32%)
Слайд 39If yes
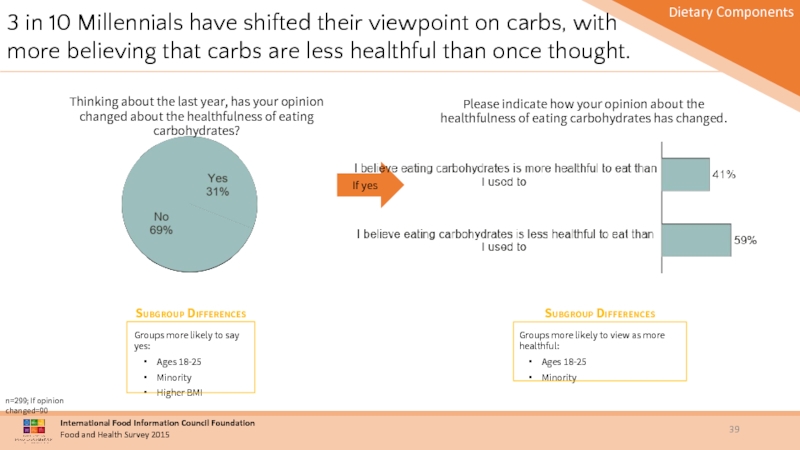
Thinking about the last year, has your opinion changed about
n=299; If opinion changed=90
Please indicate how your opinion about the healthfulness of eating carbohydrates has changed.
3 in 10 Millennials have shifted their viewpoint on carbs, with more believing that carbs are less healthful than once thought.
Groups more likely to say yes:
Ages 18-25
Minority
Higher BMI
Groups more likely to view as more healthful:
Ages 18-25
Minority
Subgroup Differences
Subgroup Differences
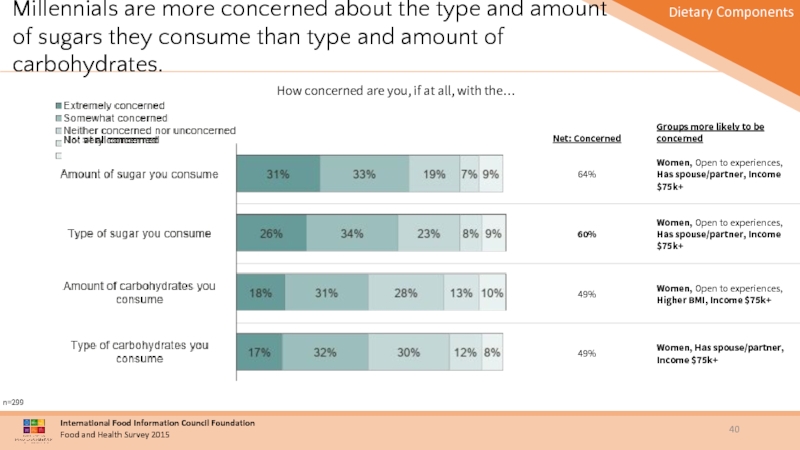
Слайд 40How concerned are you, if at all, with the…
n=299
Millennials are more
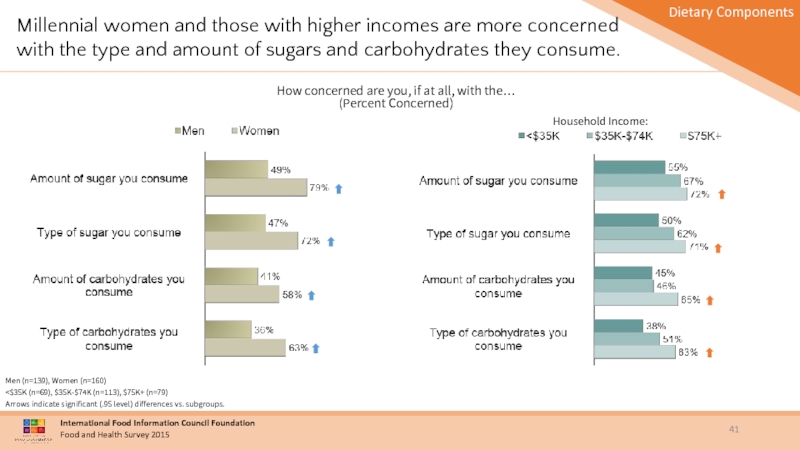
Слайд 41Millennial women and those with higher incomes are more concerned
Men (n=139), Women (n=160)
<$35K (n=69), $35K-$74K (n=113), $75K+ (n=79)
Arrows indicate significant (.95 level) differences vs. subgroups.
How concerned are you, if at all, with the…
(Percent Concerned)
Household Income:
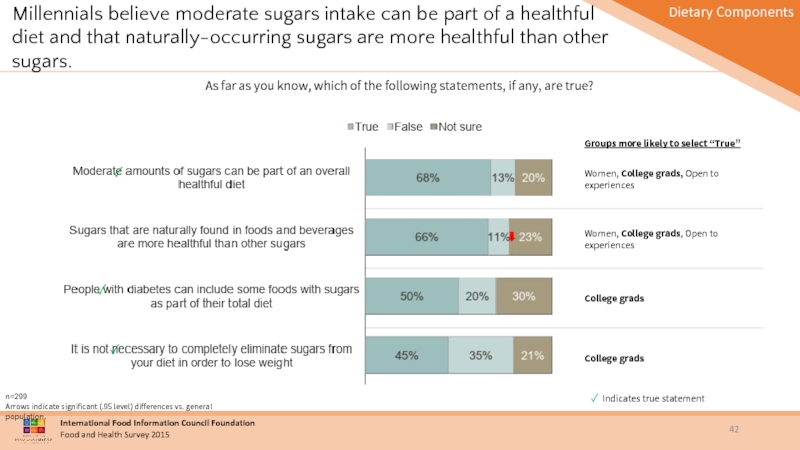
Слайд 42As far as you know, which of the following statements, if
Millennials believe moderate sugars intake can be part of a healthful diet and that naturally-occurring sugars are more healthful than other sugars.
✓
✓
✓
✓ Indicates true statement
n=299
Arrows indicate significant (.95 level) differences vs. general population.
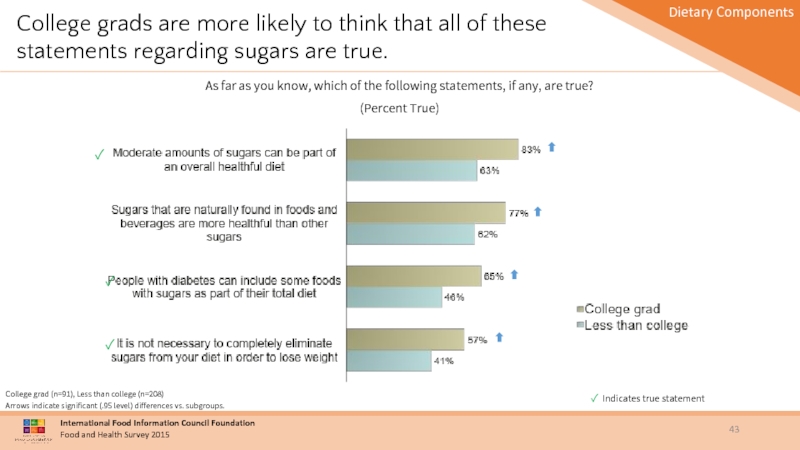
Слайд 43✓ Indicates true statement
✓
✓
✓
College grads are more likely to think that
College grad (n=91), Less than college (n=208)
Arrows indicate significant (.95 level) differences vs. subgroups.
As far as you know, which of the following statements, if any, are true?
(Percent True)
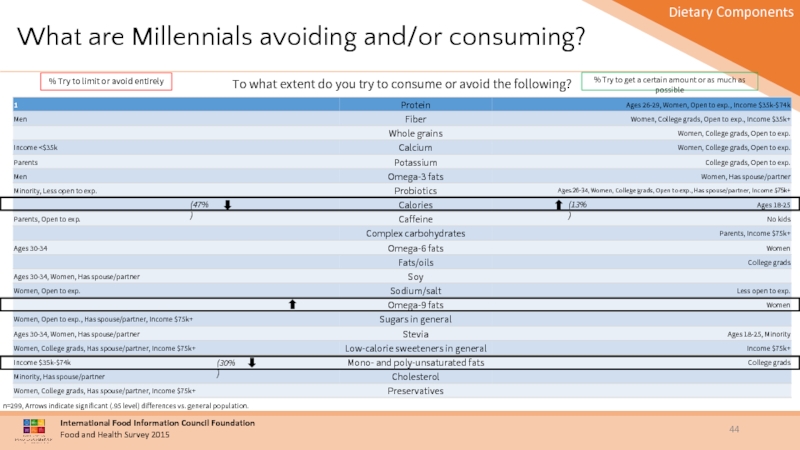
Слайд 44What are Millennials avoiding and/or consuming?
n=299, Arrows indicate significant (.95 level)
To what extent do you try to consume or avoid the following?
% Try to limit or avoid entirely
% Try to get a certain amount or as much as possible
(47%)
(13%)
(30%)
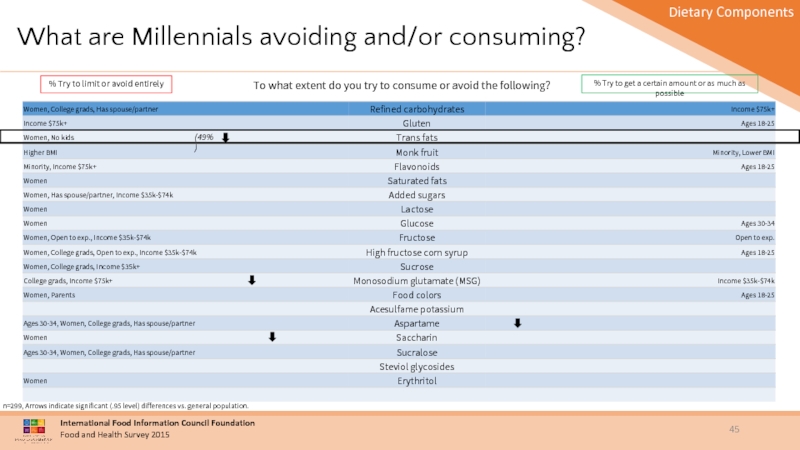
Слайд 45What are Millennials avoiding and/or consuming?
To what extent do you try
% Try to limit or avoid entirely
% Try to get a certain amount or as much as possible
n=299, Arrows indicate significant (.95 level) differences vs. general population.
(49%)

