- Главная
- Разное
- Дизайн
- Бизнес и предпринимательство
- Аналитика
- Образование
- Развлечения
- Красота и здоровье
- Финансы
- Государство
- Путешествия
- Спорт
- Недвижимость
- Армия
- Графика
- Культурология
- Еда и кулинария
- Лингвистика
- Английский язык
- Астрономия
- Алгебра
- Биология
- География
- Детские презентации
- Информатика
- История
- Литература
- Маркетинг
- Математика
- Медицина
- Менеджмент
- Музыка
- МХК
- Немецкий язык
- ОБЖ
- Обществознание
- Окружающий мир
- Педагогика
- Русский язык
- Технология
- Физика
- Философия
- Химия
- Шаблоны, картинки для презентаций
- Экология
- Экономика
- Юриспруденция
Identify the population and the sample презентация
Содержание
- 1. Identify the population and the sample
- 2. 1.) Identify the population and the
- 3. 2.) Determine whether the numerical value describes
- 4. Parameter vs. Statistic, cont’d 4.) Nineteen percent
- 5. 3.) Determine which are qualitative data and
- 6. Qualitative vs Quantitative, cont’d 4.) A college
- 7. 5.) Identify the set’s level of measurement.
- 8. Level of Measurement, cont’d (c) Survey responses
- 9. 6.) Decide which method of data collection
- 10. Method of data collection, cont’d (d) A
- 11. 7.) Identify which sampling technique was used
- 12. Sampling technique, cont’d (d) Law enforcement officials
- 13. 8.) Identify a bias or error that
Слайд 2
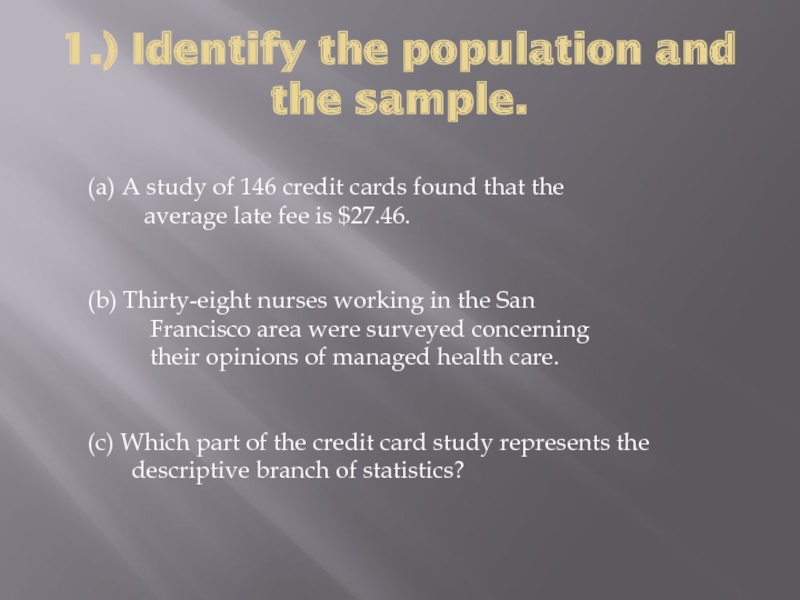
1.) Identify the population and the sample.
(a) A study of 146
average late fee is $27.46.
(b) Thirty-eight nurses working in the San
Francisco area were surveyed concerning
their opinions of managed health care.
(c) Which part of the credit card study represents the
descriptive branch of statistics?
Слайд 32.) Determine whether the numerical value describes a parameter or a
1.) After inspecting all of the 55,000 kg of meat stored at the Wurst sausage Company, it was found that 45,000 kg of the meat were spoiled.
2.) In a survey of 752 adults in the U.S., 42% think there should be a law that prohibits people from talking on cell phones in public places.
Слайд 4Parameter vs. Statistic, cont’d
4.) Nineteen percent of a sample of Indiana
3.) After taking the first exam, 15 of the students dropped the class
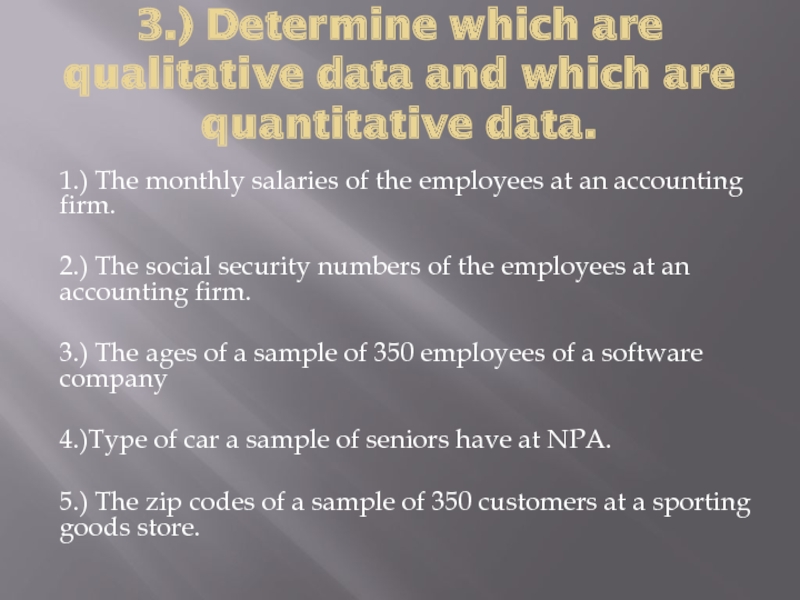
Слайд 53.) Determine which are qualitative data and which are quantitative data.
1.) The monthly salaries of the employees at an accounting firm.
2.) The social security numbers of the employees at an accounting firm.
3.) The ages of a sample of 350 employees of a software company
4.)Type of car a sample of seniors have at NPA.
5.) The zip codes of a sample of 350 customers at a sporting goods store.
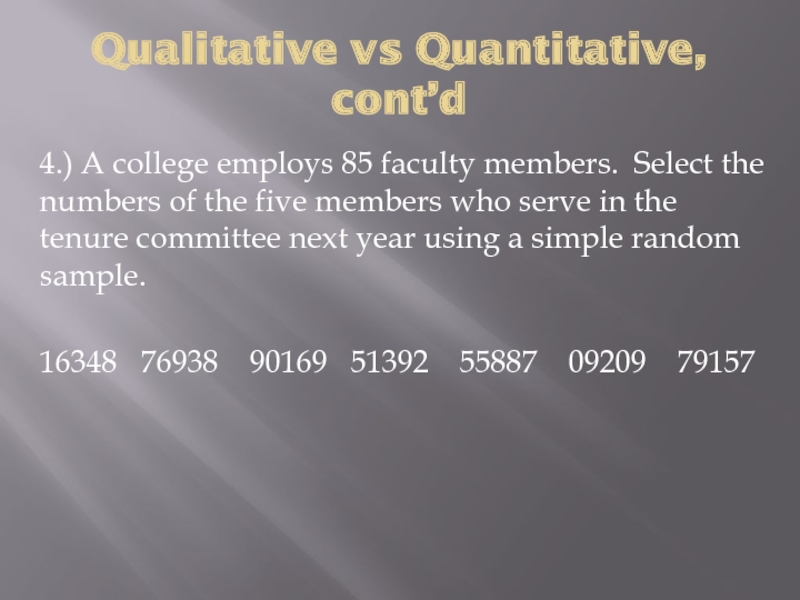
Слайд 6Qualitative vs Quantitative, cont’d
4.) A college employs 85 faculty members. Select
16348 76938 90169 51392 55887 09209 79157
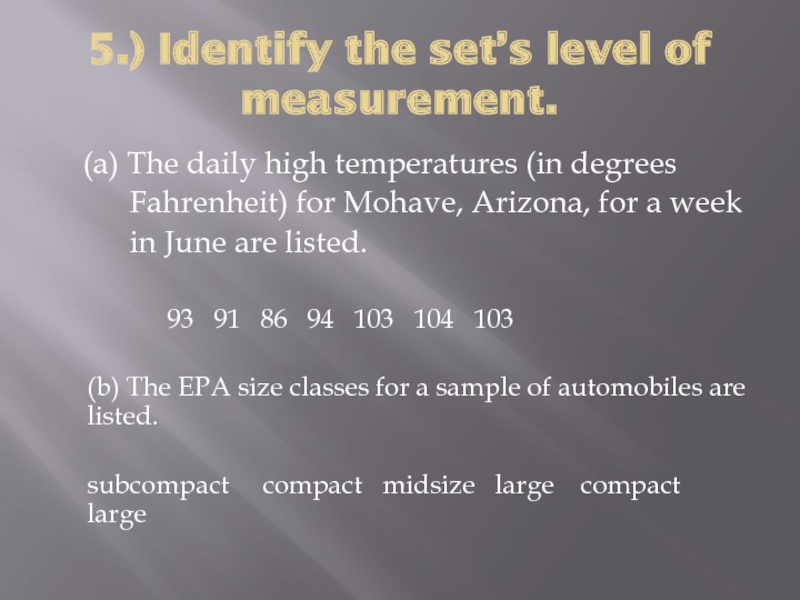
Слайд 75.) Identify the set’s level of measurement.
(a) The
Fahrenheit) for Mohave, Arizona, for a week
in June are listed.
93 91 86 94 103 104 103
(b) The EPA size classes for a sample of automobiles are listed.
subcompact compact midsize large compact large
Слайд 8Level of Measurement, cont’d
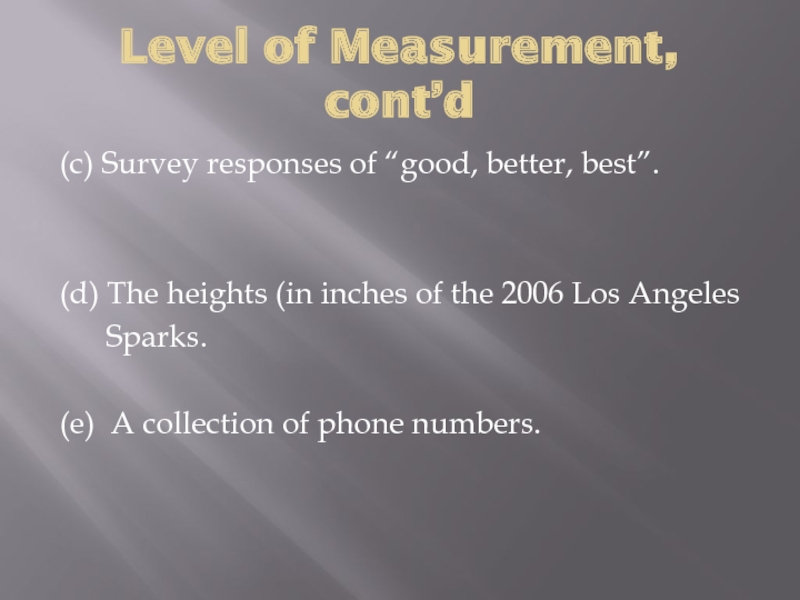
(c) Survey responses of “good, better, best”.
(d) The
Sparks.
(e) A collection of phone numbers.
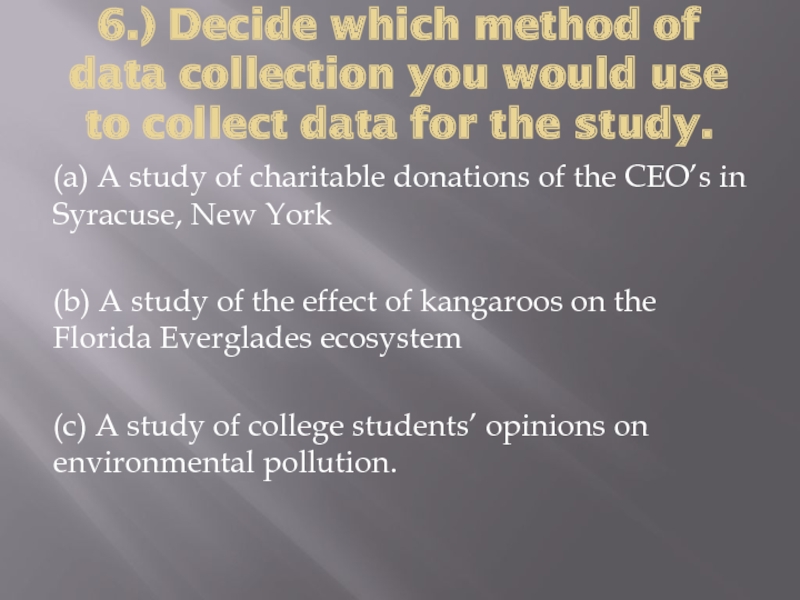
Слайд 96.) Decide which method of data collection you would use to
(a) A study of charitable donations of the CEO’s in Syracuse, New York
(b) A study of the effect of kangaroos on the Florida Everglades ecosystem
(c) A study of college students’ opinions on environmental pollution.
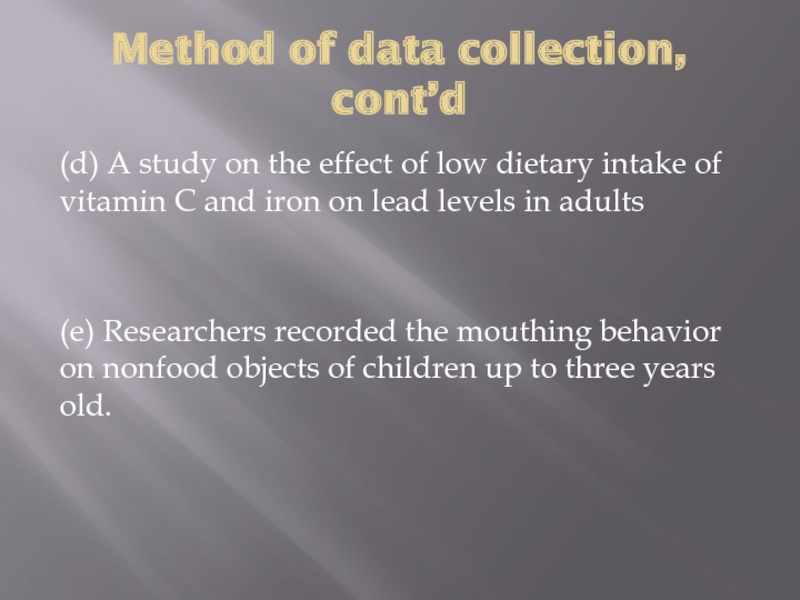
Слайд 10Method of data collection, cont’d
(d) A study on the effect of
(e) Researchers recorded the mouthing behavior on nonfood objects of children up to three years old.
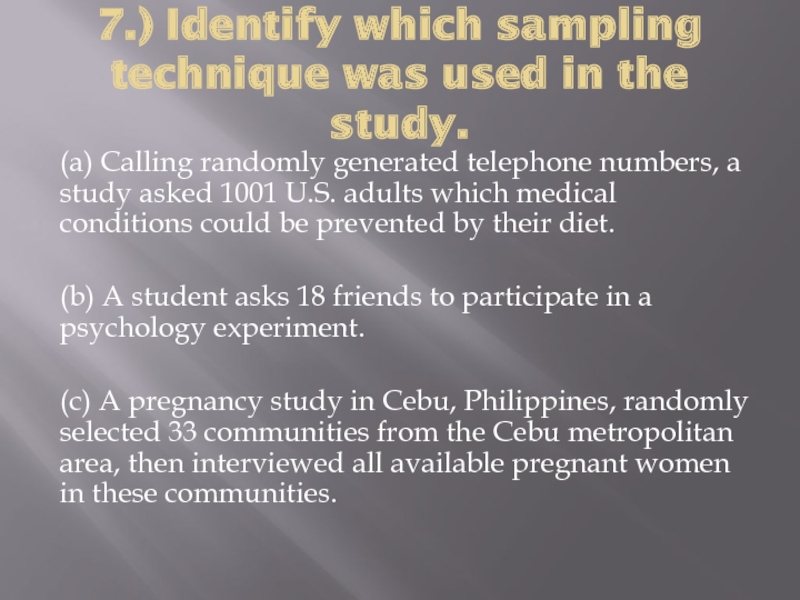
Слайд 117.) Identify which sampling technique was used in the study.
(a)
(b) A student asks 18 friends to participate in a psychology experiment.
(c) A pregnancy study in Cebu, Philippines, randomly selected 33 communities from the Cebu metropolitan area, then interviewed all available pregnant women in these communities.
Слайд 12Sampling technique, cont’d
(d) Law enforcement officials stop and check the driver
(e) Twenty-five students are randomly selected form each grade level at a high school and surveyed about their study habits.
(f) A journalist interviews 154 people waiting at an airport baggage claim and asks them how safe they feel during air travel.
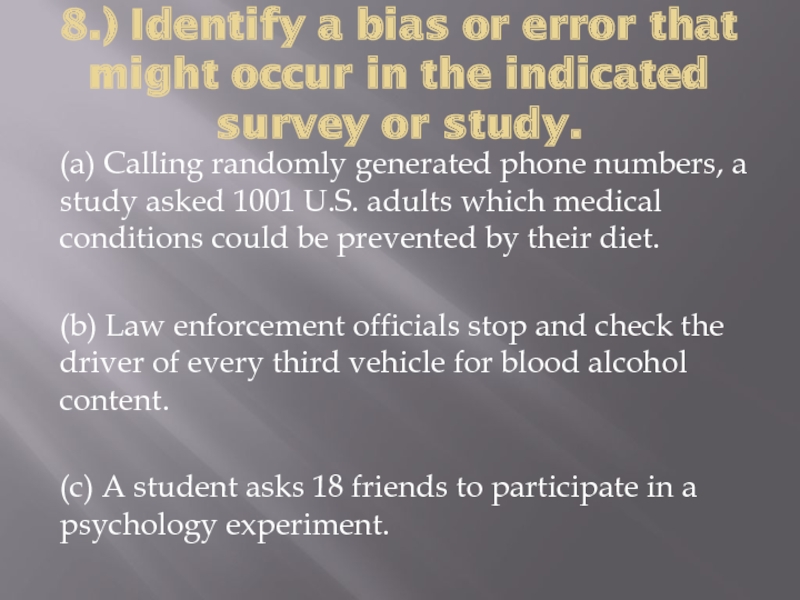
Слайд 138.) Identify a bias or error that might occur in the
(a) Calling randomly generated phone numbers, a study asked 1001 U.S. adults which medical conditions could be prevented by their diet.
(b) Law enforcement officials stop and check the driver of every third vehicle for blood alcohol content.
(c) A student asks 18 friends to participate in a psychology experiment.

