- Главная
- Разное
- Дизайн
- Бизнес и предпринимательство
- Аналитика
- Образование
- Развлечения
- Красота и здоровье
- Финансы
- Государство
- Путешествия
- Спорт
- Недвижимость
- Армия
- Графика
- Культурология
- Еда и кулинария
- Лингвистика
- Английский язык
- Астрономия
- Алгебра
- Биология
- География
- Детские презентации
- Информатика
- История
- Литература
- Маркетинг
- Математика
- Медицина
- Менеджмент
- Музыка
- МХК
- Немецкий язык
- ОБЖ
- Обществознание
- Окружающий мир
- Педагогика
- Русский язык
- Технология
- Физика
- Философия
- Химия
- Шаблоны, картинки для презентаций
- Экология
- Экономика
- Юриспруденция
Academic english презентация
Содержание

Слайд 3Introduction
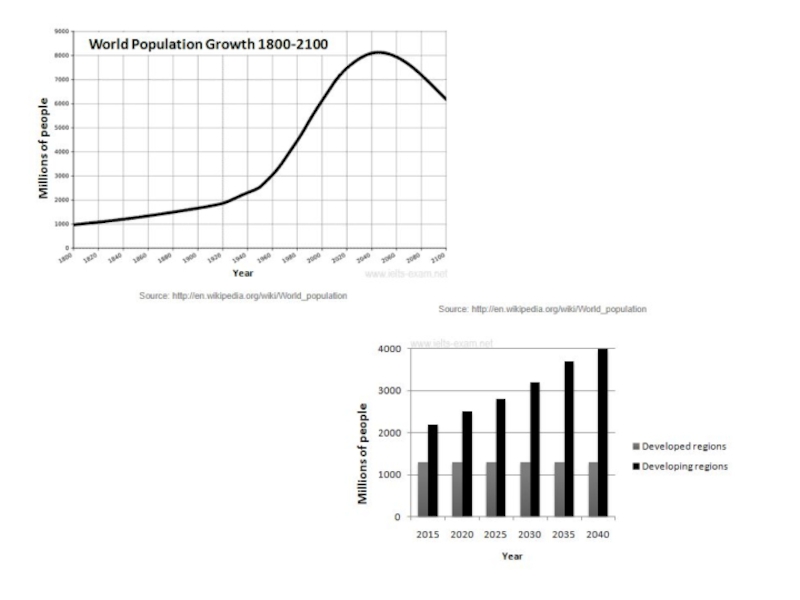
The first graph shows the trend in world population growth between
1800 and 2100, while the second graph gives predicted urban population figures for the next 25 years.

Слайд 4Description
The world population has experienced continuous growth since 1800. Between 1800
and 1950, the population grew slowly from just under 1 billion to 2.5 billion people. After that, the growth rate increased and currently the figure is around 6.5 billion. Projections show a continued increase in population in the near future, but a steady decline in the population growth rate. The global population is expected to peak at 8.2 billion by 2050, and then decline to around 6.2 billion by 2100.
The predictions also show that almost all urban population growth in the next 25 years will occur in cities of developing countries. In developed regions, on the other hand, the urban population is expected to remain unchanged at about 1.3 billion people over the next two decades.
The predictions also show that almost all urban population growth in the next 25 years will occur in cities of developing countries. In developed regions, on the other hand, the urban population is expected to remain unchanged at about 1.3 billion people over the next two decades.

Слайд 5Conclusion
The graphs show that the global population increase will not occur
evenly throughout the world, but will be greater in some areas than others.