- Главная
- Разное
- Дизайн
- Бизнес и предпринимательство
- Аналитика
- Образование
- Развлечения
- Красота и здоровье
- Финансы
- Государство
- Путешествия
- Спорт
- Недвижимость
- Армия
- Графика
- Культурология
- Еда и кулинария
- Лингвистика
- Английский язык
- Астрономия
- Алгебра
- Биология
- География
- Детские презентации
- Информатика
- История
- Литература
- Маркетинг
- Математика
- Медицина
- Менеджмент
- Музыка
- МХК
- Немецкий язык
- ОБЖ
- Обществознание
- Окружающий мир
- Педагогика
- Русский язык
- Технология
- Физика
- Философия
- Химия
- Шаблоны, картинки для презентаций
- Экология
- Экономика
- Юриспруденция
Big Trends in Big Data & Analytics презентация
Содержание
- 1. Big Trends in Big Data & Analytics
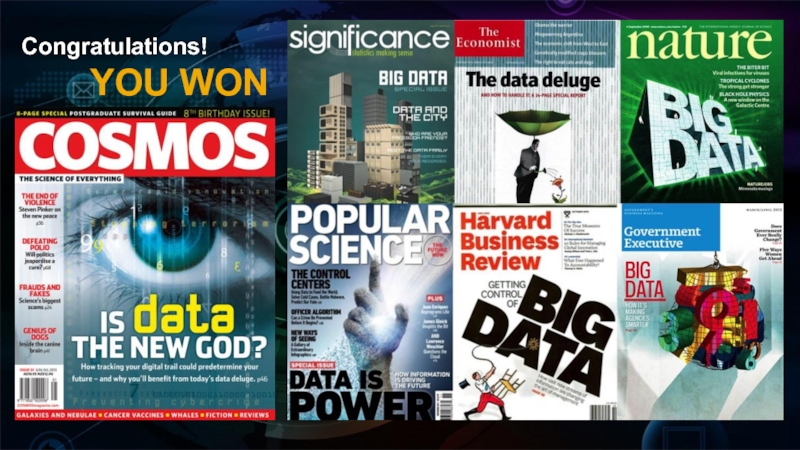
- 2. Congratulations! YOU WON
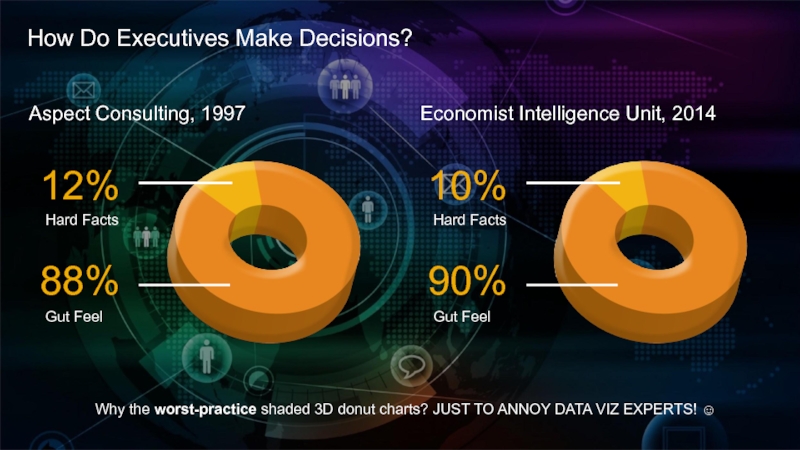
- 3. 88% How Do Executives Make Decisions? Aspect
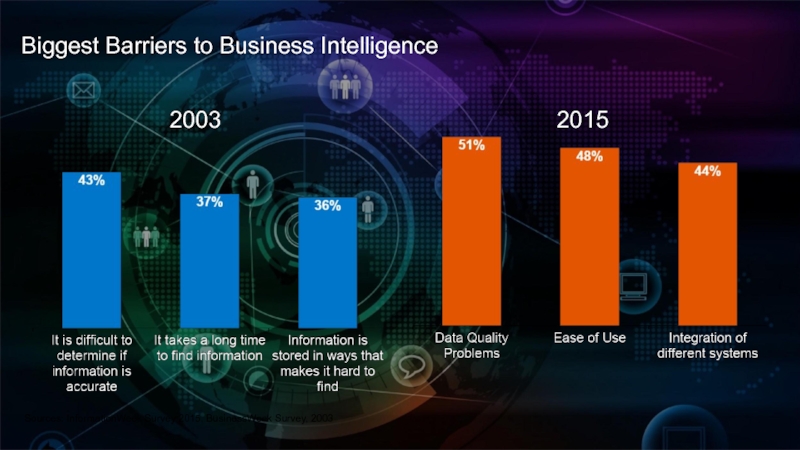
- 4. Biggest Barriers to Business Intelligence 2015 2003 Sources: InformationWeek Survey 2015, BusinessWeek Survey, 2003
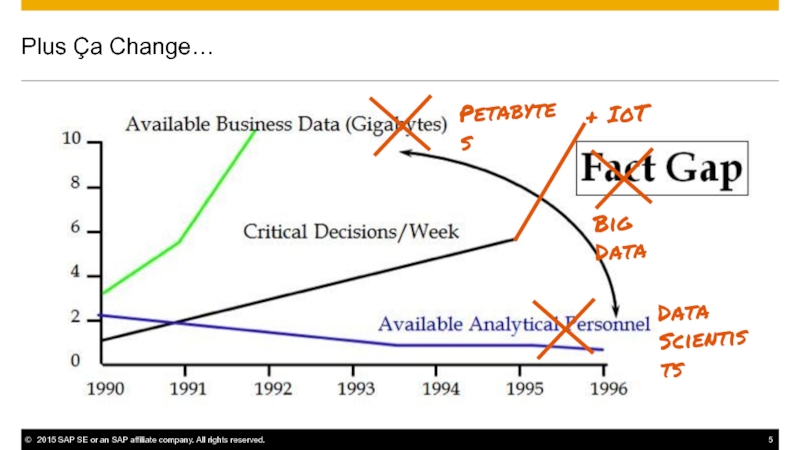
- 5. Plus Ça Change… Petabytes Data Scientists + IoT Big Data
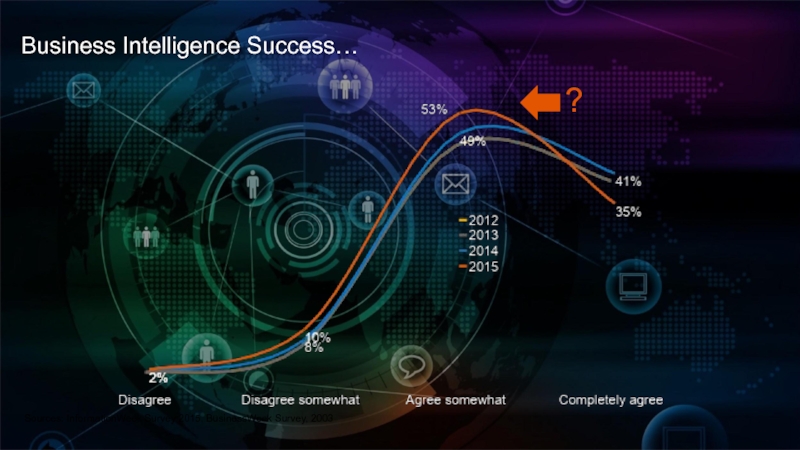
- 6. Business Intelligence Success… Sources: InformationWeek Survey 2015, BusinessWeek Survey, 2003 ?
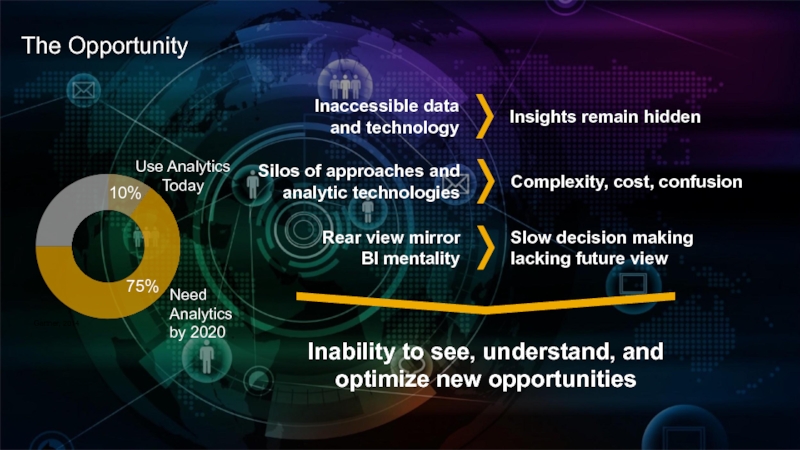
- 7. Use Analytics Today Need Analytics by
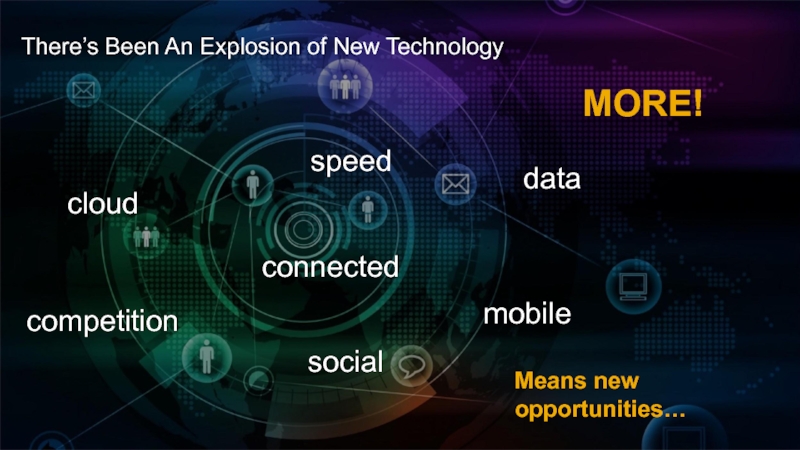
- 8. cloud data mobile MORE! competition speed social
- 9. Big Data Discovery = Big Data Data
- 10. Big Data Discovery
- 11. Big Data Discovery Simpler to use than
- 12. Potential impact per user Potential
- 13. New Products & Services
- 14. The Opportunity
- 15. SAP’s Opportunity Big Data Discovery SAP HANA
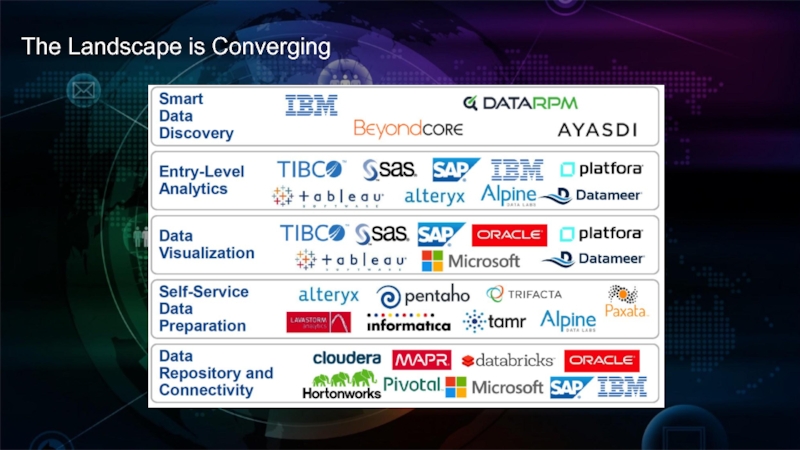
- 16. The Landscape is Converging
- 17. May Imply Differently Sliced Products?
- 18. Boardroom Redefined Source: In-Memory Data Management: An
- 19. “Intricate calculations of sales by territories
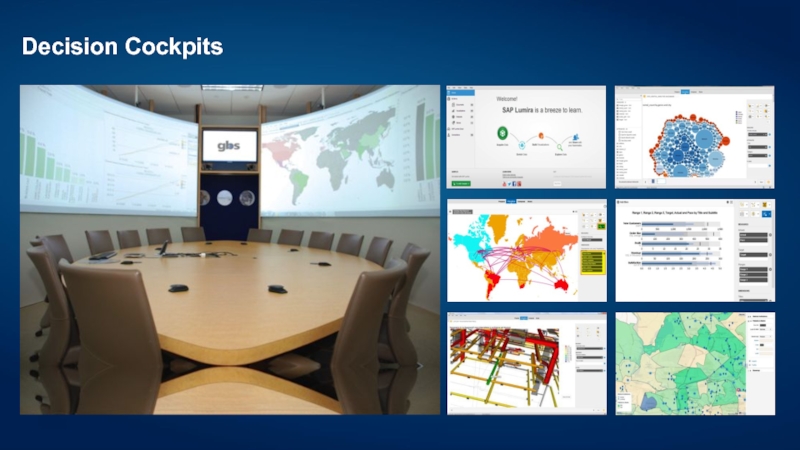
- 20. Decision Cockpits
- 22. Wal-Mart’s Data Café (“Collaborative Analytics Facilities for
- 23. Mercy Health Mercy Named One of Nation’s
- 24. Hadoop Rising (?) 1Q 2014 1Q 2015 1Q 2013
- 25. The End of the Hadoop Honeymoon? "Despite
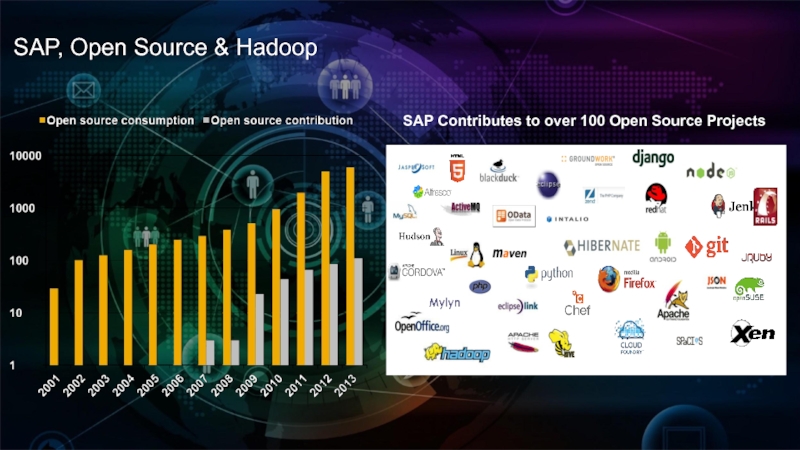
- 26. SAP, Open Source & Hadoop SAP Contributes to over 100 Open Source Projects
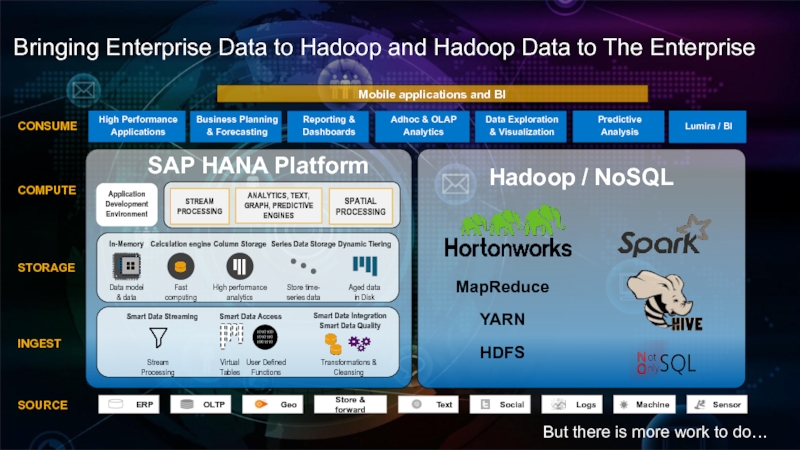
- 27. Bringing Enterprise Data to Hadoop and Hadoop
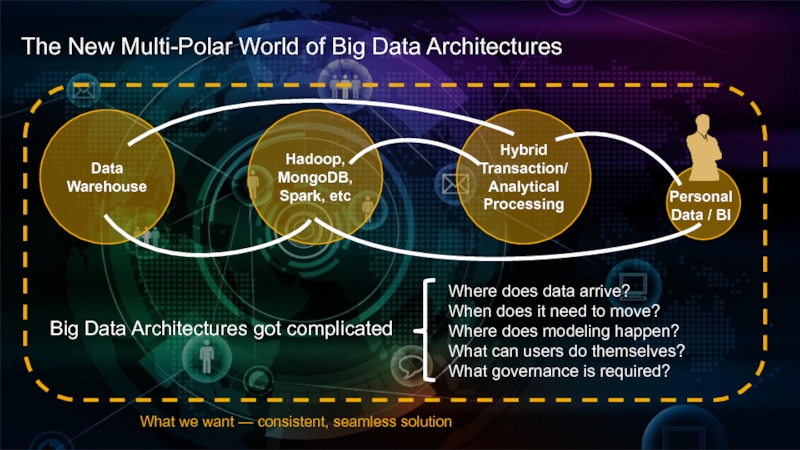
- 28. The New Multi-Polar World of Big Data
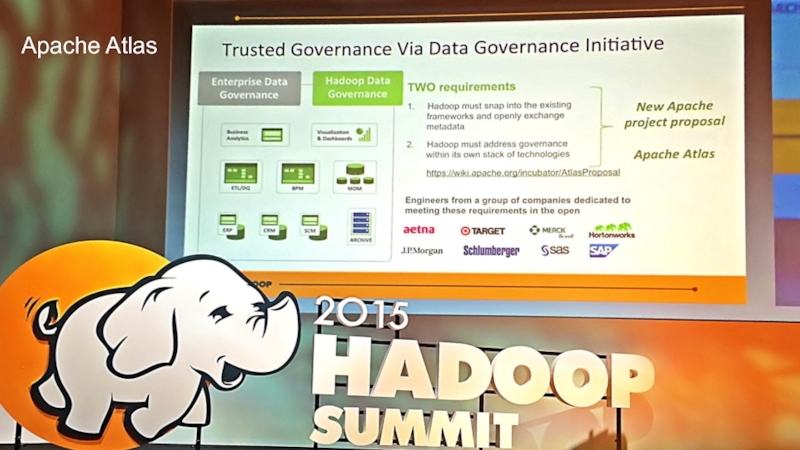
- 29. Apache Atlas
- 30. Data Wrangling Eats Into ETL “We
- 31. Data Preparation is a Highly Iterative and
- 32. Self-service Data Preparation Tools Reduce the Time
- 33. SAP Agile Data Preparation: Cleanse
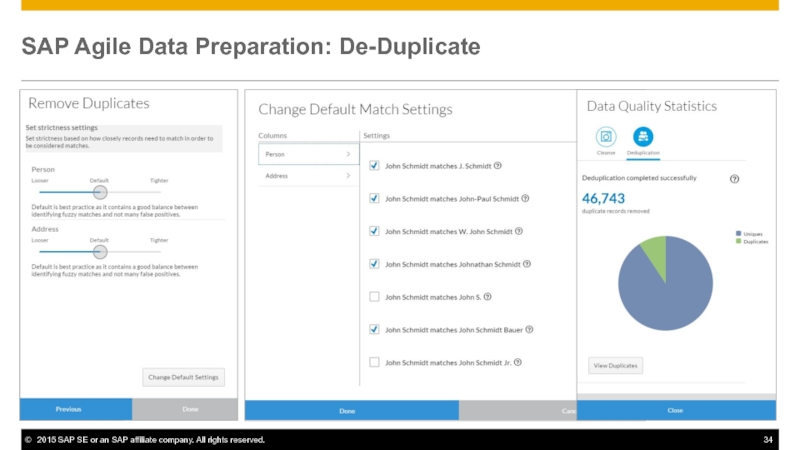
- 34. SAP Agile Data Preparation: De-Duplicate
- 35. SAP Agile Data Preparation: Merge
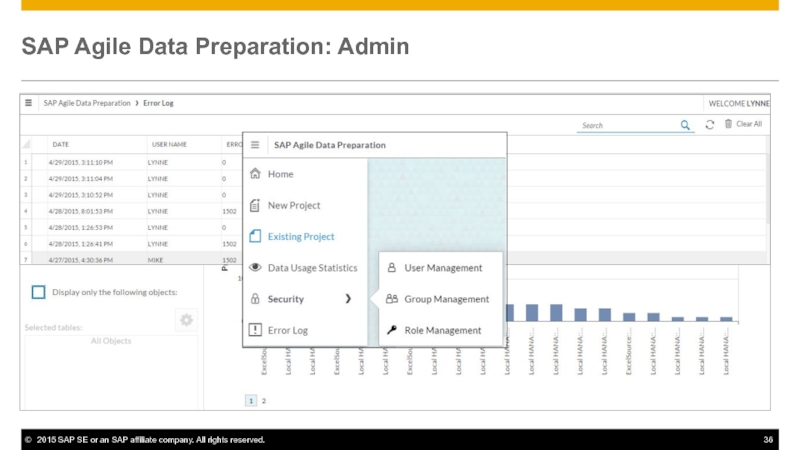
- 36. SAP Agile Data Preparation: Admin
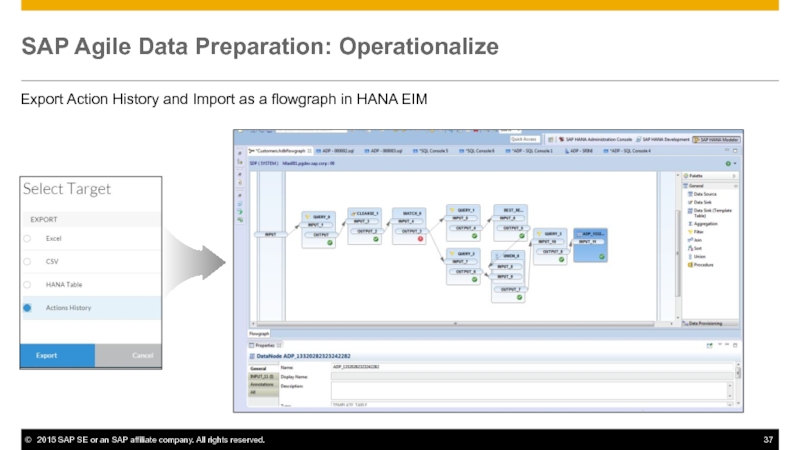
- 37. SAP Agile Data Preparation: Operationalize Export Action
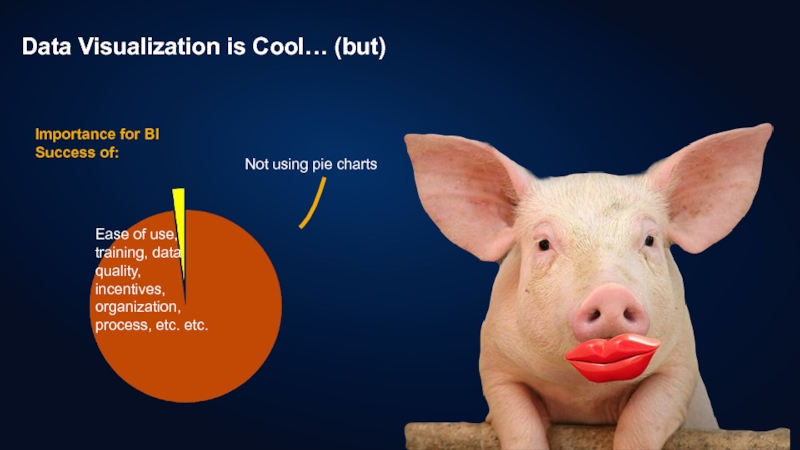
- 38. Data Visualization is Cool… (but) Not using
- 39. We Still Need Reporting and Dashboards! Source:
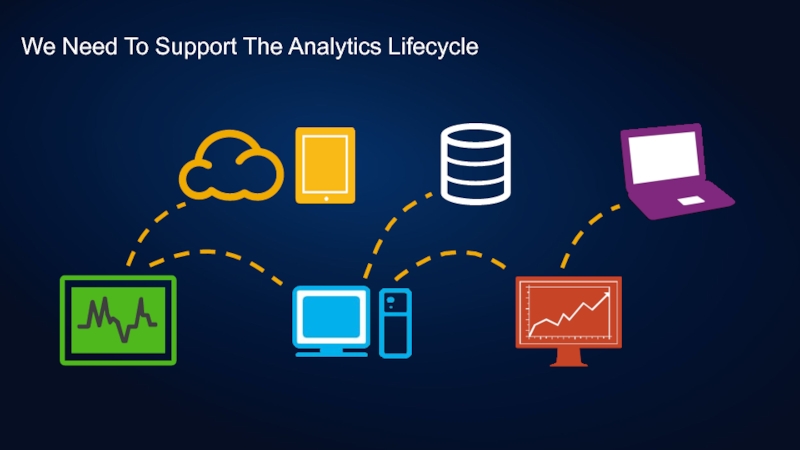
- 40. We Need To Support The Analytics Lifecycle
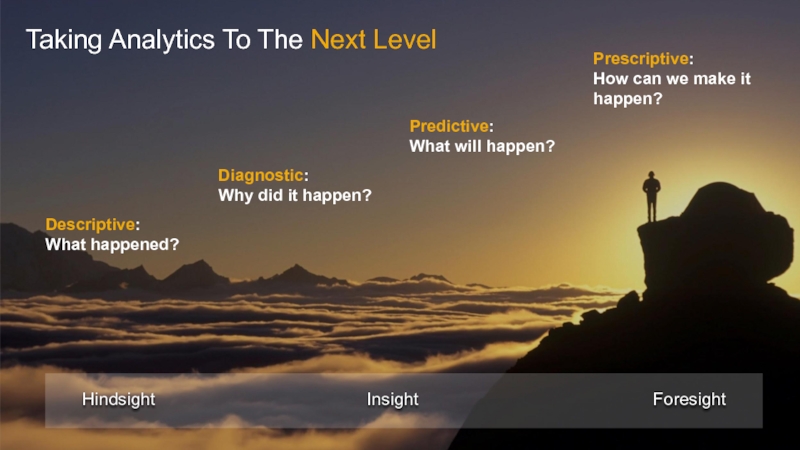
- 41. Descriptive: What happened? Diagnostic: Why did
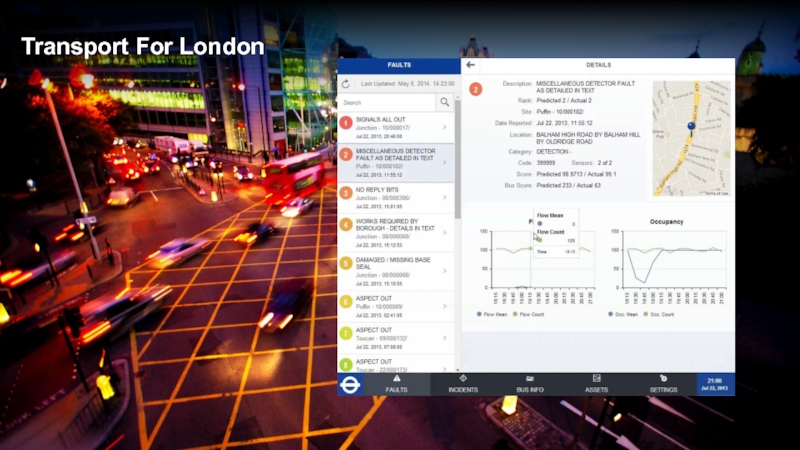
- 42. Transport For London
- 43. Centerpoint Energy
- 44. DATA SCIENCE QUIZ. These numbers were
- 45. Benford’s Law Distribution of the first digit
- 46. 1999 to 2009 “Greece shows the
- 48. Kaeser Compressors Enabling Predictive Maintenance A global
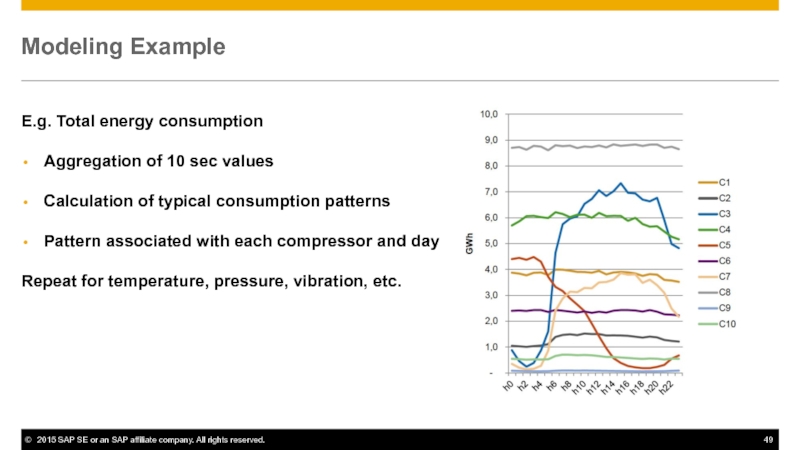
- 49. Modeling Example E.g. Total energy consumption Aggregation
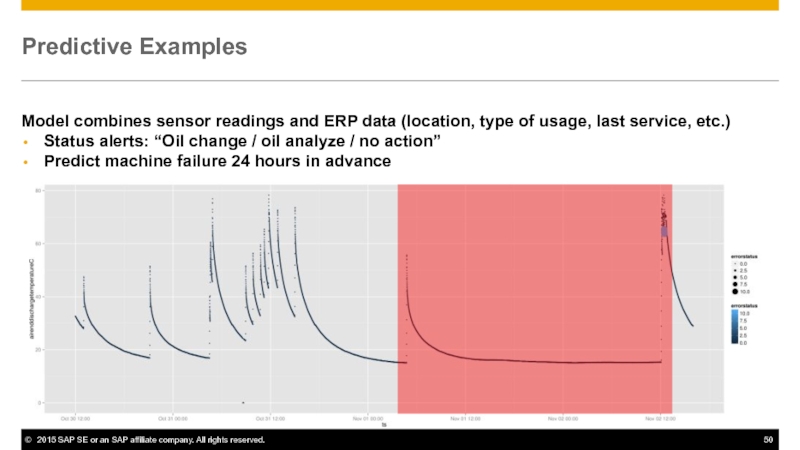
- 50. Predictive Examples Model combines sensor readings and
- 51. High-Level Technical View Predictive Model (in-memory) Long-term
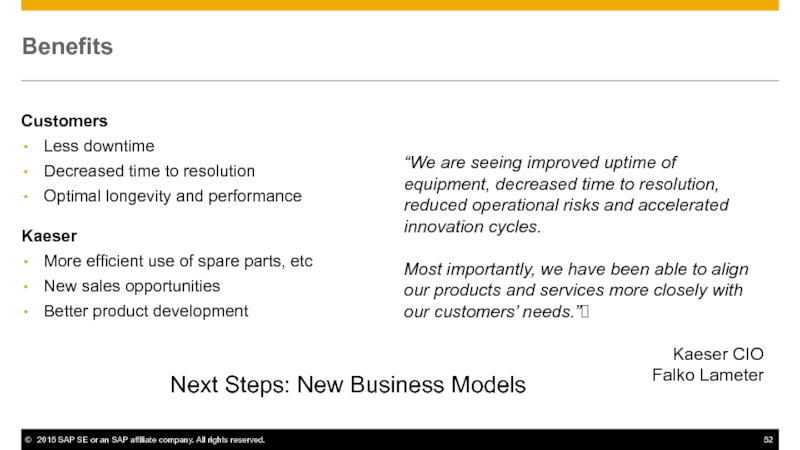
- 52. Benefits Customers Less downtime Decreased time to
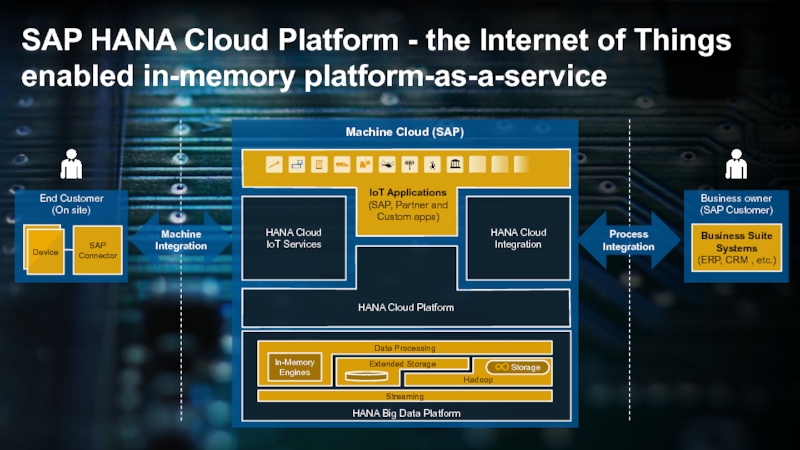
- 53. SAP HANA Cloud Platform -
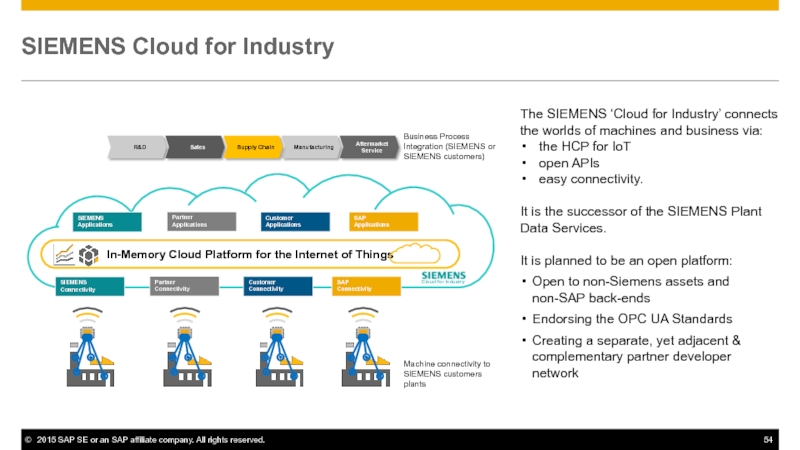
- 54. SIEMENS Cloud for Industry The SIEMENS ‘Cloud
- 55. Tweeting Sharks!
- 56. Drones
- 57. Time to Reach For The Clouds?
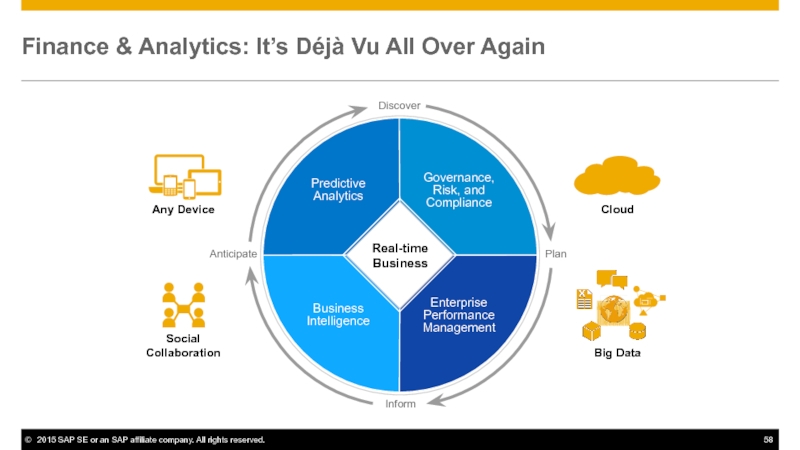
- 58. Finance & Analytics: It’s Déjà Vu All
- 59. Is This Your Finance Team? "With 90% certainty, here’s where we closed last month…"
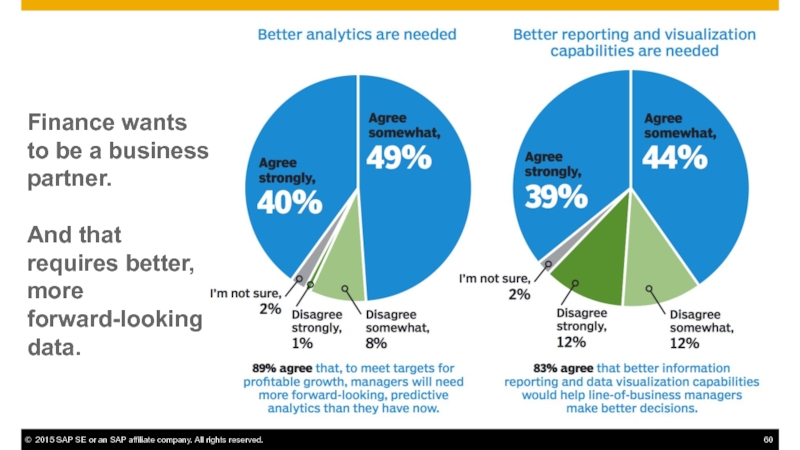
- 60. Finance wants to be a business partner.
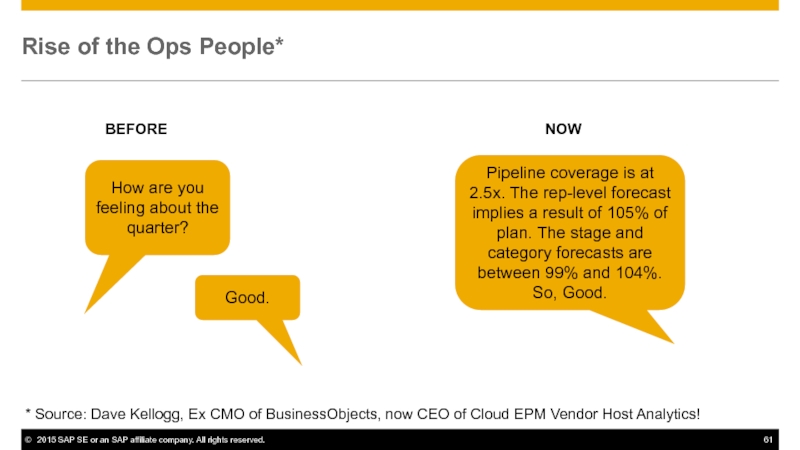
- 61. Rise of the Ops People* How are
- 62. Ops People Everywhere = Financial & Analytics
- 63. Planning For The Rest of Us
- 64. It’s Not You, It’s Your Data… “We
- 65. Suits vs. Hoodies
- 66. Advanced Governance Central IT no longer has
- 67. Build and Nurture a Community Regular
- 68. Conclusion: There’s a LOT Going On in
- 69. “Judge a man by his questions rather
- 70. Thank You! Timo Elliott VP, Global innovation Evangelist Timo.Elliott@sap.com @timoelliott timoelliott.com/docs/UKISUG_top_analytic_trends.zip
Слайд 1Big Trends in Big Data & Analytics
Timo Elliott
VP, Global Innovation Evangelist
AKA
Слайд 388%
How Do Executives Make Decisions?
Aspect Consulting, 1997
12%
Hard Facts
Gut Feel
90%
10%
Hard Facts
Gut Feel
Economist
Why the worst-practice shaded 3D donut charts? JUST TO ANNOY DATA VIZ EXPERTS! ☺
Слайд 4Biggest Barriers to Business Intelligence
2015
2003
Sources: InformationWeek Survey 2015, BusinessWeek Survey, 2003
Слайд 6Business Intelligence Success…
Sources: InformationWeek Survey 2015, BusinessWeek Survey, 2003
?
Слайд 7Use Analytics
Today
Need
Analytics
by 2020
Gartner, 2014
The Opportunity
Inability to see, understand, and optimize
Inaccessible data
and technology
Insights remain hidden
Complexity, cost, confusion
Silos of approaches and analytic technologies
75%
10%
Slow decision making lacking future view
Rear view mirror
BI mentality
Слайд 8cloud
data
mobile
MORE!
competition
speed
social
connected
There’s Been An Explosion of New Technology
Means new opportunities…
Слайд 9Big Data Discovery
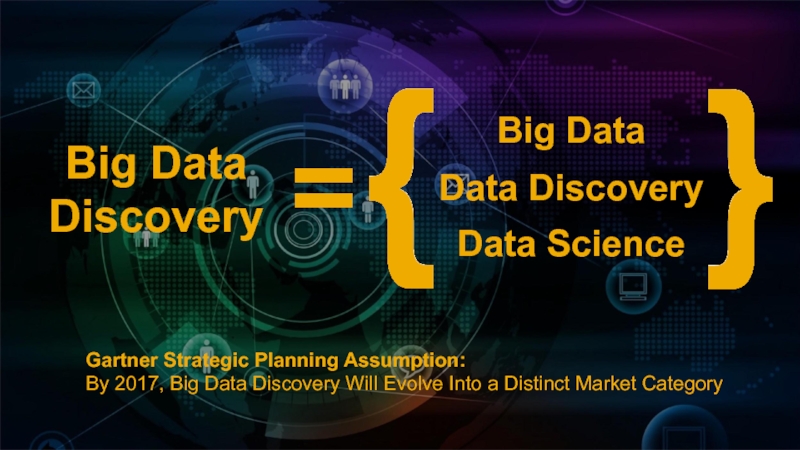
=
Big Data
Data Discovery
Data Science
Gartner Strategic Planning Assumption:
By 2017,
Слайд 10Big Data Discovery
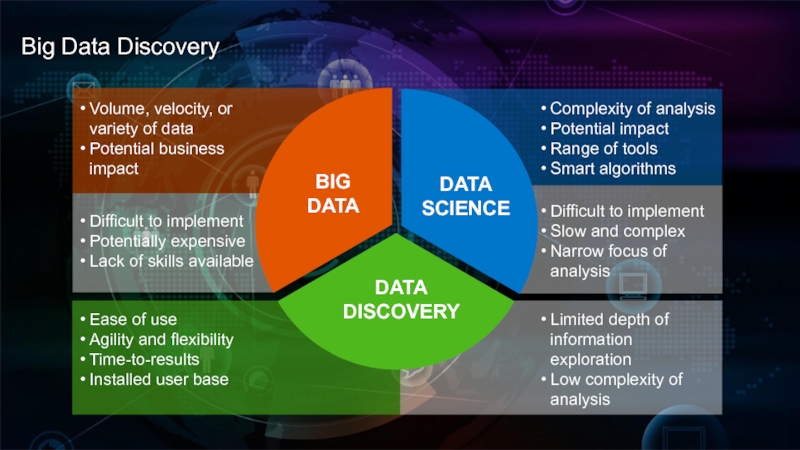
Volume, velocity, or variety of data
Potential business impact
Difficult to
Potentially expensive
Lack of skills available
Ease of use
Agility and flexibility
Time-to-results
Installed user base
Complexity of analysis
Potential impact
Range of tools
Smart algorithms
Difficult to implement
Slow and complex
Narrow focus of analysis
Limited depth of information exploration
Low complexity of analysis
BIG
DATA
DATA
SCIENCE
DATA
DISCOVERY
Слайд 11Big Data Discovery
Simpler to use than data science
Accessible to a wider
Broad range of data manipulation features
Able to handle new types of data sources
With adequate performance for big data
BIG
DATA
DISCOVERY
Слайд 12
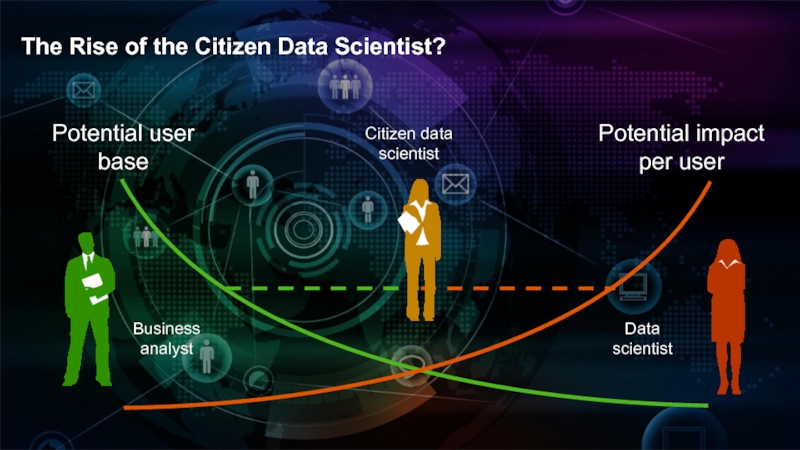
Potential impact per user
Potential user base
The Rise of the Citizen Data
Business analyst
Data scientist
Citizen data scientist
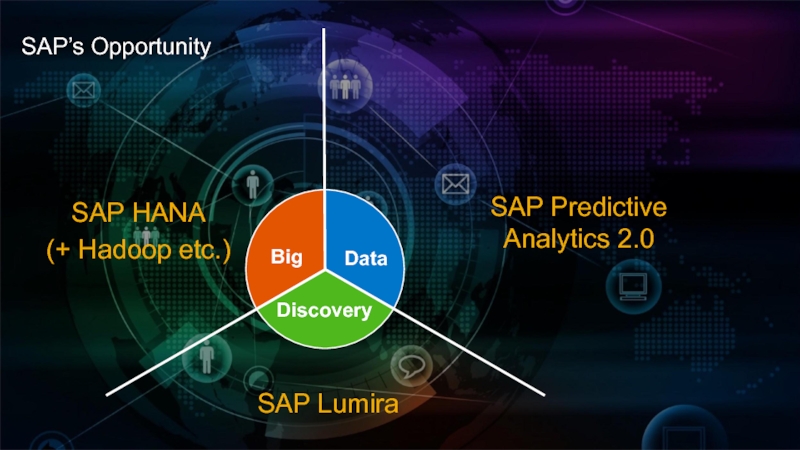
Слайд 15SAP’s Opportunity
Big
Data
Discovery
SAP HANA
(+ Hadoop etc.)
SAP Predictive Analytics 2.0
SAP Lumira
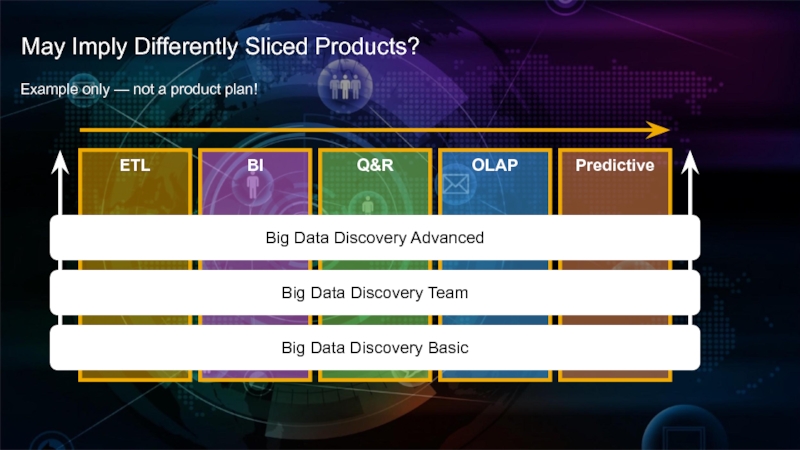
Слайд 17May Imply Differently Sliced Products?
Big Data Discovery Basic
Big Data Discovery Team
ETL
BI
Q&R
OLAP
Predictive
Big
Example only — not a product plan!
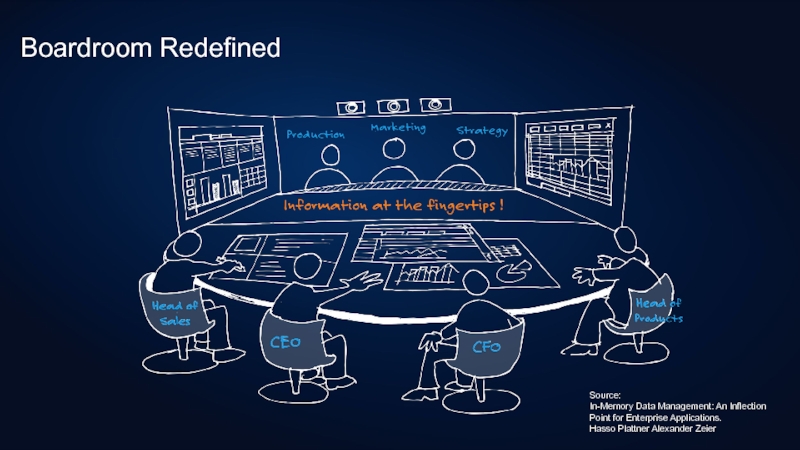
Слайд 18Boardroom Redefined
Source:
In-Memory Data Management: An Inflection Point for Enterprise Applications.
Hasso
Слайд 19
“Intricate calculations of sales by territories will appear as if by
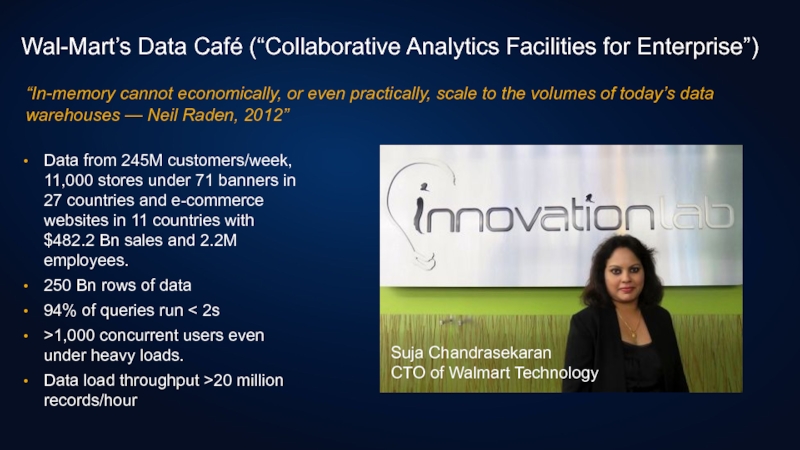
Слайд 22Wal-Mart’s Data Café (“Collaborative Analytics Facilities for Enterprise”)
Data from 245M customers/week,
250 Bn rows of data
94% of queries run < 2s
>1,000 concurrent users even under heavy loads.
Data load throughput >20 million records/hour
Suja Chandrasekaran
CTO of Walmart Technology
“In-memory cannot economically, or even practically, scale to the volumes of today’s data warehouses — Neil Raden, 2012”
Слайд 23Mercy Health
Mercy Named One of Nation’s Most Wired for 11th Year
40K
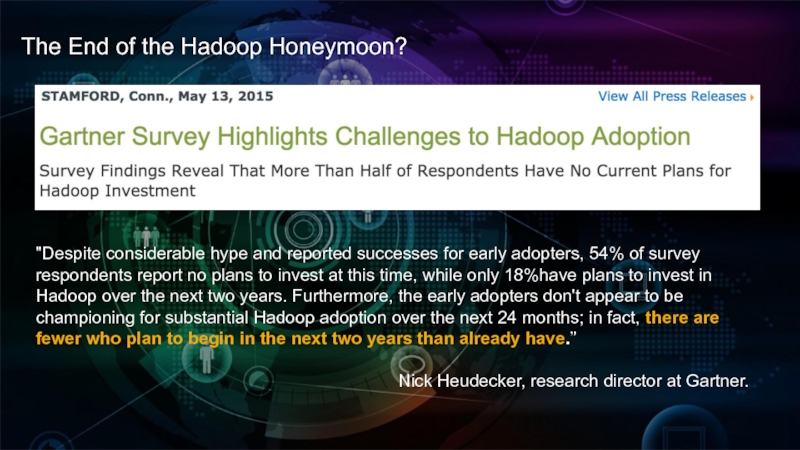
Слайд 25The End of the Hadoop Honeymoon?
"Despite considerable hype and reported successes
Nick Heudecker, research director at Gartner.
Слайд 27Bringing Enterprise Data to Hadoop and Hadoop Data to The Enterprise
SPATIAL
ANALYTICS, TEXT, GRAPH, PREDICTIVE ENGINES
CONSUME
COMPUTE
STORAGE
SOURCE
INGEST
Transformations & Cleansing
Smart Data Integration
Smart Data Quality
Stream
Processing
Smart Data Streaming
STREAM PROCESSING
Mobile applications and BI
Smart Data Access
Virtual Tables
User Defined
Functions
But there is more work to do…
Слайд 28The New Multi-Polar World of Big Data Architectures
Data Warehouse
Hybrid Transaction/Analytical
Hadoop,
MongoDB,
Spark, etc
Where does data arrive?
When does it need to move?
Where does modeling happen?
What can users do themselves?
What governance is required?
Big Data Architectures got complicated
What we want — consistent, seamless solution
Слайд 30
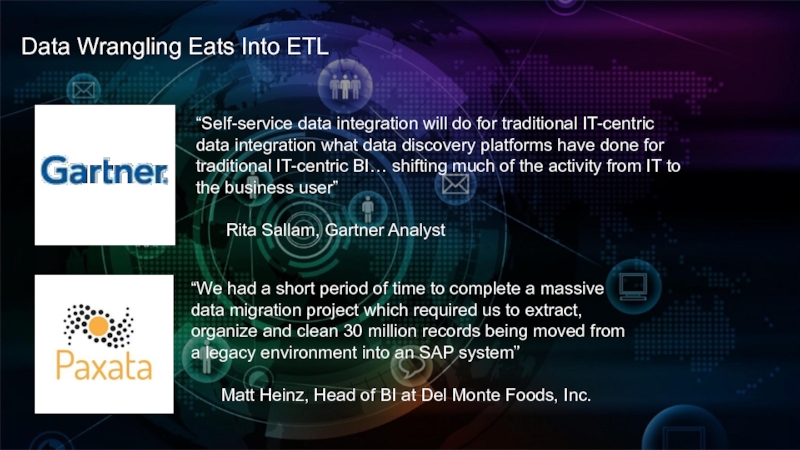
Data Wrangling Eats Into ETL
“We had a short period of time
Matt Heinz, Head of BI at Del Monte Foods, Inc.
“Self-service data integration will do for traditional IT-centric data integration what data discovery platforms have done for traditional IT-centric BI… shifting much of the activity from IT to the business user”
Rita Sallam, Gartner Analyst
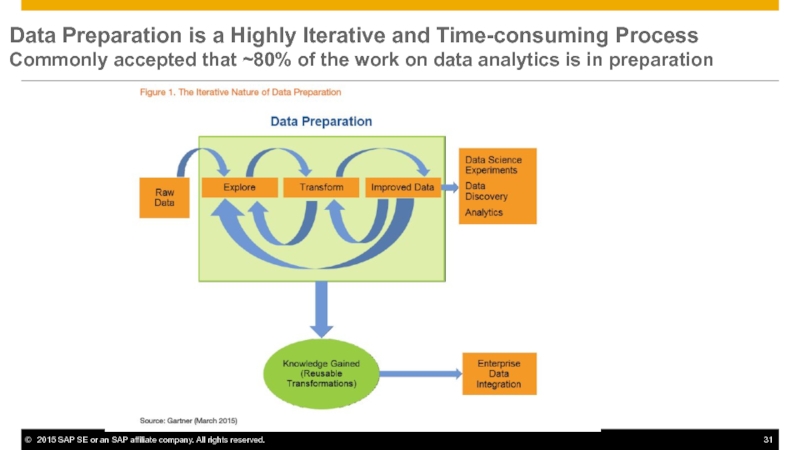
Слайд 31Data Preparation is a Highly Iterative and Time-consuming Process Commonly accepted that
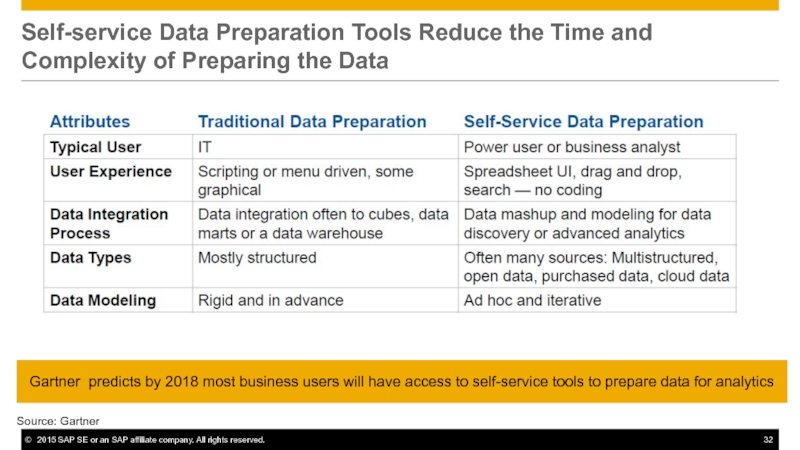
Слайд 32Self-service Data Preparation Tools Reduce the Time and Complexity of Preparing
Source: Gartner
Gartner predicts by 2018 most business users will have access to self-service tools to prepare data for analytics
Слайд 37SAP Agile Data Preparation: Operationalize
Export Action History and Import as a
Слайд 38Data Visualization is Cool… (but)
Not using pie charts
Ease of use, training,
Importance for BI Success of:
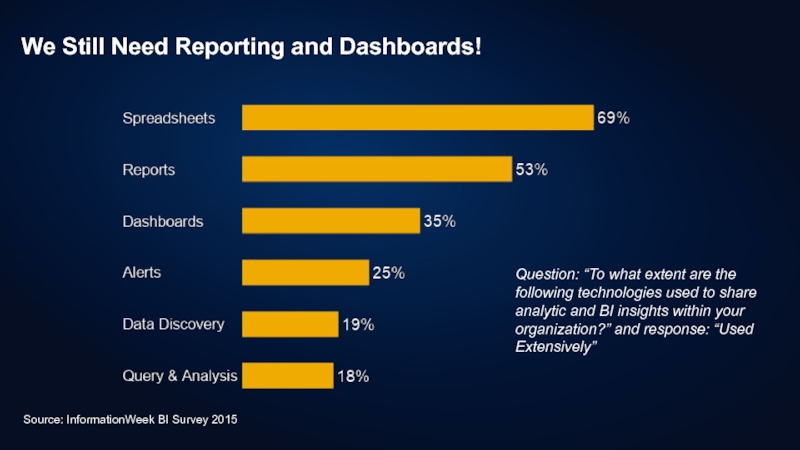
Слайд 39We Still Need Reporting and Dashboards!
Source: InformationWeek BI Survey 2015
Question: “To
Слайд 41
Descriptive:
What happened?
Diagnostic:
Why did it happen?
Predictive:
What will happen?
Prescriptive:
How can we make it
Taking Analytics To The Next Level
Hindsight
Insight
Foresight
Слайд 44
DATA SCIENCE
QUIZ.
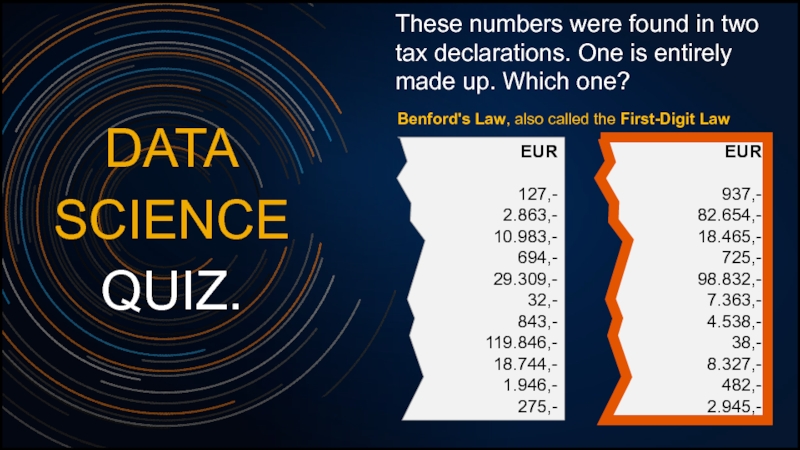
These numbers were found in two tax declarations. One is
EUR
127,-
2.863,-
10.983,-
694,-
29.309,-
32,-
843,-
119.846,-
18.744,-
1.946,-
275,-
EUR
937,-
82.654,-
18.465,-
725,-
98.832,-
7.363,-
4.538,-
38,-
8.327,-
482,-
2.945,-
Benford's Law, also called the First-Digit Law
Слайд 45Benford’s Law
Distribution of the first digit of real-world sets of numbers
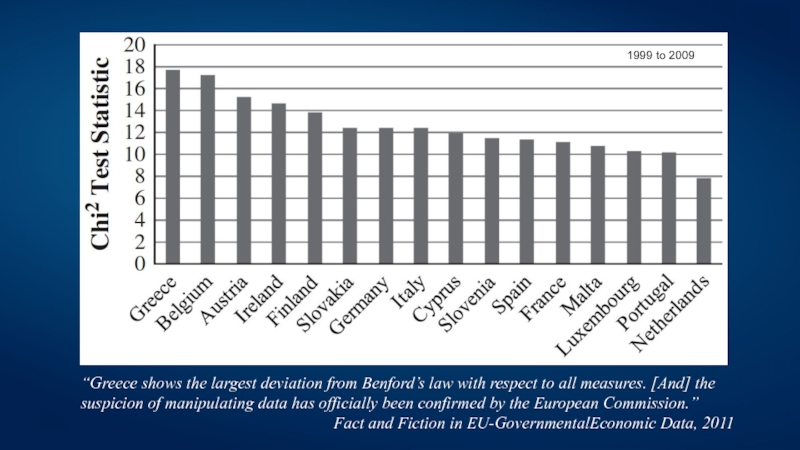
Слайд 46 1999 to 2009
“Greece shows the largest deviation from Benford’s law
Fact and Fiction in EU-GovernmentalEconomic Data, 2011
Слайд 47
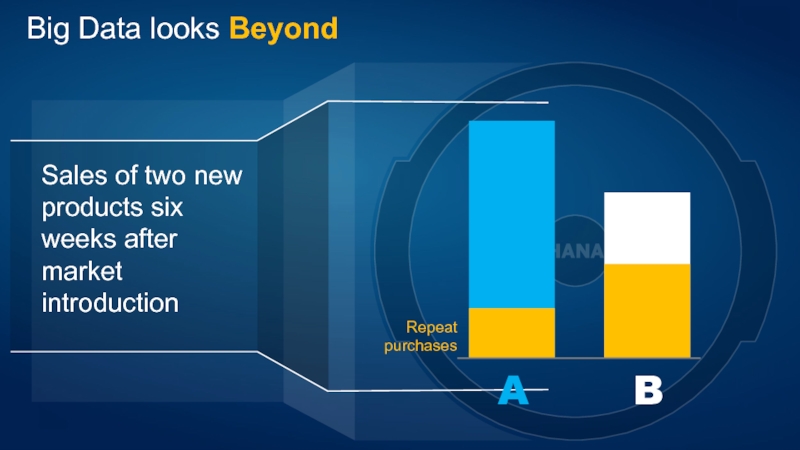
Repeat purchases
A
B
Big Data looks Beyond
Sales of two new products six weeks
Слайд 48Kaeser Compressors
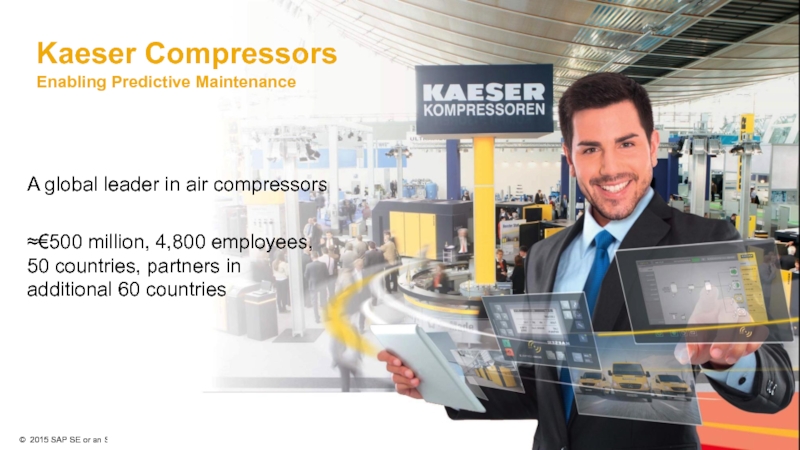
Enabling Predictive Maintenance
A global leader in air compressors
≈€500 million, 4,800
Слайд 49Modeling Example
E.g. Total energy consumption
Aggregation of 10 sec values
Calculation of typical
Pattern associated with each compressor and day
Repeat for temperature, pressure, vibration, etc.
Слайд 50Predictive Examples
Model combines sensor readings and ERP data (location, type of
Status alerts: “Oil change / oil analyze / no action”
Predict machine failure 24 hours in advance
Слайд 51High-Level Technical View
Predictive Model
(in-memory)
Long-term disk storage
User Interfaces
CRM
ERP
Event Stream Processing
all
sampled
Customer
Field Svs
Sales
R&D
DW
Слайд 52Benefits
Customers
Less downtime
Decreased time to resolution
Optimal longevity and performance
Kaeser
More efficient use of
New sales opportunities
Better product development
“We are seeing improved uptime of equipment, decreased time to resolution, reduced operational risks and accelerated innovation cycles.
Most importantly, we have been able to align our products and services more closely with our customers’ needs.”
Kaeser CIO
Falko Lameter
Next Steps: New Business Models
Слайд 53
SAP HANA Cloud Platform - the Internet of Things enabled in-memory
Machine Cloud (SAP)
HANA Cloud
IoT Services
End Customer
(On site)
Business owner
(SAP Customer)
HANA Cloud Integration
Business Suite Systems
(ERP, CRM , etc.)
SAP Connector
Device
HANA Cloud Platform
Machine Integration
Process Integration
IoT Applications
(SAP, Partner and
Custom apps)
Слайд 54SIEMENS Cloud for Industry
The SIEMENS ‘Cloud for Industry’ connects the worlds
the HCP for IoT
open APIs
easy connectivity.
It is the successor of the SIEMENS Plant Data Services.
It is planned to be an open platform:
Open to non-Siemens assets and non-SAP back-ends
Endorsing the OPC UA Standards
Creating a separate, yet adjacent & complementary partner developer network
Partner
Connectivity
Customer
Connectivity
SAP
Connectivity
SIEMENS
Connectivity
Partner
Applications
Customer
Applications
SAP
Applications
SIEMENS
Applications
Machine connectivity to SIEMENS customers plants
Business Process Integration (SIEMENS or SIEMENS customers)
Cloud for Industry
Слайд 58Finance & Analytics: It’s Déjà Vu All Over Again
Cloud
Enterprise
Performance
Management
Governance,
Risk, and
Compliance
Discover
Inform
Anticipate
Plan
Business
Intelligence
Predictive
Analytics
Real-time
Business
Слайд 60Finance wants to be a business partner.
And that requires better,
Слайд 61Rise of the Ops People*
How are you feeling about the quarter?
Good.
Pipeline
BEFORE
NOW
* Source: Dave Kellogg, Ex CMO of BusinessObjects, now CEO of Cloud EPM Vendor Host Analytics!
Слайд 62Ops People Everywhere = Financial & Analytics
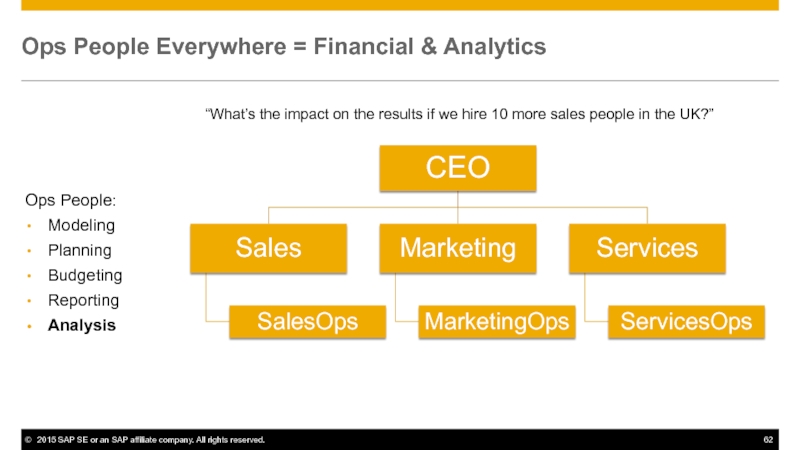
Ops People:
Modeling
Planning
Budgeting
Reporting
Analysis
“What’s the impact on
Слайд 64It’s Not You, It’s Your Data…
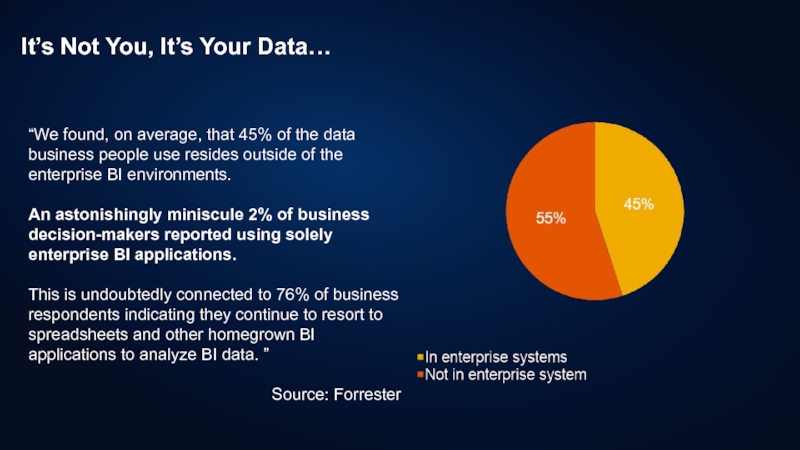
“We found, on average, that 45%
An astonishingly miniscule 2% of business decision-makers reported using solely enterprise BI applications.
This is undoubtedly connected to 76% of business respondents indicating they continue to resort to spreadsheets and other homegrown BI applications to analyze BI data. ”
Source: Forrester
Слайд 66Advanced Governance
Central IT no longer has a veto — you need
This means you have to behave more like a politician…
Vote for my policies!
Слайд 67
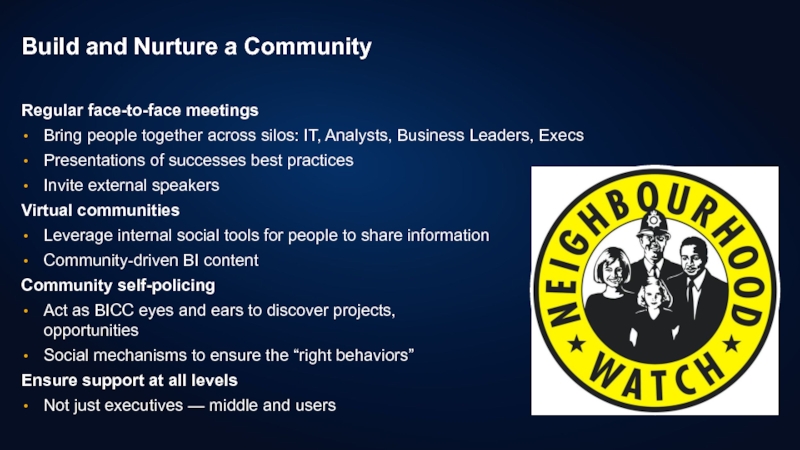
Build and Nurture a Community
Regular face-to-face meetings
Bring people together across silos:
Presentations of successes best practices
Invite external speakers
Virtual communities
Leverage internal social tools for people to share information
Community-driven BI content
Community self-policing
Act as BICC eyes and ears to discover projects, opportunities
Social mechanisms to ensure the “right behaviors”
Ensure support at all levels
Not just executives — middle and users
Слайд 68Conclusion: There’s a LOT Going On in Analytics
The future of the
SAP HANA & Hadoop
Multi-polar big data architectures
Self-service data preparation
Supporting the analytics lifecycle
Prescriptive and predictive analytics
Internet of things for business
Big data discovery
Finance and analytics converge (again)
Analytics culture & governance
Слайд 69“Judge a man by his questions rather than his answers.”
Voltaire
“Status Quo
Ronald Reagan
“Any intelligent fool can make things bigger and more complex. It takes a touch of genius and a lot of courage to move in the opposite direction.”
E.F. Schumacher
